Proceedings of the International MultiConference of Engineers and Computer Scientists 2009 Vol I IMECS 2009, March 18 - 20, 2009, Hong Kong
Multilevel Minimum Cross Entropy Threshold Selection based on Honey Bee Mating Optimization Ming-Huwi Horng, Member, IAENG, Ting-Wei Jiang and Jin-Yi Chen Abstract—Image entropy thresholding approach has drawn the attentions in image segmentation. The endeavor of this paper is focused on multilevel thresholding using the minimum cross entropy criterion. In the literature, the particle swarm optimization (PSO) had been applied to conducting the threshold selection. The adopted algorithm used in this paper is the honey bee mating optimization (HBMO). In experiments, the two different methods are implemented for comparison with the results of segmentation. Compared to the results of PSO, the threshold selection of HBMO is more close to the optimal ones examined by the exhaustive search method. Furthermore, the segmentation result of HBMO is superior to PSO method, but it still slower than ones of PSO Index Terms—Image segmentation, Image thresholding, Cross entropy, Particle swarm optimization, Honey bee mating optimization
I. INTRODUCTION Image thresholding is a basic component of many computer vision systems. While humans can easily differentiable an object from complex background, image thresholding is a difficult task for separate them. The gray-level histogram of an image is usually considered as efficient tools for development of image thresholding algorithms. The main objective is to determine a threshold for bi-level thresholding or several thresholds for multi-level thresholding for image segmentations. Several algorithms of multi-level thresholding have been proposed in literature that included the works of Kapur et al [1], Otsu [ 2]a n df a s tOs t u ’ s implementation [3]. Among the tremendous amount of image thresholding techniques, entropy-based approaches have drawn many attentions. Yin [4] proposed a new method that adopts the particle swarm optimization to select the thresholds based on the minimum cross-entropy. Madhubanti et al. Uses Manuscript received January 7, 2009. This work was supported in part by the National Science council, ROC, under Grant No. NSC-97-2221-E-251-001. Ming-Huwi Horng is with the Department of Computer Science and Information engineering, National PingTung Institute of Commerce, No. 54 Min-Shien E.Road, PingTung, TAIWAN. (corresponding author to provide phone: 886-8-7238700 ext. 3800; fax: 886-8-7223962; e-mail:
[email protected]) Ting-Wei Jiang is a master student of the Department of Computer Science and Information engineering, National PingTung Institute of Commerce, No. 54 Min-Shien E.Road, PingTung, TAIWAN Jin-Yi Chen is a master student of the Department of Computer Science and Information engineering, National PingTung Institute of Commerce, No. 54 Min-Shien E.Road, PingTung, TAIWAN
ISBN: 978-988-17012-2-0
the hybrid cooperative- comprehensive learning PSO algorithm based on maximum entropy criterion [5]. Besides, over the last decade, modeling the behavior of social insects, such as ants and bees, for the purpose of search and problems solving has been the context of the emerging area of swarm intelligence. Therefore, the honey-bee mating may also be considered as a typical swarm-based approach for searching for the optimal solution in many application domains such as clustering [6], market segmentation [7] and benchmark mathematical problems [8]. Honey-bee mating optimization (HBMO) may also be considered as a typical swarm-based approach for optimization, in which the search algorithm is inspire by the process of mating in real honey-bees. The behavior of honey-bees is the interaction of their (1) genetic potentiality. (2) ecological and physiological environments, and (3) the social conditions of the colony, as well as various prior and ongoing interactions between these three parameters. This paper introduces a new approach for multi-level thresholding adopted the honey bee mating optimization based on the minimun cross-entropy criterion. The rest of the paper is organized as follows. Section 2 introduces the honey bees mating optimization. Section 3 presents the multilevel thresholding using HBMO. Performance evaluation is presented in detail in Section 4 Conclusions are presented in Section 5. II. HONEY BEE MATING OPTIMIZATION A honeybee colony typically consists of a single egg-laying long-lived queen, anywhere from zero to several thousands drones. Queens are specialized in egg laying. A colony may contain one queen or more during its life cycle, which named monogynous and/or polygynous. A queen bee may live up to 5 or 6 years, whereas worker bee and drones never live more than 6 months. After the mating processes, the drones die. The drones are the fathers of colony. They are h a pl oi da n da c ta sa mpl i f yt h e i rmot h e r ‘ sg e n ome swi t h ou t altering their genetic composition, expect through the mutation. The drones practically considered as agents that pass one of the i rmot h e r ’ sg a me t e sa n df u n c t i ont oe n a bl e females to act genetically as males. Worker bees specialized in brood care and sometimes lay eggs. Broods arise either from fertilized (represents queen or worker) or unfertilized (represents drones) eggs. In the marriage process, the queen(s) mate during their mating flights far from the nest. A mating flight starts with a
IMECS 2009
Proceedings of the International MultiConference of Engineers and Computer Scientists 2009 Vol I IMECS 2009, March 18 - 20, 2009, Hong Kong dance performed by the queen who then starts a mating flight during which the drones follow the queen and mate with her in the air. In each mating, sperm reaches the spermatheca and accumulates there to form the genetic pool of the colony. Each time a queen lays fertilized eggs, she randomly retrieves a mixture of the sperm accumulated in the spermatcheca to fertilize the egg. In practices, the mating flight may considered as a set of transitions in a state-space where the queen moves between the different states in some speed and mates with the drone encountered at each state probability. Furthermore, The queen initialized with some energy content during the flight mating and returns to her nest when the energy is within some threshold from zero to full spermatches. In the development of the algorithm, the capability of workers is restrained in brood care and thus each worker may be regarded as a heuristic that acts to improve and/or take care of a set of broods. An annealing function is used to describe the probability of a drone (D) successfully mates with the Queen (Q), shows as Eq. (1). (1) P(Q, D) exp[( f ) / S (t )] where ( f ) is the absolute difference of the fitness of D and the fitness of Q, and the S (t ) is the speed of queen at time t. Af t e re a c ht r a n s i t i onofma t i n g , t h equ e e n ’ ss pe e da n de n e r g y decays according to the following equations: S (t 1) (t ) S (t ) (2) where is the decreasing factor ( [0, 1] ). Workers adopt some heuristically mechanisms such as crossover or mutation t oi mpr ov et h ebr ood’ s genotype based on a pre-defined heuristic fitness value. The fitness of the resulting genotype is determined by evaluating the value of the objective function of the brood genotype or its normalized value. The five stages of constructing the HBMO algorithm had been proposed by M. Fathian et al. [9] that are used to develop the algorithm for multi-level image thresholding. III. PROPOSED APPROACH The proposed algorithm has two main phases. The first phase involves generating the objective function based on image entropy for later developing the HBMO algorithm. The second phase introduces the HBMO algorithms for multi-l e v e l i ma g et h r e s h ol di n gba s e dont h eM. Fa t h i a n ’ sf i v e stages model.
I ( x, y ) t , (1, t ) I t ( x, y ) (t , L 1) I ( x, y ) t ,
(4)
where b 1
b 1
i 0
i a
(a, b) ih(i ) h(i )
(5)
The cross entropy is then calculated by L
t 1
L
i 1
i 1
i t
D(t) ih(i)log(i) ih(i)log( (1,t))ih(i)log( (t, L1)).(6) The MCET determines the optimal threshold t by minimizing the cross entropy based on Eq. (6).
t * arg min t {D (t )}. (7) Since the first term is constant for a given image, the objective function can be re-written as t 1
L
(t ) ih(i ) log((1, t )) ih(i ) log( (t , L 1) i 1
i 1
t 1
ih(i)
t 1
L
L
ih(i)
1 ( ih(i )) log( it 1
t ) (ih(i )) log( i L
i 1
i t
i 1
h(i)
m1 (1, t ) log(
m1 (1, t ) m 0 (1, t )
i t
h(i)
) m1 (t , L 1) log(
)
m1 (t , L 1) m 0 (t , L 1)
)
(8)
1 b 1 1 where m 0 (a, b) bi a h(i ) and m ( a, b) i a ih(i )) are
the zero-moment and first-moment on partial range of the image histogram. Assume that it is required to select n thresholds denoted by t1 , t 2 , t 3 ,..., t c . For the convenience of computation, the two dummy thresholds t0 1, tc 1 L 1 are used. The objective function then becomes c 1
(t1 , t 2 ,..., t n ) m1 (t1 , t 2 ,...., t i ) log(
m1 (t i 1 , t i )
). (9) m 0 (t i 1 , t i ) In our proposed algorithm, we try to obtain this optimum i 1
c-dimensional vector [ t1 , t 2 , t 3 ,..., t c ] which can minimized the Eq. (9).
As HBMO are usually designed to solve
maximization problems, we construct the fitness function as the reciprocal of (t 1 , t 2 ,...., t c ) and try to maximize it.
A. Cross entropy measure criterion The cross entropy was developed by Kullback in [9]. Let F { f 1 , f 2 ,..., f N } and G {g1 , g 2 ,..., g N } be two
B. Image thresholding based on HBMO
probability distributions on the same set. The cross entropy between F and G is defined by N f D ( F , G ) f i log i (3) g i 1 i
In this paper the multi-level image thresholding using the HBMO algorithm is developed based on the popular the five stages approach proposed by M. Fathian [9]. The details of our method include five stages show as follows.
The minimum cross entropy thresholding (MCET) algorithm selects these thresholds by minimizing the cross entropy between the original image and the resulting image. Let I be the original image and h(i ) , i 1,2,..., L , be the
Stage 1: Generate the initial drone sets and queen Generate m drones with gene length c, denoted by the matrix Dmc .
corresponding histogram with L being the number of gray levels. Then the resulting image, denoted by I t , using tas the
D [ D1 , D2 ,...., Dm ] Di (d i1 , d i2 ,.....d ic )
(10)
threshold value is constructed by
ISBN: 978-988-17012-2-0
IMECS 2009
Proceedings of the International MultiConference of Engineers and Computer Scientists 2009 Vol I IMECS 2009, March 18 - 20, 2009, Hong Kong where d i j is the j-th gene value of i-th drone that is restricted into [0,..,L] and the d i j d i j 1 for any j. Among all drones, the drone Dh with the maximum value of f ( Di ) for all i is assigned as the queen Q. The Queen Q is described X best as shown as the Eq. (11) 1 2 c Q [ X best , X best ,..., X best ]
(11)
Stage 2: Flight matting The stage2 do the flight matting of queen Q. The best drone Dk with the largest Prob(Q, Di ) Prob among the drone set D is selected the object of matting for the queen Q. After the f l i g h tma t t i n gt h equ e e n ’ ss pe e da n de n e r g yde c a yi sr e du c e d by Eq.(2). The flight matting is continues until the speed S (t ) is less than a threshold d or the number of sperms of the qu e e n ’ ss pe r ma t heca is less than the threshold n sperm . In
Brood ik Brood ik () Brood ik
[0,1], 0 1
(14)
The is randomly generated and is pre-defined. Step 3. The best brood, brood best with maximum objective function value is selected as the candidate queen. Step 4. If the objective function of brood best is superior to the queen, the queen replaces with brood best . Stage 5. Check the termination criteria If the termination criteria satisfied finish the algorithm, else generate new drones set and go to stage 2.
IV. EXPERIMENTAL RESULTS
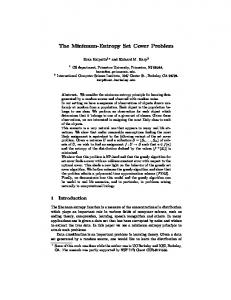
In this section, the proposed algorithm is employed to solve the multilevel image thresholding. The PSO based and the n sperm is less than m. The selected sperms, Sperm, are multilevel threshold selection based on the cross entropy criterion is implemented for later comparison. All programs described by Eq. (12). are designed by using the Matlab package under a personal Sperm [ Sp1 , Sp 2 ,...., Sp nsperm ] computer with 2.4GHz CPU, 1G RAM with Microsoft (12) 1 2 c windows XP system. Two popular images, that are Lena and Spi ( X i , X i ,...., X i ) Pepper with image size 256 256, respectively, are used for where Spi is the i-t hi n di v i du a li nt h equ e e n ’ ss pe r ma t h e c a . conducting by using the four methods in experiments. The two images are shown in Fig.1. Stage 3. Breeding process general, the values of d and n sperm are predefined by users
In this step, a population of broods is generated based on matting between the queen and the drones stored in the qu e e n ’ ss pe r ma t h e c a .At f i r s t t h ej-th individual is selected if the random number R j is less than a user-defined breeding ratio Pc to breed. The breeding process can transfer the genes of drones and the queen to the j-th individual based on the Eq. (13). Brood j Q ( Sp j Q ) (13) The Brood j is a brood that generated by the queen and the j-th individual of spermatheca of queen. The parameter is randomly generated in the interval [0, 1] Stage 4. Brood mutation with the royal jelly by works. The population of broods is improved by applying the mutation operators as follows: Step1. For all broods, the random number Ri of i-th brood is generated. Step 2. The i-th brood needs mutation if the Ri is more than the predefined mutation ratio Pm based on the Eq. (14). For the mutated brood Brood i , the only one gene X ik do the mutation. The k is randomly selected in integer interval ( 1, …, c).
ISBN: 978-988-17012-2-0
(a)Lena image (b) Pepper image Fig. 1. Two experimental images In the implementation of HBMO algorithm, it needs many parameters that are predefined and randomly generating. Table 1 shows the parameters of HBMO algorithm. In order to consistent comparisons, two performance indicators that are peak signal to noise ratio (PSNR) and uniformity measure, are used. For the sake of completeness we define PSNR, measured in decibel (dB) as 255 PSNR 20 log10 ( ) (15) RMSE where RMSE is the root mean-squared error, defined as
RMSE
1 MN
M N
( I (i, j ) I (i, j )) 2
i 1 j 1
(16)
Here I and I are original and thresholded images of size M N , respectively. For applying the multilevel thresholding on images LENA and PEPPER, we execute the PSO-based with three particles and the HBMO-based algorithms with one queen for 200 iterations. The exhausive search method is also conducted for derived the optimal solutions for comparison. Table 2
IMECS 2009
Proceedings of the International MultiConference of Engineers and Computer Scientists 2009 Vol I IMECS 2009, March 18 - 20, 2009, Hong Kong shows the selection of thresholds of MCET derived by PSO method, HBMO method and exhaustive search method. The derived MECT thresholds by the three methods are equivalent or very close (for the 2,3,4-threshold) to the optimal thresholds derived from the exhaustive method, however, in the 5-threshold the selected thresholds of PSO-based method are apparently different from ones generating from the two other methods. In the comparison with PSO-based methods, the solution of HBMO-based method are more powerful in searching the optimal solutions. Table 3 displays the consumed computational times and the corresponding PSNR values for images Lena and Pepper. From the table we found that the computation times of exhaustive search method is exponential, particularly, the needed CPU times for k 4 are absolutely unacceptable. The computational times of segmentation using the HBMO-based methods are nearly double compared to the PSO-based method. However, the needs of computation of this two methods are negligible because the needs is less than one second. In general, the segmented images are more informative as the number of the thresholds increases. The PSNR value of the image may reflects to the quality of image. The experimental results of Table 3 reveal that the resulting images of Lena and Pepper using the HBMO-based method are superior to the ones of PSO-based method. V.
t hr e s ho l di ng ” ,Expert systems with Application, 34, 2008, pp. 1341-1350 [6] F. Mohammad, A. Babak and M. Ali, Application of honey-bee mating optimization algorithm on clustering, Applied Mathematics and Computations, 2007, 1502-1513. [7] B. Amiri and M. Fathian, Integration of self organizing feature maps and honey bee mating optimization algorithm for market segmentation, Journal of Theoretical and Applied Information Technology, 2007, pp. 70-86. [8] D. Karaboga and B. Basturk, On the performance of artifical bee colony algorithm, Applied Soft Computing, 2008, pp. 687-697.M. Young, The Techincal Writers Handbook. Mill Valley, CA: University Science, 1989. [9] S. Kullback, Information Theory and Statistics, Dover, New York, 1968. [10] G. H. Li, c. K. Lee. Minimum cross entropy thresholding. Pattern Recognition, 26, 1993, pp. 617-625.
Table 1. The parameters used in the HBMO algorithm parameter
explanation Number of queens Number of drones Number of threshold The grayscale of image Speed reduction schema
Value 1 150 2,3,4, or 5 255 0.98
Capacity of spermatheca
50
S(0)
Speed of queen at first of flight
Randomly
Pc
The breeding ratio
0.8
Pm
Mutation ratio
0.001
Mutation variation
0.5
m c L
n sperm
DISCUSSION AND CONCLUSION
This paper presents a new multilevel image thresholding scheme based on the honey bee mating optimization (HBMO) algorithm. From the Table 2 and Table 3 we find the two important contributions. One is that the proposed HBMO-based method can more efficient to search the near optimal solutions compared to the exhaustive search method. The other is that the quality of segmentation images using HBMO-based method is superior to the ones of PSO-based method. The experimental result is promising and it encourages further research for applying the HBMO algorithm to complete image processing and pattern recognition.
Table 2. The minimum cross entropy thresholds for LENA and Pepper derived by the HBMO-based method, PSO-based methodand the exhaustive search method. Image k-thresholds
[2] [3] [4] [5]
J. N. Kapur, P.K. Sahoo, and A.K.C. Wong, A new method for gray-level picture thresholding using the entropy of the histogram, Computer Vision Graphics Image Processing, 29, 1985, pp. 273-285 N. Ostu, A threshold selection method from gray-level histograms, IEEE Transactions on Systems, Man, Cybernetics, SMC-9, 1979, pp. 62-66. P.S. Liao, T. S. Chen and P. C. Chung, A fast algorithm for multilevel thresholding, Journal of Information Science and Engineering, 17, 2001, pp. 713-727. P. Y. Yin, Multilevel minimum cross entropy threshold selection based on particle swarm optimization, Applied Mathematics and Computation, Vol. 184, 2007, pp. 503-513. M. Madhubanti and A. Amitava, A hybrid cooperative-comprehensive learning based algorithm for image segmentation using multilevel
ISBN: 978-988-17012-2-0
HBMO
PSO
Exhaustive
2 3 4 5
53,117 46,95,150 40,77,114,160 30,55,86,120, 162
53,117 46,95,150 47,73,111,159 39,73,102,130, 170
53,117 46,95,150 40,77,114,160 29,53,83,117, 161
Pepper
2 3 4 5
52,125 48,107,157 35,75,117,163 34,71,104,136, 171
52,125 48,107,157 37, 6,117,163 35,75,117,163, 239
52,125 48,107,157 35,75,117,163 34,71,104,137,1 72
Table 3. The execution time and peak signal and noise ratio.
REFERENCES [1]
Selected thresholds
Lena
ACKNOWLEDGMENT The authors would like to thank the National Science council, ROC, under Grant No. NSC 97-2221-E-251-001 for support of this work. .
[0.5,...,1]
Image k-thresholds
Execution time(sec)/PSNR(dB) HBMO
PSO
Exhaustive
Lena
2 3 4 5
0.82 0.83 0.84 0.87
16.05 18.32 20.35 21.77
0.44 0.45 0.46 0.45
16.05 18.32 20.14 21.57
1 91 6300 331302
16.05 18.32 20.35 21.60
Pepper
2 3 4 5
0.81 0.82 0.85 0.87
15.31 17.90 20.22 21.92
0.45 0.45 0.43 0.46
15.31 17.90 20.20 20.22
1 92 6345 336181
15.31 17.90 20.22 21.96
IMECS 2009