2009 Fifth International Conference on Natural Computation
Multiscale Cross Entropy: A Novel Algorithm for Analyzing Two Time SeriesΔ Rui Yan, Zhuo Yang, Tao Zhang Key Lab. of Bioactive Materials, Ministry of Education and the College of Life Sciences, Nankai University, Tianjin, PR China E-mail address:
[email protected] In the present study, a novel approach termed multiscale cross entropy (MSCE) was proposed and developed to assess the cross-correlation and the coupling behavior between two nonlinear dynamical systems on multiple scales, and apply it into the analysis in physical and physiological systems. MSCE curve may provide useful insights into the control mechanisms underlying physiologic dynamics over different scales
Abstract We proposed and developed a novel algorithm, named multiscale cross entropy (MSCE), to assess the dynamical characteristics of coupling behavior between two sequences on multiple scales, and apply it into the analysis of “coupling behavior” between two variables in physical and physiological systems, such as Henon-Henon map, Rössler-Lorenz differential equations and autonomic nervous system. The MSCE analysis, explicitly addressing multiscale features of coupling system, not only provides a nonlinear index of asynchrony at multiple temporal scales, but a measure of fractal dynamical characteristics relative to coupling behavior.
2. Methods Multiscale cross entropy algorithm Traditional methods, such as cross sample entropy (CSE) [1], provide an indication of degree of asynchrony or dissimilarity between the signals. However, these traditional measures do not account for features related to structure and organization on scales other than the shortest one [2]. We proposed and developed the MSCE based on the algorithms of the CSE and the multiscale entropy. Given two one-dimensional discrete time series with equal length: {x (i ) : i = 1, 2,..., N } and {u (i ) : i = 1, 2,..., N }
1. Introduction Quantifying the “coupling behavior” of physiologic signals in different condition has been the focus of considerable attention [1]. The methods measuring the ‘‘coupling behavior’’ have potentially important applications with respect to evaluating the correlation between two biological systems. Multiscale entropy method has been applied to detect changes in the complexity of cardiac dynamics [2], since a general approach was proposed to take into account the multiple time scales in physical systems. Therefore, it is meaningful and significant to develop and test the utility of complexity measures designed to quantify the degree of synchronization of two time series over multiple scales [2]. It was found that nonlinear methods, such as mutual information and cross entropy [1], played an important role in detecting the nonlinear correlation in physiological systems [3]. However, recent investigations have showed that it was hard to reveal the true dynamical coupling by those nonlinear methods, since the biological systems need to operate across multiple spatial and temporal scales to adapt and function in an ever-changing environment [2]. Δ
Firstly, normalize both discrete time series: xnorm (i ) =
Secondly,
construct consecutive coarse-grained time series, y (τ ) v (τ ) , determined by the time scale factor
{ }{ }
τ for each sequences. (1) To divide the original times series into nonoverlapping windows of length τ; (2) To average the data points inside each window. In general, each element of a coarse-grained time series is calculated according to the equation:
This work was supported by grants from NSFC (30870827)
978-0-7695-3736-8/09 $25.00 © 2009 IEEE DOI 10.1109/ICNC.2009.118
x(i ) − mean( x) u (i) − mean(u ) , u norm (i ) = std ( x) std (u )
411
y (τ ) ( j) =
jτ
1
∑x
(i), v(τ ) ( j) =
norm
τ i=( j −1)τ +1
where 1
≤ j ≤
N
τ
= n
1
jτ
∑u
(i)
Physiological data
norm
τ i=( j −1)τ +1
. For scale one, the time series
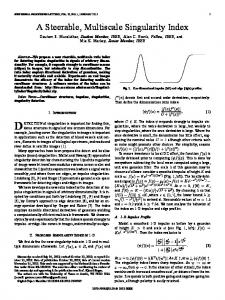
To further exemplify the potential utility of the MSCE method for analyzing real-world data, we study two time series, both of which can be considered as two outputs of a complex system: renal sympathetic nerve activity (RSNA) and blood pressure (BP) [4]. Fig. 2 showed the results of MSCE analysis of the multifibre RSNA and BP signals in both the conscious and anesthetized rats. One of them was that the CSE measure of RSNA and BP, derived from the conscious group, fluctuated considerably over small time scales and then stabilized to a relatively constant value in larger scales (from scale 11 in this case). On the other hand, the CSE measure, derived from animals with anesthesia, monotonically decreased after the scale over 7 despite it also fluctuated in smaller scales.
{y τ }{v τ } is simply the original time series. The length ( )
( )
of each coarse-grained time series is equal to the length of the original time series divided by the scale factor τ. Finally, we calculate a CSE measure for each coarse-grained time series plotted as a function of the scale factor τ, which assigns a non-negative value to each coarse-grained sequence. The above procedure is called multiscale cross entropy analysis. Mathematical details of the CSE can be referred [1]. During measurement the parameters are usually chosen as m=2, r=0.2[7]. The maximum analyzed time scales is 30.
3. Results
2.8
Conscious Anaesthetized
2.4
0.0 25
30
Scale Factor
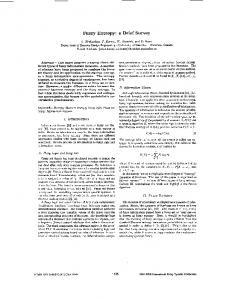
Figure 1. MSCE
analyses
of Henon − Henon && Rossler − Lorenz equations.
maps
10
15
20
25
30
In the study, an issue was addressed as to whether the LRTC relative to cross-correlation between two time series could be detected by the MSCE. For detecting the diversity of coupling behaviors, the MSCE analysis was proposed and developed to quantify the degree of asynchronization of two time series over multiple temporal scales. It is crucial to understand the intrinsic coupling behavior that not only the specific values of the CSE measure but also their dependence on time scale needs to be taken into account to better characterize the physiologic process [2]. The MSCE analysis, explicitly addressing multiscale features of coupling system, not only provides a nonlinear index of asynchrony at multiple temporal scales, but a measure of fractal dynamical characteristics relative to coupling behavior. In Fig.2, the MSCE analysis of the RSNA and BP in conscious rats showed scale-invariant behavior after scale 13, revealing that the coupling between the RSNA and BP
0.4
20
5
4. Discussions
0.8
15
0.8
Figure 2. Comparison MSCE coupling curves derived from the RSNA and BP between anesthetized and conscious rats.
1.2
10
1.2
Scale
1.6
5
1.6
0
2.0
0
2.0
0.4
Rossler-Lorenz Henon-Henon
2.4
Cross Sample Entropy (CSE)
Cross Sample Entropy
To illustrate this point, both Henon-Henon maps and Rössler-Lorenz differential equations were applied by the MSCE. Fig. 1 presented that a higher value of CSE was assigned to Henon-Henon maps in comparison with Rössler-Lorenz systems for scale one. However, the value of CSE for the coarse-grained Rössler-Lorenz systems monotonously increased for all scales, which was obviously opposite to the MSCE pattern of Henon-Henon maps. A monotonic decrease of the entropy values indicates that the original signal contains information only in the smallest scale [2]. Therefore, the monotonic decrease of CSE with scales reflects the fact that Henon-Henon maps may have information only on the shortest scale. In contrast, for Rössler-Lorenz systems the average value inside each window does not converge to a constant since new structures are revealed on larger scales and new information is disclosed at all scales.
and
412
in conscious state had a complex structure. Furthermore, MSCE measure exhibited the presence of long range correlations implies that current changes in renal nerve activity not only depend on its previous changes but also on previous changes in arterial pressure. Our previous study indicated that LRTC, represented the time-scale-invariant behavior, was able to prevent excessive mode locking, which would restrict the functional responsiveness of the organism to unexpected challenges [4]. It is clear that the anaesthetized rats obviously have a weakened ability to adapt the changes of environment or external perturbations compared to that of conscious animals, which is consistent with our results that the conscious rats exhibit a stronger LTRC than that of the anaesthetized ones [4]. In summary, this study shows that the analysis of MSCE can be applied to measure cross-correlation and coupling behavior between two time series in either physical systems or physiological systems. Our results demonstrate that MSCE can provide a simple quantitative parameter to represent features of coupling pattern and fractal dynamical characteristics. The MSCE measure revealed the coupling behavior on multiple temporal scales and showed the LTRC associated with complex physiological systems. In conclusion, we propose a novel method to quantify the cross correlation and coupling pattern between the simultaneously recorded time series. It is possible that the MSCE method can be employed in areas where there are multiple correlated time series, such as in physiology where time series analysis is used as a clinical method to discriminate healthy from pathological behavior.
5. References [1] J.S. Richman, J.R. Moorman, Physiological time-series analysis using approximate entropy and sample entropy. Am J Physiol Heart Circ Physiol, 2000, 278(6), H2039-2049. [2] M. Costa, A.L. Goldberger, C.K.Peng, Multiscale entropy analysis of biological signals. Physical Review E, 2005, 71(2), 021906. [3] T. Zhang, Z. Yang, J.H. Coote, Cross-sample entropy statistic as a measure of complexity and regularity of renal sympathetic nerve activity in the rat. Exp Physiol, 2007, 92(4), 659-669 [4] Y.T. Li, J.H. Qiu, Z. Yang, E.J.Johns, T. Zhang, Longrange correlation of renal sympathetic nerve activity in both conscious and anesthetized rats. Journal of Neuroscience Methods, 2008, 172(1), 131-136
413