Advances in Science and Technology Research Journal Volume 10, No. 31, Sept. 2016, pages 263–273
Research Article
DOI: 10.12913/22998624/64059
NAVIGATION IN LARGE-FORMAT BUILDINGS BASED ON RFID SENSORS AND QR AND AR MARKERS Tomasz Szymczyk1, Jerzy Montusiewicz1, Dariusz Gutek1 1
Institute of Computer Science, Electrical Engineering and Computer Science Faculty, Lublin University of Technology, 38 Nadbystrzycka St., 20-618 Lublin, Poland, e-mail:
[email protected], j.montusiewicz@ pollub.pl,
[email protected]
Received: 2016.04.27 Accepted: 2016.07.05 Published: 2016.09.01
ABSTRACT The authors address the problem of passive navigation in large buildings. Based on the example of several interconnected buildings housing departments of the Lublin University of Technology, as well as the conceptual navigation system, the paper presents one of the possible ways of leading the user from the entrance of the building to a particular room. An analysis of different types of users is made and different (best for them) ways of navigating the intricate corridors are proposed. Three ways of user localisation are suggested: RFID, AR and QR markers. A graph of connections between specific rooms was made and weights proposed, representing “the difficulty of covering a given distance”. In the process of navigation Dijkstra’s algorithm was used. The road is indicated as multimedia information: a voice-over or animated arrow showing the direction displayed on the smart phone screen with proprietary software installed. It is also possible to inform the user of the position of the location in which he currently is, based on the static information stored in the QR code. Keywords: navigation, augmented reality, passive location, mobile devices.
INTRODUCTION Many large public buildings in Poland are relatively old. In the name of protection of monuments there is no habit of demolishing the old structure and erecting a new one in its place, , as it is in other countries, e.g. in the USA. A dynamically developing state, however, demands a continuous adaptation of existing buildings to new functions. Very often historic structures are extended by new wings. On the one hand, this is an example of ongoing concern for national history, and at the same time, a show of the craftsmanship of architects modernising “architectural gems.” On the other hand, expanding buildings vertically and horizontally causes enormous complexity of their communication system. There is a need to improve the orientation and navigation in such buildings. People have already become accustomed to using car navigation, allowing the demarcation of an optimal route. Thus it seems to
be natural to create a similar system that allows navigation inside a vast building. Open space is very well suited to localisation based on the GPS (Global Positioning System). Unfortunately, the GPS signal fades inside buildings. Navigating with its use becomes impossible. There are technologies dedicated to navigating inside shopping centers, such as Beacon. However, these are relatively expensive solutions. Orientation and, consequently, localisation can be simplified by an adequate description of the premises. Often you can meet the convention that the first digit of the room number is at the same time the number of the storey on which it is located. This is the most common procedure to allow easier localisation. However, this does not solve the problem in large buildings. The specific “roadsigns” showing the rooms located in a given direction do not entirely solve the problem either. The authors propose that the traditional numerical description on room entrances was replaced (enriched)
263
Advances in Science and Technology Research Journal Vol. 10 (31), 2016
by the introduction of unique AR (augmented reality) and QR (Quick Response) tags, as well as the placement of passive elements, such as RFID cards. By using mobile devices, proprietary software and enhanced reality we get a powerful tool for displaying personalised multimedia information on each AR tag. In the absence of applications, QR codes will present the user with much more information than just a room number. There is also a possibility of localising an applicant by using RFID readers.
PUBLIC UTILITY BUILDINGS Description and identification of threats An important issue in the modern world, including Poland, is the growing threat of terrorism, understood as individual attacks on public buildings. Terrorist attacks on various types of objects are increasing in Europe and have moved to the US – WTC, September 11, 2001 and Africa – Museum of Bardo, March 18, 2015. On March 11, 2004, attack on a train in Madrid was organised. On November 13, 2015, among other places, the restaurant Petit Cambodge, or the Bataclan Theatre in Paris, and on March 23, 2016 on the departures hall of Zaventem airport and the Maelbeek metro station in Brussels. Examples of public buildings acc. [6] are: hospitals, schools, ambulance stations, professional fire brigades, banks, police stations, military facilities, government offices, data centers (ECA), communication facilities, cinemas, theaters. Commonly used is also the term “public utility buildings”, according to [1, 11] these are buildings with office functions and retail services, including: offices, shops, government offices, schools and universities, hospitals, railway stations and airports, hotels, restaurants, sport and recreational facilities (e.g. swimming pools, bowling alleys), libraries. In many cases, a building’s structure can be very complex, such as: direct exits to the underground or overhead platforms, parking lots, walkways equipped with escalators, elevators, additional emergency stairways external “connectors” between newly-added pavilions. These objects are often rebuilt, modernised, supplemented with necessary facilities for the disabled, ventilation, smoke ventilation, air conditioning
264
facilities. Their diverse internal structure makes it very difficult to define a unified logistics concept, which would provide adequate protection of such buildings, and in the case of fire or terrorist attack smooth evacuation of employees and customers and rescue operation. In the literature a lot of attention is paid to the safety of buildings in the context of protection against burglary and theft, against terrorism and fire. These issues are described in a form of a short code of conduct [8, 9] or specific guidelines for different types of objects [7]. When analysing, during normal operation of the facility, the movement of people inside public buildings we often encounter the phenomenon of lost people wandering in the vast spaces of the objects. These people are not familiar with the structure of the building and cannot find a specific room or ways out of the building. It is not enough to know only the number to reach a particular room. It often happens that not every staircase leads to the correct section of the next floor, sometimes there is no relevant passage. It turns out that the intuitive navigation which is based on a combination of room number with the number denoting the floor is not enough. In case of hospitals, very often we have to deal with the elderly and sick people, for whom unnecessary walks across the floors is particularly burdensome. The situation becomes particularly serious when a direct threat for the people arises. In the buildings in which a lot of people stay at the same time, a phenomenon significantly enhancing the danger to human life and health is the formation of panic. The circumstances of emergence of non-standard situations, fire, evacuation usually causes nervousness and irrational behavior. Therefore, the behavior of people alone may pose a serious threat. The issue of passive navigation Issues relating to the use of Building Information Modelling in the case of the inside of a building being damaged by an earthquake, as well as conducting SAR action, can be found in [2]. A preliminary study on the availability and functionality of public buildings for people with various impairments and disabilities can be found in [19] and especially for visually impaired to be found in [17]. The terms and conditions of evacuation of people from public utilities can be found on the website of the State Fire Service [18]. In
Advances in Science and Technology Research Journal Vol. 10 (31), 2016
[20], the authors deliberate on the possibility of using a micro-information system (GIS) for presentation and analysis of spatial data of the building to determine evacuation routes for the rescuers. For this purpose, an algorithm (called Ant Colony Optimisation) is applied, allowing to determine safe and shortest route. Of course, in order to carry out such optimisation, a digital record of the entire structure of the building must be available. In [12] the problem of using the ITS emergency response systems based on GIS in realtime, whose aim is to facilitate rapid response to the terrorist attacks on multi-level buildings was raised. The work relates, inter alia, the implementation of GIERS (GIS-based Intelligent Emergency Response Systems) using wireless and mobile installations. The conducted considerations indicate that the development of such systems as GIERS requires the availability of a lot of information from different sources, which can be disrupted by emerging problems of interoperability and data sharing, as well as concerns about the security of data collected by the system (e.g. the presence of sensors). In [4], the authors present their innovative approach to the assessment of the structure and consequent conclusions by the use of created application called – SUPER-MAN (Supporting Urban Preparedness and Emergency Response using Mobile Ad hoc Network). Their solution uses labels for radio frequency identification (RFID), Dynamic Source Routing DSR based on developed mobile networks (MANET). The aim of the study was to solve the problems encountered by structure engineers and rescuers in their work. As a result, rescue measures are appropriately prioritised to minimise the threats to first contact rescuers and to satisfy their needs. In the article [6] an attempt was made to solve the problem concerning crisis management with a view to the effectiveness of communication between rescuers and the head office to avoid casualties. The system concept called Multi-Agent Systems (MAS) containing a pattern of organisation of interaction between various members of the crisis team was developed taking into account the experience of many case studies. The proposed solution does not introduce new technical measures in the process of the rescue service. It deals with the improvement of the management system through improved logistics of the involved services operations.
In [12] the authors consider a development of a system supporting rescuers located in the variable, often undefined spatial conditions of public utility buildings in the crisis situation, e.g. a terrorist attack. A system of navigation support called “Context Sensitive Emergency-Navigation-System” was developed based on the internal wireless local area network (WLAN) and radio frequency identification – Radio Frequency Identification. This system is intended to help locate people staying in the facility. The problem of rescue services is a very broad issue. It is not limited only to rescue actions in the buildings, but also to the aid in the vast open spaces, e.g. seas and mountains [10].
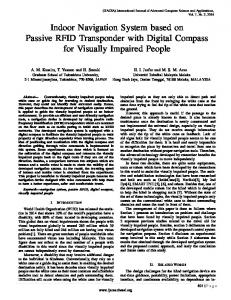
THE CONCEPT OF THE SYSTEM The idea of the system is based on the reading of the information contained in the cards placed in the hall and rooms of the building. Cards as passive components are placed at defined locations. The authors proposed two types of cards. The first type are – “location markers”. They may have a form similar to a rectangular card or can be miniaturised and become completely invisible to users of the building. They can be e.g., “built-in” the ceiling and floor to protect them from being accidentally stepped on or against other mechanical damage. Their only function is to provide RFID information. The second type are “utility markers” including information in RFID, and, due to the fact that they are located at the eye level of the user, they include a printed QR and AR code, as shown in Figure 1. There is a close correlation between the placement of cards in the building and the data (identifiers) stored in the RFID tags and card identifiers stored in a central computer system. The construction of a key containing the necessary information is described as a 13-bit sequence number. The first 4 bits are a unique card number. The next three bits define the Floor (Floor on which the card is located). The next five bits are the unique number of a card located on that floor. The last bit identifies the height (on a particular floor) at which the card was located. The authors proposed three heights: one just above the surface of the floor or in the floor, another at the height of an average man’s face, and the third just under the ceiling or on the ceiling.
265
Advances in Science and Technology Research Journal Vol. 10 (31), 2016
Fig. 1. View of the proposed allocation of cards in the corridors and rooms in the proposed system (own study)
This is the optimal number of cards allowing not only their exact location in the building, but also in the event of a failure of one of the cards, the nearest cards become the “waypoints”. The position of a card (RFID tag) has its representation in the central computer system that supports the process of navigation. It is stored in the attribute awaryjny_identyfikator (emergency_id) of the karta_identyfikacyjna (id_card) class. The same information is also stored in a binary form as RFID tag. In the case of normal operation of the system the code is to confirm the information written explicitly in the card. In case of hazard operation mode, both forms of information are provided in parallel, and one confirms the accuracy of the other. There is a justified concern
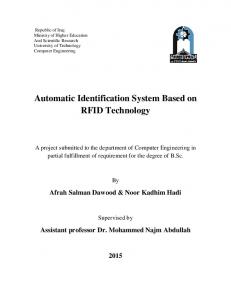
that they may be seriously damaged resulting in the loss of a part of information. Doubling the information helps to ensure the accurate reading of the location of the tested card. Each card in the “utility markers” may contain QR or AR tag. QR (Quick Response) tag contains basic information about the room in which a patient or a client stays. These are written text data completely independent of the operation of the central system or a distributed IT system. They may contain instructions of movement, evacuation or any other resulting from the use of the building in which they are located. Such information does not need applications in the present system to be read out. It only needs applications for reading QR codes. However,
Fig. 2. An example of static information stored in QR code (own study)
266
Advances in Science and Technology Research Journal Vol. 10 (31), 2016
there is a possibility that the data contained in the code were “control instructions” in central or distributed IT system. They would then trigger any media stream and duplicate AR markers action – Figure 2. AR markers (Augmented Reality) are used to display multimedia information using a user’s mobile device. They can display plain text (like QR markers), play any audio file, display 3D object or any film, e.g. instructional, as shown in Figure 2.
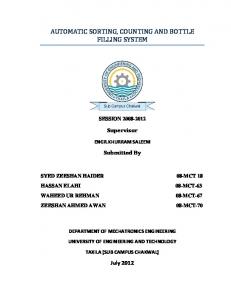
METHODS OF LOCATION – TRIANGULATION OF SIGNALS A key activity for obtaining a relevant position of an object moving in relation to the installed numerous RFID markers is correct execution of triangulation process. This process involves creating a grid of triangles from the adjacent passive markers that are activated by a nearby transmitter. The information received from them determine the detailed location of the transmitter and other data stored in them. It is also important to ensure that the determination of the location was possible despite the destruction of many markers in fire or explosion. Algorithms used were based on the Delaunay method [13]. In the conceptual system one can also use other properties. Knowing solid, precise arrangement of cards, as well as their identifier read from the RFID or a card identifier from the central information system, as well as knowing the radius of the reader’s reading, its position can be determined.
Figure 3 presents the view of readings of cards placed on the walls by emergency services. If the RFID reader power is lower (R1 radius) a reading is possible (of at least three cards – two horizontal, and at least one vertical). With the knowledge of position of the cards, and more precisely through the knowledge of (the distance between tabs), the approximate value of R1 and readings from identifier code (RFID tag) it is possible to position the reading person in 3D quite precisely. By increasing RFID reader signal strength (radius R2), the reading of a greater number of cards is possible.
PASSIVE COMPONENTS RFID (Radio-frequency identification) is a technology that allows automatic identification of an object using radio waves. The system includes RFID marker (also called a transponder, RFID label, RFID chip, RFID tag, and in the article it is also called RFID card) and RFID reader antenna. A typical RFID marker is a microchip (integrated circuit) connected to an antenna, mounted on a carrier (Figure 4). The cards may be paper or plastic. RFID markers (tags), can be divided depending on whether they have their own power source, the following types can be distinguished: •• active, •• semi-passive, •• passive. Active and semi-passive markers (cards) use an external source (e.g. battery) to power the chip. Active markers use the battery to send radio
Fig. 3. Example of reading information from a number of cards with different radii (varying power) of RFID reader. View from the top of hotel corridor (own study)
267
Advances in Science and Technology Research Journal Vol. 10 (31), 2016
Fig. 4. Cross section of RFID card [3]
waves to a reader while semi-passive cards send a signal using power supplied from the reader. This card, uses the additional power source for additional functionalities, e.g. in temperature measuring tags, the battery is used for the function of measuring temperature and recording data on the measuring samples taken. Active markers are typically used for labeling items which require a certain distance for reading. You can now read them from more than 30 meters. It is also possible to use additional battery that allows you to read them from more than 100 meters. The situation is different in the case of passive cards. They are powered by the energy collected from the reader. The card replies with a signal only at the call sent from the reader. A few years ago, reading ranges of passive markers were much shorter than active markers reading ranges – about 6 meters, at the moment the newest Passive markers’ reading range is more than 30 meters. In addition, the choice of passive cards in the conceptual system was determined by their price. Production cost of passive markers is much lower than in the case of the active ones. RFID cards can be classified also in terms of the frequency in which they operate. LF low frequency systems generally operate at frequencies of 124 kHz, 125 kHz or 135 kHz. Systems of high-frequency use frequencies of 13.56 MHz and UHF systems in Europe use a band between 865 and 868 MHz [3]. Radio waves behave differently in those frequencies, which means that different frequencies are suitable for a variety of applications. LF waves can penetrate walls, but do not penetrate through metal. LF RFID Markers are ideal for applications where the tags must be read through the materials or water in a close range of a few centimeters [3]. In microchip of the RFID cards, which are equipped with hundreds of bits of memory, data can be stored. Usually only a number that applies to a specific user database is saved. To read the
268
data from the RFID marker, RFID reader and an antenna are needed. The data contained in the tag can be read at any time. When the antenna receives a signal (electromagnetic energy) from the reader antenna, using this energy to power the card, it sends a feedback signal in the form of radio waves to the reader antenna containing information about the contents of microchip memory.
METHOD OF CALCULATING THE SHORTEST PATH IN A BUILDING The detailed implementation of the database supporting the featured system is described in [16]. The main objective of the project is to enable navigation in the building from the entrance to a specific room. Such navigating by assumption takes place via the shortest possible path. Due to the fact that the presented conceptual system is to function in a large, complex building, there may be several entrances. Additionally, we defined several types of user: •• plain user, •• disabled user, •• special group type of user (guests, organised groups visiting the dormitory, e.g. students, children, etc.), •• technical user, •• research and teaching staff user. The plain user is the most popular type of user. He is led exactly along the shortest route to his destination. The disabled user is a type of user transported by elevators and escalators and uses special places “friendly to people with disabilities.” This user is not taken to the stairs or the goods elevator. Special groups are carried to a destination in such a way that the nominated path avoids dangerous places. Such a group should be taken particular care of not to disperse, and its participants may not get lost. Due to the nature of this type of user various facilities are selected, such as escalators. If lifts are available, the route is in the first place marked out to multipassenger lifts. Technical user, whose task is e.g. provision of specialised equipment (often heavy, fragile or bulky), has first of all, the chance of a convenient entrance. Often such entrances to the building communicate with the loading ramp or other amenity. The user begins navigation with a previously proposed specific entrance. The
Advances in Science and Technology Research Journal Vol. 10 (31), 2016
graph representing the map is constructed in such a way that the use of a specific technical lift is preferred, even at the cost of extending the route to the destination. This ensures both the safety of the transported equipment as well as reducing the chances of damage to components of the building itself. The staff member type of user has access to selected locked parts of the building. The authors propose that the calculation of the optimal path be based on Dijkstra’s algorithm, Figure 5. [5]. A weighted graph is created. The weights may be the distance between the rooms (AR tags or QR codes). Dijkstra’s algorithm for a given defined graph with distinguished vertices (rooms, elevators, entrances) finds distances from the source (entrance) to all the other vertices (specific areas, escalators, elevators, toilets, etc.). This is followed by addition of weights and calculation of the objective function. If we denote the source vertex by s, w(i, j) is the weight of edge (i, j) in the graph, then the table d[s] will keep distances from the source (s) for all vertices of the graph. The next step is selecting the minimum objective function, which is the shortest way. The graph of the room connections in the building is defined for each group of users, separately and additionally takes into account the “roads temporarily closed”. To mark them, suitable points of the graph are given high values. If the proposed concept of navigation based on weight graphs is extended by weight for a par-
ticular type of user, navigation along such a graph will require a multi-criteria analysis [14]. To simplify the issue, the authors propose the creation of a separate graph for each type of user. Weights in these graphs are changed in such a way that the user is directed to the destination along the path optimal for him. Thus it is possible to avoid ‘secret or dangerous’ places, e.g. for visiting groups of children. Having a given graph with a highlighted vertex (source), the algorithm finds the distances from the source to all the other vertices. It is easy to modify it in such a way that it only seeks the (shortest) path to one fixed vertex, simply stopping operation when reaching the target apex, or transposing the graph incidence table. Dijkstra’s algorithm finds all the shortest paths in a graph between the selected vertex and all the others, at the same time calculating the cost of the transition of each of these tracks. Marking out a sample passage from entrance 1 to room 25 (second floor) for academic and teaching staff is presented in Figure 6. The cost of following the route was 38 (1+15+2+10+10). Reaching the same room by a technical user is 33 (8+0+5+10+10), on the assumption that taking a lift is not charged with any cost. In the first case, the user must use the stairs, hence the road has a higher value. This system is designed to operate in three different modes [14]. This article presents an approach in which the user downloads the app, e.g. from an online store or a dedicated server.
Fig. 5. An example of a graph representing two floors
Fig. 6. Marking out a route on a particular graph
269
Advances in Science and Technology Research Journal Vol. 10 (31), 2016
and AR markers. The system allows simultaneous reading of all RFID tags within a regulated range of the reader. Based on the principle of triangulation of waves the position of the rescue team is determined. By appropriate information coding, in case of reading data from multiple RFID markers it is possible to determine the exact location of a team.
DETERMINING THE OPTIMUM ROUTE OF PASSAGE Fig. 7. The concept of work in the second mode allows reading AR markers and display relevant multimedia content and text of QR markers. This mode works without the need of wireless connection to the Internet
Then in his/her smartphone defines one of the available user types: plain user, disabled user, special group, technical user, research and teaching staff user (the latter two groups are subject to authentication). In the next step, the user chooses the destination to be reached. Then scans the next visible AR/QR utility marker, which is treated by the system as the location of the starting point. Based on the described algorithm the system determines the best route to a destination entered for the type of user. The user scans the following additional marker AR/ QR utility marker and the smartphone displays information on the successive elements of that route. The principle of operation of the system in this mode is illustrated in Figure 7. Anonymous user is treated by the system as a user with the lowest priority. Along with the program all multimedia content is downloaded. The main advantage of such a program is no need to maintain a WIFI connection to a central server. Downloaded application is much greater than that of the first mode. Both of these modes use QR and AR codes. They do not use the RFID reading. The third mode is reserved for exceptional situations. The main recipient is the rescue team or a special robot or a rescue drone. In this mode, the vision system is not important and the markers can be located without possibility of recognition or optical reading. This mode is based mainly on reading the information stored on RFID cards. This does not preclude the possibility of simultaneous readout of both QR codes
270
As an example of a large multi-level, highly differentiated architectural object the authors analyse the complex of departmental buildings of the Lublin University of Technology. Their overall distribution is shown in Figure 8. The site was built up over more than 40 years. Successive additions included new buildings, link segments, assembly halls, library room, extra storeys, basements renovated to serve as cloak and storage rooms. Differing land levels make the storeys in the individual segments of the assembly displaced with regard to one another. This means that the ground level in segment B1, after passing to segment B2, becomes the first floor. Some of the corridors are not connected to each segment, so to get to the correct class staircase one should go down another staircase to the lower floor, then get to the next staircase and use it to climb to the top. Currently, the complex of buildings has as many as 8 staircases, and 15 entrances with very different purposes (some withheld from use, others performing functions only as an emergency exit), 2 lifts and a staircase with a special platform system for transporting people with disabilities. Some entrances are only available to selected groups of users and at specified time intervals. The authors have a computer model of the buildings made in AutoCAD at their disposal. As a result, it was possible to accurately position the markers. Based on the technical plans, as well as knowing the purpose of each part of the building and its rooms, it is possible to create a precise weights graph used for navigation with Djikstra’s algorithm. For the purposes of simulating navigation in a complex of buildings the authors developed their own method of measuring the weights of each edge of the graph from Dijkstra’s algorithm. Details are presented in Table 1.
Advances in Science and Technology Research Journal Vol. 10 (31), 2016
Fig. 8. Computer model of a large building with a very complex structure [15] Table 1. Cost of valuation for different elements of the route No.
Edge category (i, j)
Edge weight description w(i, j)
Weight value w(i, j) 1 point per. 1 m
1.
Level passages
Value directly proportional to the distance between the markers in meters
2.
Stairs short (for local compensation of levels)
Value calculated for each step
3.
Long stairs (staircases)
Value of passage between floors (about 50 steps)
4.
Lift platform (LP) for people with disValue of passage to the floor. abilities (mounted next to the stairs)
5.
Lifts
Value of passage to the floor.
6.
Passage out of the building
Value directly proportional to the distance between the markers in meters
To perform detailed calculations, two routes were prepared to be covered by selected representatives of different types of users. We analysed the typical passageways, repeatedly used by students: 1) Moving from room 101F (annex to building B1) to the library: •• plain user (PU), •• disabled user (DU). 2) Access to the Dean FFT from outside the building: •• plain user (PU), •• disabled user (DU). Using Dijkstra’s algorithm, passage routes were set for the ordinary user, and alternative routes for the disabled user. The results are shown in Table 2.
DU 20 points PU 3 points DU 300 points PU 50 points
Notes
Depending on the user type Depending on the user type
Service needs qualified staff The occurrence of ac10 points cess queuing Weather-related incon2 points per 1 m veniences 50 points
CONCLUSIONS The results clearly show that the proposed system of determining the cost of the route is particularly important for people with disabilities. The values obtained are dependent on the proposed route and the valuation of the individual components (variants: 1.2a – 654; 1.2b – 309; 1.2c – 361). The problem arises how to measure the full independence of such a person. Are the route options, in which the need for assistance from others arises, is a significantly worse variant? The answer to a problem so formulated requires carrying out additional surveys among the stakeholders. The results would allow a proper valuation adjustment of the weight the edges of Dijkstra’s graph.
271
Advances in Science and Technology Research Journal Vol. 10 (31), 2016 Table 2. Determination of the passage value for different types of user №. 1. 1.1.
1.2a
1.2b 1.2c 2.
Route/description
User type
No. 1. Passage from room 101 to the library Crossing the hall, staircase 2, down the hall to the library (29 m, full floor, 32 m) Exit down the LP exit 1b, transition out of the building to entrance 3, the driveway to the entrance, passing along the corridor, lift, reaching to the stairs, the stairs, down the hall to the library (LP; 227 m, 27 m, 11 m, lift 1 floor, 20 m, 3 stairs, 7 m) Exit down the LP, exit 1b, transition out of the building to entrance 2, reaching the staircase 2, stairs, down the hall to the library (LP; 67 m, 3 m, 5 stairs, 32 m) Variant 1.1., as for PU, LP failure (29 m, full floor, 32 m)
PU
111 (29+50+32) 654
Variant 1: DU
(30+2*227+2*27+ 11+10+20+3*20+7)
Variant 2: DU Variant 3: DU
309 (50+2*67+3+5*20+32) 361 (29+300+32)
No. 2. Passage to the Dean’s Office of the Faculty of Fundamentals of Technology from outside the building
2.1.
Entrance 2, reaching the stairs, crossing the corridor (3 m, stairs; 20 m)
2.2a
Variant 2.1., as for PU
Variant 1: DU
2.2b
Entrance 3, the driveway to the entrance, crossing the corridor, lift, reaching the stairs, the stairs, down the hall to the library (21 m, 11 m, 1 lift floor; 20 m, 3 stairs, 7 m)
Variant 2: DU
The use of Dijkstra’s algorithm allows the valuation of the cost of alternative variants of the way people belonging to different types of users move from place to place. As a result, it is possible to take into account in the planning process of teaching, the presence of people with disabilities in the dean’s or the laboratory group. For these groups such classrooms would be selected, for which the total travel costs would be minimal. The proposed system is a universal solution and allows the determination of the optimal ways to move around a vast building by users belonging to different types, at different times and in different circumstances. Valuation adjustment of individual elements of the route can be carried out by the operator of the system according to the changing circumstances, e.g. equipment failure or emerging risk. Exploitation of the medium of augmented reality gives full interactivity and versatility to the entire application. By using static markers, once generated and placed in a specific (defined) place, we get the ability to display virtually any content on them: from arrows showing the direction and distance to chosen destinations, to information about local risks.
REFERENCES 1. Annex D – List of Types of Public Buildings http://dwqr.scot/media/11353/information-letter-1_2007-annex-d.pdf.
272
Summary cost of passage
PU
32 (3+5*3+20) 122 (3+5*20+20) 150 (2*21+11+10+20+3*20+7)
2. Bloch T., Sacks R., Rabinovitch O, Interior models of earthquake damaged buildings for search and rescue, Advanced Engineering Informatics, 30 (1), 2016, 65-76. 3. Brendan Leahy B., Komsky S., Kim J. H., Kamon T., Breeden M., RFID Powered Electronic Shopping Cart, 2008. 4. Chen A.Y., Peña-Mora F., Plans A.P., Mehta S.J., Aziz Z., Supporting Urban Search and Rescue with Digital Assessments of Structures and Requests of Response Resources, Advanced Engineering Informatics 26, 2012. 5. Dijkstra E.W.: A note on two problems in connexion with graphs. In: Numerische Mathematik, 1, 1959, 269-271. 6. FASB, A closer look at the new definition of a public business entity, Technical Line, 2014. 7. Fire Safety Requirements for Places of Public Entertainment Licence (Cinemas & Theatres), http://www.hkfsd.gov.hk/eng/source/licensing/ PPA_109%282%29_EN.pdf 8. García-Magariño I., Gutiérrez C., Agent-Oriented Modeling and Development of a System for Crisis Management, Expert Systems with Applications 40, 2013. 9. Harrami O., McIntyre C., Fire and Fire Protection in Homes and Public Buildings. An Analysis of Swedish Fire Statistics and Fire Protection Strategies. National Centre for Learning from Accidents Swedish Rescue Services Agency, Report Nr 1/06, Stockholm, Swedish Chemicals Inspectorate, 2006 (https://www.kemi.se/Documents/Publikationer/ Trycksaker/Rapporter/Rapport1_06.pdf ).
Advances in Science and Technology Research Journal Vol. 10 (31), 2016 10. Kozieł G., Algorytmy wyznaczania optymalnej trasy przejazdu, W: Logistyka, 3, 2014, 3206-3212. 11. Kuehnel H., Włodarczyk A. M., Urban and rural codes of public spaces, Traditional and new public spaces in rural areas, PWSZ, Nysa 2014. 12. Kwan M.-P., Lee J., Emergency Response after 9/11: the Potential of Real-time 3D GIS for Quick Emergency Response in Micro-spatial Environments, Computers, Environment and Urban Systems 29, 2005. 13. Miller G.L., Talmor D., Teng S.-H., Walkington N.: A Delaunay based numerical method for three dimensions: Generation, formulation, and partition. Proceedings of the Twenty-Seventh Annual ACM Symposium on the Theory of Computing, Las Vegas, 1995, 683–692. 14. Montusiewicz J., Ranking Pareto optimal solutions in genetic algorithm by using the undifferentiation interval method. [In:] Burczyński T. (ed.) Evolutionary Methods in Mechanics. Monograph. Klu¬wer Academic Publishers 2004. 15. Montusiewicz J. Wirtualny model campusu Politechniki Lubelskiej, Biuletyn Informacyjny PL, 1 (26), 2011, 34-35.
16. Montusiewicz J., Szymczyk T., Koncepcja lokalizacji pasywnej w budynkach użyteczności publicznej, Logistyka, 4, 2015, 8018-8027. 17. Pitera A., Bober D. , Kęsik J., Image edges locator dedicated to visually impaired people - an experimental application for mobile devices , in: IDAACS 2015, 8th IEEE International Conference on Intelligent Data Acquisition and Advanced Computing Systems: Technology and Applications; Warsaw, 2015, 660-665. 18. Rüppel, U., Stübbe, K., Context Sensitive Emergency-Navigation-System for Buildings, Proceedings of the 11th International Conference on Civil, Structural and Environmental Engineering Computing, Civil-Comp, 2007. 19. Thapar N., Warner G., Drainoni M.-L., Williams S.R., Ditchfield H., Wierbicky J., Nesathurai S., A pilot study of functional access to public buildings and facilities for persons with impairments, Disability and Rehabilitation, 26 (5), 2004, 280-289. 20. Wu C.-H., Chen L.-C., 3D Spatial Information for Fire-fighting Search and Rescue Route Analysis within Buildings, Fire Safety Journal 48, 2012.
273