2 Departement des sciences de l'informatique, Faculte des sciences de Monastir, Universite du Centre, Tunisia. 3 Cadence Design Systems Inc., 35 Spring St., ...
Net Criticality Revisited: An Effective Method * to Improve Timing in Physical Design H. Chang1, E. Shragowitz1, J. Liu1, H. Youssef2, B. Lu3, S. Sutanthavibul4 1 Dept. of Computer Science and Engineering, University of Minnesota, Minneapolis, MN 55455, USA 2 Departement des sciences de l'informatique, Faculte des sciences de Monastir, Universite du Centre, Tunisia 3 Cadence Design Systems Inc., 35 Spring St., New Providence, NJ 07974, USA 4 Intel Corp., Mailstop RA2-401, 2501 N.W. 229th Ave., Hillsboro, Oregon 97124, USA
ABSTRACT
(2) Evolving problem formulations with the new generations of technologies. (3) Higher requirements on quality of solutions. Reference [14] gave a good review on how the placement problem was formulated and solved in previous works.
Criticality metrics is a type of predictive models used in VLSI design. This work demonstrates that timing in physical design could be substantially improved if circuits were subjected to timing criticality analysis prior to layout and new criticality metrics were used to drive layout system. These new metrics are computed as ratios of net physical characteristics to the net delay bounds determined by an optimal bounds computation algorithm. Attempts to develop criticality metrics prior to layout were made before, but these metrics were not based on the bound ideology. The paper provides probabilistic interpretation of new criticality metrics and derivation of some important properties of these metrics. Evaluation of net criticality by new metrics can be easily merged with any layout system that allows weights to be assigned to nets on placement and/or routing steps. The methodology has been tested with a commercial layout system from a leading CAD provider. When the new criticality information was supplied to a basic commercial standard cell placer and router, timing was improved by 29.5% for the set of testcases. The achieved result is 12% better than timing generated by a targeted timing-driven layout system from the same provider. All additional computations related to the new criticality metrics require only negligible increase in run time of the basic layout system.
Previous work on timing aspects of the placement problem can be classified into the following categories. (1) Timing constraints are formulated at all internal nodes, while requirements on arrival time are explicitly formulated only at memory locations and Primary Outputs (PO). An objective function includes interconnection length and timing constraints with the Lagrange multipliers. The problem was solved by different modifications of the Lagrange relaxation technique [1][2][3]. (2) Timing constraints are explicitly formulated for the set of the most critical paths. This set of paths may evolve from one iteration of placement to another. The problem was solved by the SA technique as in [4] or by one of modifications of mathematical programming with nets on the critical paths being assigned higher weights in the objective function [5][6][7][8]. (3) Timing constraints on paths are converted to timing constraints on nets by slack allocation algorithms. These bounds are either used explicitly to control a distance or delay between modules or they are included in the objective function with weight coefficients [9][10][11][12][13][15] [16][17][18].
Categories and Subject Descriptors B.7.1 [Integrated Circuits]: Types and Design Styles – very large scale integration.
2. MOTIVATION
General Terms
In this paper, we present a methodology for timing-driven placement and routing that develops further bounds-based ideas but differs from previous works in a method of their usage. We wanted to develop a formulation of timing requirements, which could be easily merged with the existing commercial placement tools to improve their timing performance. We targeted placers that produce a solution by minimizing linear or nonlinear function of net length with weights. Also it was demonstrated that a similar approach could be used to optimize routing for timing. In this case, improvement in timing is obtained by manipulation of order in net routing. The nets with the higher weights are routed first. As in the case of placement, timing requirements for routing were merged with the commercial routing tool.
Algorithms, Performance, Theory.
Keywords Net Delay Bound, Criticality Metrics, Placement, Routing.
1. INTRODUCTION While research on timing-driven VLSI placement and routing has been continuing for almost two decades, this problem is far from being closed. Among reasons contributing to this situation, we can name a few. (1) NP-hard nature of the problem requires to lower the complexity of approximation algorithms with the increase of problem dimensions
3. PROPOSED APPROACH The proposed approach to introducing timing requirements in placement and routing is based on computation of bounds on net delays prior to placement and routing respectively. The following facts should be mentioned.
Permission to make digital or hard copies of all or part of this work for personal or classroom use is granted without fee provided that copies are not made or distributed for profit or commercial advantage and that copies bear this notice and the full citation on the first page. To copy otherwise, or republish, to post on servers or to redistribute to lists, requires prior specific permission and/or a fee. ISPD’02, April 7-10, 2002, San Diego, California, USA. Copyright 2002 ACM 1-58113-460-6/02/0004…$5.00.
*
155
This work is supported in part by a grant from Intel Corp.
(1) All known algorithms for computing bounds on net delays are based on distribution of slacks at memory inputs and POs between constituent nets in the design, i.e., all of them provide zero-slack solutions [9][11][18]. (2) For the typical circuits with fanout and multiple POs, there is an infinite number of zero-slack solutions [19]. (3) All other algorithms for bound computations, with the exception of the one used in this paper, are greedy, i.e., they distribute slacks of internal nodes between other nodes in the vicinity. The only global algorithm, that distributes not slacks at internal nodes, but slacks at POs of the circuit and distributes them globally according to a function of net parameters, such as fanouts, capacitive loads or others, is used in this paper. This algorithm is provenly asymptotically optimal with respect to formulated objective function and has linear time complexity with respect to a graph size. (4) Unlike all other approaches to bounds on net delays, these bounds are not used to define a distance between modules, or in penalty functions. Instead, they are used in ratios that rank nets in design in terms of their probability to satisfy bounds. This approach to utilization of bounds happened to be very effective and when added to standard commercial tools improved timing in the test set very substantially.
search algorithm. Iterative application of the basic step results in monotonic decrease of the slack at outputs. See [11] for details and proofs. This algorithm has a complexity O(k(n+m)), where k is the number of iterations to achieve ε distance from the zero-slack solutions. Distribution of slacks based on net parameters and general net topology combined with low computational complexity determined our choice to use IMP algorithm in the criticality metrics.
5. RANKING NETS WITH RESPECT TO TIMING CRITICALITY Traditionally, criticality of nets in design is derived from their participation in the critical path, i.e., in the path with the minimal slack. Prior to layout, the critical path is identified by the static timing analysis tools based on switching delays of the cells and predicted propagation delays. It is well known that the pre-layout predictions of the critical path and the clock cycle are unreliable and prone to substantial errors. If critical nets are identified incorrectly and higher weights are assigned to them at the placement step, such assignment could be counterproductive for improving timing (this fact was confirmed by our experiments). It is clear that a better and more reliable way is needed for identification of nets, which potentially may play a larger role in circuit timing. Such metrics of criticality should be less dependent on selection of one small set of paths that are declared critical and should be global with respect to the whole design. Attempts to develop the criticality metrics prior to layout were made before, but they were not based on the bounds ideology. Bounds on net delays provide new opportunities for identification of critical nets. The criticality metrics for nets to be used for net weighting should allow ordering of nets with respect to criticality. It should also allow to characterize a net with respect to delay bound computed by the IMP algorithm. The following definition satisfies these requirements. Projected Net Delay (4) Net Criticality Metric = Bound on Net Delay A higher ratio in this formula corresponds to a higher net criticality.
4. NET DELAY BOUNDS In this section, we present a short description of the method for computing bounds on net delay used in this work. Let G = (V , E ) be a directed acyclic graph of modules and nets. V and E are respectively sets of vertices and edges of the graph. If U ρ is the slack at a primary output for the path ρ , it should be divided between the nets on the path proportionally to the net weights we , ρ ue = U
ρ
w
×
∑
e∈E
e w
(1)
e
ρ
But the net could be traversed by many paths from the circuit inputs to outputs, therefore, only the minimal value among all possible increments could be safely (without making a slack at the output negative) assigned to net e, ρ * u e = min max u e ρ∈Π e
Projected Net Delays are difficult to compute prior to layout. But, because we are using Net Criticality Metrics for ranking nets in layout, we need to find such approximations of Projected Net Delay values that are easily computable and retain ordering of nets in ranking. For this purpose, we will present some probabilistic and statistical justifications for substitution of the formula (4) by the simpler relation (9). While we are using normal distribution for this demonstration, the reasoning stands for any reasonable distribution.
(2)
Here Π e is a set of paths, which traverses edge e. For the general case where the weight function is used to distribute the path slack, the problem in formulation (1)-(2) is NP-hard. An iterative algorithm (the IMP algorithm) asymptotically converging to the optimal solution was proposed in [11]. Basic idea of this algorithm: The minimal value of the ratio in formula (1) of two additive functions defined on the same path ρ can be bound from below by
5.1 Probabilistic Interpretation of Criticality Metrics Projected Net Delays prior to layout could be considered as random values. A distribution function F(x) = P(x x1. Let u1 and u2 be bounds on respective net delays. We would like to demonstrate that ranking of nets, according to criticality metrics, is preserved when a mathematical expectation of a net delay is replaced by a net parameter.
− ( z − m x ) 2 σ 2x x dz ∫− ∞ e
2π
e
2 − ( z − m x ) 2σ x
(6)
Here mx = ∫−+∞ ∞ xf ( x)dx is the first moment, also called the mathematical expectation. σx = ∫−+ ∞∞ ( x − m x ) 2 f ( x ) dx is the standard deviation.
m(x2 )
Lemma 5.1
The distribution function F(x) allows to solve a problem of finding probability P(α≤x≤β) of random value being inside an interval (α,β): P(α≤x≤β)=F(β)-F(α).
u2
>
condition for x2 > x1 . u2
m ( x1 )
is a necessary and sufficient
u1
u1
Proof. (⇒): m ( x 2 ) > m ( x1 ) is equivalent to m ( x 2 ) > u 2 ;
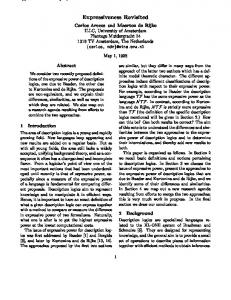
The normal distribution function f(x) has a shape as in Fig 1. The value of mx gives the “center” of the interval for possible values of a random variable. Other values are grouping around this central value.
u2
m ( x1 )
u1
u1
From definition of m(x) follows αx2 > u2 ; αx1
u1
After simplification, x2 > u2 , i.e. x 2 > x1 x1
f(x)
u2
u1
(⇐): x2 > x1 is equivalent to x2 > u2
1 2π σ
u2
u1
x1
u1
u1
.
;
This leads to α x 2 > u 2 ; i.e. m ( x 2 ) > u 2 . α x1
u1
m ( x1 )
u1
For the nonlinear increasing function m(x)=αxn(n>1), the lemma 5.1 works only in one direction.
xmin
mx
xmax
Lemma 5.2 If x2 > x1 then m( x2 ) > m( x1 ) . u 2 u1 u2 u1
Net Delay
Fig 1. Normal Probability Density Function (PDF)
Proof. From x2 > x1 ( x2 > x1 and n > 1 ), u2
Our criticality metric for placement is proposed in a form of Projected Net Delay/Bound on Net Delay, where the Bound on Net Delay is denoted by bx.
n
(7)
Here xmax is the maximal net delay, mx and σx are mathematical expectation and standard deviation respectively.
An advantage of the parameter-based approach is in the fact that it does not require the exact knowledge of function m(x). It is sufficient just to assume that such function could be derived from experimental data by regressional analysis as an empirical formula. Net Parameter (9) New Net Criticality Metric = Bound on Net Delay Sorted in the descending order, the criticality metrics of nets represent the ranking of nets with respect to their difficulties of implementation within projected bounds by layout tools. Net Parameters used in the definition may vary from one stage of layout to another. Details of selection of Net Parameters for formula (9) are provided in the following text.
For the Gaussian distribution, if xmin≈ 0, then σ x =xmax/6. Substitution into conditions (7) gives,
x max = m x + x max 2 ,
i.e. x max = 2m x
This means that the Net Criticality Metric can be rewritten as: Net Criticality Metric =
2mx bx
n
n follows x2 > u2 ; x2 = αx2 = m( x2 ) ; x n u1 m( x1 ) αx1 1 x1 m ( x ) m ( x ) 2 1 . Therefore, > u2 u1 Corollary 5.3 From Lemma 5.1 and 5.2, it follows that ordering of nets with respect to criticality metrics based on the net parameter is the same as for criticality metrics based on mathematical expectations of projected net delays.
To be sure that the projected net delay does not exceed a bound bx with the probability close to 1, the following conditions should be satisfied for the Gaussian distribution [20]. xmax = m x + 3σ x , xmax ≤ b x
u1
(8)
This means, that the probability for the net delay to be below the bound bx is decreasing when a ratio mx/bx is increasing.
5.3 Criticality Metrics for Placement
5.2 Statistical Approximation Formulas for Net Delays
Before placement, the locations of modules are unknown. The only available information includes a cell library and a netlist for design. Net delay bounds are computed from the requirements on the clock cycle and switching delays of cells by the IMP algorithm. Net delay is considered to be highly correlated with a net fanout [12], In formula (9), a role of a net parameter is given to the net fanout, which is known prior to physical design. Indeed, for the same value of the bound, net with the larger fanout has a higher probability to
It is difficult to make reliable predictions about an actual net delay prior to placement. But it is known that some available electrical characteristics of nets are strongly correlated with a net delay. It means that a regressional formula for mathematical expectation of net delays m(xi), where xi is a net parameter, could be derived from statistical data. In the majority of cases, statistical data are not 157
violate the bound. Thus, the Criticality Metric for Placement (CMPi ) is defined for net i as: Fanout of Net i CMPi = (10) Delay Bound of Net i Before Placement Sorted in descending order, the criticality metrics are mapped to the weight coefficients of nets in a design presented to a placer. Cells from the nets with larger CMPi will be placed closer to each other reducing probability of timing bounds violations.
completed on 3 routing layers to make them as congested as possible. Table 1. Benchmark set circuits description Circuit Circuit Size Ckt # Name Cell # Net # 1 clma 30243 30629 2 el 11389 11410 3 s38417 26323 26354 4 s38584 21076 21117 5 b17s 29106 29145 6 b22s 19092 19126 7 c1 60486 61225 8 c2 42152 42231 9 c3 53541 53638
5.4 Criticality Metrics for Routing In designs with the high density of interconnects, the order of routing matters. Nets routed first have higher probability to be routed on shorter distances. The criticality metrics for routing (CMR) are used for selection of the routing order by providing higher weights to nets that should be routed first. The same general formula (5) was applied to the definition of net criticality. As before, the higher criticality metric corresponds to the nets with a higher ratio of a net parameter to a value of timing bound on a net delay. After placement, the more detailed information is available, which can be utilized for the more precise computation of bounds on net delays. When positions of the modules are determined, a perimeter of the covering rectangle for net terminals could be selected as a net parameter. Perimeter of Covering Rectangle for Net i CMR i = (11) Delay Bound of Net i Before Routing Details of the experiments related to selection of the net parameters for criticality metrics in placement and routing can be found in [19]. Computed values of the criticality metrics for the routing step are sorted in the descending order and are mapped into the range of weights provided by the router. Higher weights are assigned to the nets from the top of the sorted list of the net criticality values. Timing complexity of the criticality calculation for both placement and routing is O(k(n+m)) for bounds computation and O(plogp)+O(p) for criticality metrics. Here n is the number of cells, m is the number of edges in directed acyclic graph p is the number of nets in the design, and k is the number of iterations in bounds computation.
Experiments were conducted by the integration of the new criticality metrics in the layout flow: (1) Application of CMP to placement alone (section 6.1) (2) Application of CMR to routing alone (section 6.2), (3) Application of CMP and CMR to placement and routing respectively in one pass of layout process (section 6.3). In the following series of experiments, the designs were first placed and routed by the commercial layout tool in a wire length minimization mode. Then the timing analysis tool integrated with the commercial layout tool was used to get the longest path delay (shown in columns “WLM” in the tables below) as a basis for comparison with other layout methods. To make the design layout congested, the channel width was set at 0 (no spacing between rows), row utilization was greater than 70% and routing was completed on 3 layers. It should be noted that the same parameter setting for the layout tool was used in all experiments reported in the tables below. The script file of the setups can be found in [19].
6.1 Placement Table 2. Experimental results for placement Clock Cycle (ns) Ckt # WLM TDP CPF CMP 1 7.01 6.29 5.02 4.81 2 5.74 5.42 4.8 3.83 3 8.2 6.3 4.29 4.63 4 5.4 4.34 4.57 3.94 5 9.76 10.11 10.39 7.28 6 8.63 6.93 7.67 6.65 7 7.03 5.94 5.68 5.76 8 5.34 4.49 4.22 4.13 9 5.28 4.9 4.58 4.58 Average Gain in % 12.6% 18.4% 26.4%
6. EXPERIMENTAL RESULTS Three goals could be achieved by integration of the new criticality metrics with the traditional layout tools: 1) To obtain better timing than one provided by tools that minimize wiring length. 2) To achieve better results than those provided by the new commercial timing-driven tools. 3) To achieve this result in one pass of layout without increase in wiring length and chip area. The net timing bounds and the criticality metrics calculations have been implemented in C. The criticality metrics of nets were converted into net weights and merged with the contemporary commercial layout tool from the leading CAD provider. This placement tool minimizes the quadratic function Σx aij(xi --xj)2, where aij are the net weights. This form of the objective function is used in many commercial and university layout tools [27][28][17] [16][21][2][22][23]. Table 1 presents design names and sizes for all circuits in the benchmark set. Designs 1 to 4 were taken from the CBL benchmark set [24], circuits 5 and 6 from the ITC99 benchmark set [25]. They were modified to reflect the more realistic path lengths and clock cycles. Designs 7 to 9 were generated by placing several designs from the CBL benchmarks on the same chip. A commercial standard cell library (four-layer, 0.18 micron technology) was used in experiments [26]. All layouts were
WLM: Wire Length Minimization layout by the commercial tool; TDP: layout by the commercial Timing-Driven Placement tool; CPF: layout by the commercial WLM tool with nets on Critical Paths given higher weights during placement (2-pass solution); CMP: layout by the commercial WLM tool with weights derived from new Criticality Metrics for Placement (1-pass solution).
In this set of experiments, application of the new criticality metric for placement was compared with other modes of placement. The base for comparison was WLM (Wire Length Minimization) mode of the commercial tool when all nets received equal weights by default. The first placement mode for comparison was a timingdriven placement tool (TDP) from the same company. In a timingdriven mode, the placer does not accept any criticality information and makes its own decisions on net weights. Mode CPF (Critical Path First) is a classical approach to the critical path information. It includes two passes of layout. The first pass is WLM placement 158
followed by WLM routing. The resulting layout is subjected to timing analysis and a set of critical and sub-critical paths was identified. Nets in this set are declared critical and are assigned higher weights. The layout was repeated with the new weights on critical nets. New criticality metrics for placement (CMP) were computed prior to placement, and as a result, CMP mode requires one pass of layout. All routing, circuit extraction and timing analysis in experiments were performed by the same tools from the same tool set. The number of nets with weights assigned to them was the same in CPF and CMP experiments. In experiments with TDR, it was controlled by the tool. Application of new criticality metrics to placement alone improved the average clock cycle by 26.4%, versus 12.6% for TDP and 18.4% for CPF methodology (Table 2). Moreover, the new criticality metrics produced improvements consistently for all circuits in the benchmark set, while the results from application of the traditional CPF metric fluctuated. For example, the clock cycle for CPF metric increased by 6.5% with respect to WLM for design 5. All optimization strategies did not produce any increase in the area with respect to WireLenMin results.
Clock Cycle Cell Netlist Library Requirements
Clock Cycle Requirements
Weight Assignment for Placement
Placer Weight Assignment for Routing
Delay Bounds and Criticality Metrics (CMP) Computation Weight Assignment to nets
Placer
Router
Delay Bounds and Criticality Metrics (CMR) Computation Weight Assignment to nets
Router Timing Analysis & i iPath l Identification Timing Analysis Critical Path Information
6.2 Routing Table 3 presents results of application of the new criticality metrics to routing alone. The results were obtained for the same placement generated by WLM with the routing order of the same router being manipulated. As for placement, the new metric CMR was compared to the CPF methodology and timing-driven routing in the commercial tool. Application of the CMR (one pass) resulted in 9.2% improvement in the clock cycle (average for the test set) versus improvement by 5.5% for TDR and 9.1% improvement for CPF (two pass).
Output
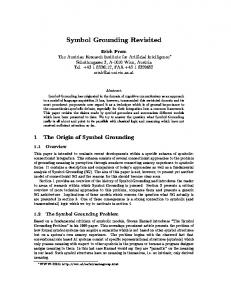
Traditional iterative layout flow
6.67 4.8 7.91 5.27 9.86 7.54 6.86 5.16 5.04 5.5%
5.99 4.68 8.05 4.91 9.55 7.46 6.26 5.11 4.9 9.1%
Output
One-pass criticality-based design flow
Fig 2. One-pass flow versus multiple passes flow in physical design The average improvement by the new criticality metrics in combination with the WLM system was 29.5% that is substantially better than 17.1% improvement by the timing-driven mode or 20.2% improvement achieved by the two-pass CPF method (Table 4). In the timing-driven mode of the layout system, improvement in a clock cycle was accompanied by 0.84% decrease of the total wire length. Layout based on the new criticality metrics supplied to WLM tool achieved decrease of wire length by 1.36% in addition to timing optimization.
Table 3. Experimental results for routing Clock Cycle (ns) Ckt # WLM TDR CPF CMR 1 7.01 2 5.74 3 8.2 4 5.4 5 9.76 6 8.63 7 7.03 8 5.34 9 5.28 Average Gain in %
Cell Netlist Library
6.04 4.66 8.05 4.9 9.45 7.47 6.23 5.15 4.88 9.2%
Table 4. Experimental results for placement and routing Clock Cycle (ns) Ckt# WLM TDPR CPF CMP+CMR 1 7.01 6.1 4.92 4.68 2 5.74 4.59 4.28 3.77 3 8.2 6.12 4.09 4.5 4 5.4 4.34 4.32 3.91 5 9.76 9.75 10.43 6.7 6 8.63 7.25 7.97 6.47 7 7.03 5.74 5.78 5.35 8 5.34 4.38 4.36 4.01 9 5.28 4.02 4.25 4.22 17.1% 20.2% 29.5% Average Gain in %
WLM: Wire Length Minimization layout by the commercial tool; TDR: layout by the commercial Timing-Driven Routing tool; CPF: layout by the commercial WLM tool with nets on Critical Paths given higher weights during routing (2-pass solution); CMR: layout by the commercial WLM tool with weights derived from new criticality Metrics for Routing (1-pass solution).
6.3 New Criticality Metrics for Placement and Routing
WLM: Wire Length Minimization layout by the commercial tool; TDPR: layout by the commercial Timing-Driven Placement and Routing tool; CPF: layout by the commercial WLM tool with nets on Critical Paths given higher weights during placement and routing (2pass solution); CMP+CMR: layout by the commercial WLM tool with weights derived from new Criticality Metrics for Placement and Criticality Metrics for Routing (1-pass solution).
In this series of experiments, the new criticality metrics were used for both placement and routing (CMP+CMR) of the benchmark set. The criticality metrics were integrated with the placer and router of the commercial layout tool. Prior to layout, the net bounds were calculated and used to compute CMP and net weights for placement. Timing bounds were recalculated after placement and transformed to CMR for routing. The flow of the procedure (onepass criticality-based design flow) comparing to the traditional multiple passes procedure is shown in Fig 2.
Histograms for designs 1 and 4 from Table 4 are presented by Fig 3. Results of application of different layout tools are merged in one graph for comparison. In the graph, the slack value (ns) for 7.01ns (design 1) and 5.4ns (design 4) clock cycle is on x-axis, the y-axis 159
of Integrated Circuits and Systems, Volume: 8 Issue: 8, Aug. 1989, pp. 860 -874 [10] H. Youssef, E. Shragowitz, “Timing Constraints for Correct Performance”, Proc. ICCAD, 1990, pp. 24-27. [11] H. Youssef, R. Lin, E. Shragowitz, “Bounds on Net Delays for VLSI Circuits,” IEEE Trans. on Circuits and Systems, Vol. 39, No. 11, November 1992, pp. 815-824 [12] W. K. Luk, "A Fast Physical Constraint Generator for Timing-Driven Layout," Proc. DAC, June 1991, pp. 626-631. [13] G.E. Tellez, D.A. Knol, M. Sarrafzadeh, "A Performance-Driven Placement Technique Based on a New Budgeting Criterion", Proc. IEEE Intl. Symp. on Circuits and Systems, May 1996, vol. 4, pp. 504-507. [14]R. Baldick, A. B. Kahng, A. A. Kennings, I. L. Markov, "Efficient Optimization by Modifying the Objective Function”, IEEE Trans. on Circuits and Systems, 48(8) (2001), pp. 947-957. [15] J.Y. Sayah, R.Gupta, D.D. Sherlekar, et.al., “Design Planning for High Performance ASICs”, IBM Journal of Research and Development, vol40, no.4, July 1996, pp. 431-452 [16] V. Natesan, D. Bhatia , “Performance Driven Placement for CellBased Designs”, Proc. ASIC Conference and Exhibit, 1995, pp. 237-240 [17] Bill Halpin, C.Y. Chen, N. Sehgal, “A Sensitivity Based Placer for Standard Cells”, GLS-VLSI 2000, pp. 193-196 [18] C. Chen, X. Yang, M. Sarrafzadeh, “Potential Slack: An Effective Metric of Combinational Circuit Performance,” Proc. ICCAD, 2000, pp. 198-201 [19] E. Shragowitz, H. Chang, J. Liu, H. Youssef, B. Lu, S. Sutanthavibul, “New Bound-Based Net Criticality Metrics for Timing-Driven Physical Design”, Technical Report, Computer Science Department, University of Minnesota, TR 01-024, June 2001 [20] A. Papoulis, “Probability, Random Variables and Stochastic Processes”, McGraw-Hill, 1999 [21] J. Vygen, “Algorithm for Large-Scale Flat Placement”, Proc. DAC97, pp. 746-751 [22] R.S. Tsay, E. Kuh, “A Unified Approach to Partitioning and Placement”, IEEE Trans. Circuits and Systems, Volume: 38 Issue: 5 , May 1991, pp. 521 –533 [23] J.M. Kleinhans, G. Sigl, F.M. Johannes, K.J. Antreich, “GORDIAN:VLSI Placement by Quadratic Programming and Slicing Optimization”, IEEE Trans. Computer-Aided Design of Integrated Circuits and Systems, Volume: 10 Issue: 3 , March 1991, pp. 356 –365 [24] http://ww.cbl.ncsu.edu/benchmarks/Benchmarks-upto-1996.html, CBL (Collaborative Benchmarking Laboratory) [25] http://ww.cerc.utexas.edu/itc99-benchmarks/bench.html, ITC99 (International Test Conference) Benchmark [26] http://ww.virtual-silicon.com, Virtual-Silicon Technology Inc. [27] “Envisia Silicon Ensemble Place-and-Route Reference”, Product Version 5.1, Cadence, Dec. 1998 [28] http://www.cypress.com, Cypress Warp 6.2
shows the numbers of paths in the corresponding range of slacks. These histograms illustrate results reported in Table 4 for designs 1 and 4.
7. CONCLUSION It was demonstrated that new criticality metrics are indeed capable of predicting “difficult” nets in a design and that assignment of higher weights to such nets produced significant improvements in timing. This could happen because the bound computation algorithm provided realistic evaluation of bounds that could be used in criticality evaluations. Other tested methods of criticality evaluations were inferior in experiments. In one pass of physical design, the new bounds-based criticality metrics allowed to achieve the results that are substantially superior to those achieved by all competing methods including commercial timing-driven place and route tool. The new criticality metrics could be integrated with any layout system that allows weights for nets in the design. The new criticality metrics could be used for timing optimization of placement alone or routing alone if desired.
8. ACKNOWLEDGMENT The authors are grateful to R. Gupta from the Intel. Corp. for his helpful comments and discussions.
9. REFERENCES [1] M. Jackson, E.S. Kuh, “Performance-Driven Placement of Cell Based IC’s”, Proc. DAC, 1989, pp. 370-375 [2] A. Srinivasan, K. Chaudhary and E. S. Kuh, "RITUAL: A Performance Driven Placement for Small-Cell ICs", Proc. ICCAD, 1991, pp. 48-51. [3] T. Hamada, C.K. Cheng, P.M. Chau, “Prime: A Timing-Driven Placement Tool Using a Piecewise Linear Resistive Network Approach”, Proc. DAC, 1993, pp. 531-536. [4] W. Swartz, C. Sechen, “Timing Driven Placement for Large Standard Cell Circuits,” Proc. DAC, 1995, pp. 211-215 [5] M. Burstein, M.N. Youssef, “Timing Influenced Layout Design”, Proc. DAC, 1985, pp. 124 -130 [6] T. Gao, P.M. Vaidya, C.L. Liu, “A New Performance Driven Placement Algorithm”, Proc. ICCAD, 1991, pp. 44 -47 [7] M. Marek-Sadowska, S.P. Lin, “Timing Driven Placement”, Proc. ICCAD, 1989, pp. 94 -97 [8] H. Eisenmann, F. M. Johannes, “Generic Global Placement and Floorplanning”, Proc. DAC, June 1998 , pp. 269-274 [9] R. Nair, C.L. Berman, P.S. Hauge,E.J. Yoffa, “Generation of performance constraints for layout”, IEEE Trans. Computer-Aided Design
b) Design 4 (21076 cells and 21117 nets)
a) Design 1 (30243 cells and 30629 nets) 900
700
800
Number of Paths
Number of Paths
1000
800
700 600
WLM
500
CMP+CMR CPF
400
TDPR
300 200
600
500
WLM CMP+CMR
400
CPF TDPR
300
200
100
100
0
0 0
0.2
0.4
0.6
0.8
1
1.2
1.4
1.6
1.8
2
2.2
2.4
2.6
2.8
3
0
3.2
0.2
0.4
0.6
0.8
1
1.2
1.4
1.6
1.8
2
2.2
2.4
2.6
2.8
Slack (ns) for Clock Period 5.4ns
Slack (ns) for Clock Period 7.01ns
Fig 3. Histograms of top 3000 critical paths for Design 1 and Design 4 WLM: Wire Length Minimization layout by the commercial tool; TDPR: layout by the commercial Timing-Driven Placement and Routing tool; CPF: layout by the commercial WLM tool with nets on Critical Paths given higher weights during second pass of placement and routing (2-pass solution); CMP+CMR: layout by the commercial WLM tool with weights derived from new Criticality Metrics for Placement and Criticality Metrics for Routing (1-pass solution).
160