Neural Computing and Applications Cloud Computing System Risk Estimation and Service Selection Approach Based on Cloud Focus Theory --Manuscript Draft-Manuscript Number:
NCAA-D-15-00873R2
Full Title:
Cloud Computing System Risk Estimation and Service Selection Approach Based on Cloud Focus Theory
Article Type:
Original Article
Keywords:
SLA; QoS; Uncertainty Comtuping; Cloud Focus Theory; Cloud computing
Corresponding Author:
fan lin, Dr. Xiamen University Xiamen, CHINA
Corresponding Author Secondary Information: Corresponding Author's Institution:
Xiamen University
Corresponding Author's Secondary Institution: First Author:
fan lin, Dr.
First Author Secondary Information: Order of Authors:
fan lin, Dr. WenHua Zeng LvQing Yang Yue Wang ShuFu Lin JiaSong Zeng
Order of Authors Secondary Information: Funding Information:
National Social Science Foundation of China (15CGL001)
Response to Reviewers:
Dear Editors and Reviewers: Thank you for your letter and for the reviewers’ comments concerning our manuscript entitled “Cloud Computing System Risk Estimation and Service Selection Approach Based on Cloud Focus Theory”. Those comments are all valuable and very helpful for revising and improving our paper, as well as the important guiding significance to our researches. We have studied comments carefully and have made correction which we hope to get approval. Revised portion are marked in blue in the paper. The main corrections in the paper and the responds to the reviewer’s comments are as follows:
Professor fan lin
Responds to the reviewer’s comments: Revise 2th Reviewer1 This paper proposed a Cloud Model for risk evaluation of cloud computing. After careful revision, this paper contains convincible theoretical description and effective experiment results. But there are some issues in the paper: 1, “Uncertainty Comtuping” is a spelling mistake of line 43 in page 1. 2, “(X1,X2,…Xn) ”lacking a comma in the formula of Arithmetic.4 , line 51 in page 18. 3, The format of references [9-13],[15-33] and [35-36] , please fix the authors spelling as the Journal’s requirement. If authors revise those problems , I recommend to publish in this journal. Response:
Powered by Editorial Manager® and ProduXion Manager® from Aries Systems Corporation
1, Had changed to Uncertainty Computing , which in key words 2,Changed to (X1,X2,…,Xn) on line 50 of page 18,line 42 of page 19 and line 20 of page 22 3,Fixed the reference Reviewer2 In the revised paper,the author has made a good effort to amend the reviewers' concerns within the available space. I would like to recommend the paper for publication in neural computing and application after the following revisions: Page 1,line 43:“KeyWords” is amended with “Key words”; “Comtuping” is amended with “Computing”. Response: 1, Changed to Key words 2,Fixed to Computing Reviewer3 Authors have done a lot of efforts in revision, and give more convincible statements about the contribution of this paper. Furthermore, the proposed algorithm is more robust and faster to be applied in real applications, and it has important theoretical significance and application value. I recommend published in this journal. Reviewer4 The authors have substantially revised the paper and addressed most of the comments. This paper had contributed to the cloud computing risk assessment with innovative approaches. However, please take attention to the format of all equations and variables in text, that should be edited with Equation Editor in the Microsoft Word better. If the authors could improve these problems ,I should suggest to accept this paper. Response: Fixed the formulas on line 50 of page 8, line 7 of page 9,line 2~3 of page 10 and so on with blue color marked..
Powered by Editorial Manager® and ProduXion Manager® from Aries Systems Corporation
ManuscriptClick here to download Manuscript NCAA-D-15-00873-By Revision2 with Blue Color marked (Fan Lin20151202 ) .docx Click here to view linked References
1 2 3 4 5 6 7 8 9 10 11 12 13 14 15 16 17 18 19 20 21 22 23 24 25 26 27 28 29 30 31 32 33 34 35 36 37 38 39 40 41 42 43 44 45 46 47 48 49 50 51 52 53 54 55 56 57 58 59 60 61 62 63 64 65
Cloud Computing System Risk Estimation and Service Selection Approach Based on Cloud Focus Theory Fan Lin*, Wenhua Zeng, Lvqing YANG, Yue Wang, Shufu Lin, Jiasong Zeng School of software, Xiamen University, Xiamen, China *
[email protected]
Abstract The main cloud computing service providers usually provide cross-regional and services of Crossing Multi Internet Data Centers (IDC) that supported with selection strategy of Service Level Agreement (SLA) Risk Constraint. But the traditional Quality of Service (QoS) aware WebService selection approach cannot ensure the real-time and the reliability of services selection. We proposed a cloud computing system risk assessment method based on Cloud Theory, and generated the five property clouds by collecting the risk value and four risk indicators from each Virtual Machine (VM). The Cloud Backward Generator integrated these five clouds into one cloud, that according to the weight matrix. So that the risk prediction value is transferred to the risk level quantification. Then we tested the WebService selection experiments by using risk assessment level as QoS mainly constraint, and comparing with LRU and MAIS method. The result showed that the success rate and efficiency of risk assessment with Cloud Focus Theory WebServices selection approaches are more quickly and efficient.
KeyWords: SLA; QoS; Uncertainty Computing; Cloud Focus Theory; Cloud Computing
1. Introduction Cloud computing providers, especially those larger ones, usually deploy vast computing resources as well as data centers in different regions to make all nonlocal resources accessible for worldwide users. For example, Microsoft has more than 20 data centers all over the world, covering hundreds of thousands of physical computing nodes that can provide nearly millions of virtualized node resources. When accessing such a huge cloud computing system, users need to evaluate the risk state of the provider’s system from data center to service entry so as to achieve service area selection of SLA on a macro level and the QoS constraint-based service selection on a micro level.
1 2 3 4 5 6 7 8 9 10 11 12 13 14 15 16 17 18 19 20 21 22 23 24 25 26 27 28 29 30 31 32 33 34 35 36 37 38 39 40 41 42 43 44 45 46 47 48 49 50 51 52 53 54 55 56 57 58 59 60 61 62 63 64 65
Qualitative Cloud Droplet Risk Evaluation
Backward Cloud Generator
SLA
Comprehensive Multi-Point Quantitative Risk Evaluation
Constraint
P T AR
PTAR
PTAR
VM1
VM2
VM n
QoS Constraint
Cloud Computing WebService
Web A
Web B
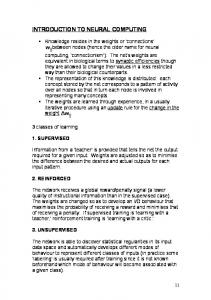
Figure.1 Architecture of Cloud Computing Service Selection Based on SLA Constraint
In the SLA, specific QoS constrain is used to ensure the service quality so as to fulfill customer-oriented service commitment. Therefore, it is crucial to evaluate the uncertain individual risk degree of a virtual machine and the overall risk level of cloud computing data center. SLA is also frequently adopted to guarantee the quality of Web service. In the environment of large-scale distributed cloud computing system, SLA is an agreement between users and service providers and involves non-quantitative, qualitative, uncertain and fuzzy indicators in most cases, whereas QoS concerns mostly quantifiable and testable ones. The QoS (P, T, A, R) of single-point based virtual machine is assessed, and the problem of alternation between quantitative information and qualitative judgment is resolved based on the cloud theory: by collecting multiple risk prediction values of virtual machine, a cloud model with five indicators is generated; then the backward cloud generator is used for the conversion from quantity to quality to achieve an overall risk level evaluation of the cloud computing system. The assessment for the risk and safety level of uncertain cloud computing is significant. The cloud computing service system under SLA and the QoS-based Web service model are firstly expounded; then, based on cloud gravity center theory, the membership of WebService is divided to determine whether SLA has been breached; and finally, the cross-domain web service selection of cloud computing service based on risk evaluation is achieved; compared with the traditional LRU (Least Recently Used) and MAIS methods, service selection after risk evaluation is superior in terms of success rate and efficiency.
1 2 3 4 5 6 7 8 9 10 11 12 13 14 15 16 17 18 19 20 21 22 23 24 25 26 27 28 29 30 31 32 33 34 35 36 37 38 39 40 41 42 43 44 45 46 47 48 49 50 51 52 53 54 55 56 57 58 59 60 61 62 63 64 65
2. Risk Assessment for SLA-based Cloud Computing Services 2.1 SLA for Cloud Computing System In a cloud computing environment, the service provider and service user need to sign or follow an agreement where the service is defined in terms of its performance, quality, price, availability, safety, etc. It is a means provided by service providers to meet the requirement of service users. SLA is essentially an agreement signed between the two parties to guarantee the system’s measurable performance and predefined attainable quality. If service providers failed to fulfill the commitment of service quality, users would get economic compensation according to the SLA. It not only protects the rights of users in buying the service, but also provides an assessable competition basis for service providers. The high complexity and distributed feature of cloud computing system bring great challenge to the SLA of cloud computing providers and pose a higher demand especially in terms of flexibility and expansibility.
SLA judgment
Qualitative risk analysis
QoS judgment
Quantitative risk analysis
Risk prediction value
Super-entropy
Entropy
Cloud Model
Expected value
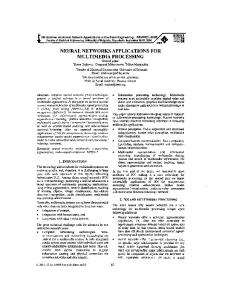
Figure.2 Cloud Model for Qualitative SLA Risk Assessment
In a cloud computing environment, the SLA agreement between users and service providers contains various conventions, and the central part of which is the QoS constraint of Web service. For example, before purchasing cloud computing services, users need to reach an agreement with the provider in terms of the response speed,
1 2 3 4 5 6 7 8 9 10 11 12 13 14 15 16 17 18 19 20 21 22 23 24 25 26 27 28 29 30 31 32 33 34 35 36 37 38 39 40 41 42 43 44 45 46 47 48 49 50 51 52 53 54 55 56 57 58 59 60 61 62 63 64 65
reliability and stability of Web services, which are defined in SLA. But in actual application of SLA constraint, qualitative descriptions of SLA conditions are often fuzzy and uncertain: semi-formal languages are usually adopted for their descriptions, which only define the high-level demands between service providers and users and do not involve specific technical indicators and numerical parameters. However, service providers do not know how SLA has been breached [2,3], so the constraint condition of QoS specified in SLA generally consists of both quantitative and qualitative elements: the measuring parameters, e.g. performance, time, etc., are commonly described quantitatively, while others, e.g. quality, risk and security, etc., are mostly described qualitatively. Therefore, the conversion from quantitative descriptions into qualitative ones is important. 2.2 The Strategy of SLA Oriented QoS Service Cloud computing offers a large number of service entrances, and the providers often implement a single mapping of multi-service entrance through load balancing, so QoS constraint is one of the key factors in service selection and application. A five-element QoS model including execution time, price and credit is proposed in literature [3]; in literature [4], a QoS description model for Web service is obtained; literatures [5,6] describe the QoS meta-model and QoS attribute of Web service, and use the service publication and acquisition mechanism with QoS constraint information, the QoS evaluation method and the three-dimensional QoS model to support the QoS-based service selection. For QoS models proposed for application in different fields, the QoS attributes concerned are also different [7]. This study on risk evaluation aims at taking the risk level as the core factor of QoS constraint model to provide risk controllable service for QoS service selection strategy under the SLA. The WebService in Cloud Computing consists of a group of RESTful service interfaces and can be defined as an abstract representation of a combination request: 𝑆𝑒𝑟𝑣𝑖𝑐𝑒𝐶 = {𝑆1 , 𝑆2 , … , 𝑆𝑛 } , where ServiceC refers to the required service composition class. Specific service can be defined as an instantiation of abstract composite service. Each ServiceC in an abstract service class is bound to a specific service “Sj” to get a specific composite service, wherein 𝑠𝑗 ∈ 𝑆𝑗 and 𝑆𝑗 = {𝑆𝑗1 , 𝑆𝑗2 , … , 𝑆𝑗𝑖 } contains “i” services with different QoS values but same functions. QoS attributes generally include reliability, price factor, range constraint, service response time and packet loss probability. The qualitative hierarchical description is generally made for the price, confidence level and range constraint, while the service
1 2 3 4 5 6 7 8 9 10 11 12 13 14 15 16 17 18 19 20 21 22 23 24 25 26 27 28 29 30 31 32 33 34 35 36 37 38 39 40 41 42 43 44 45 46 47 48 49 50 51 52 53 54 55 56 57 58 59 60 61 62 63 64 65
response time is quantitatively described. In this paper, in addition to traditional attribute elements, the risk evaluation level is introduced and the greater weight is used to describe the QoS attributes so that the risk reference factors of users’ preference choice can be provided when a cloud computing system implements external services. In a service composition, service candidates have different QoS attribute values. The utility function is usually adopted to map QoS vectors to the single actual numerical value to enable the sorting and arrangement of candidate services. In this paper, QoS utility function is similar to: 𝑟
𝑈(𝑆) = ∑ 𝑘=1
𝑚𝑎𝑥 𝑄𝑗,𝑘 − 𝑞𝑘 (𝑠) 𝑚𝑎𝑥 𝑚𝑖𝑛 𝑄𝑗,𝑘 − 𝑄𝑗,𝑘
∙ 𝑊𝑘
(1)
The maximum and minimum aggregate values of the kth QoS attribute of a service “S” are calculated as follows:
𝑟
𝑈(𝑆) = ∑ 𝑘=1
𝑚𝑎𝑥 𝑄𝑗,𝑘 − 𝑞𝑘 (𝑠)
𝑄𝑘𝑚𝑎𝑥 − 𝑄𝑘𝑚𝑖𝑛
∙ 𝑊𝑘
(2)
𝑛 𝑚𝑎𝑥 𝑚𝑎𝑥 𝑄𝑘𝑚𝑎𝑥 = ∑ 𝑄𝑗,𝑘 , 𝑄𝑗,𝑘 = 𝑚𝑎𝑥∀𝑠𝑗𝑖 ∈𝑠𝑗 𝑞𝑘 (𝑠𝑗𝑖 )
(3)
𝑗=1
Similarly, 𝑛
𝑄𝑘𝑚𝑖𝑛
𝑚𝑖𝑛 𝑚𝑖𝑛 = ∑ 𝑄𝑗,𝑘 , 𝑄𝑗,𝑘 = 𝑚𝑖𝑛∀𝑠𝑗𝑖 ∈𝑠𝑗 𝑞𝑘 (𝑠𝑗𝑖 )
(4)
𝑗=1
𝑤𝑘 ∈ 𝑅 + (∑𝑟𝑘=1 𝑤𝑘 = 1)
(5)
𝑚𝑖𝑛 Wherein, it represented the user preference and 𝑄𝑗,𝑘 represents that the kth attribute
value is the minimum value of service class 𝑠𝑗 of all candidate services, and similarly, 𝑚𝑎𝑥 𝑄𝑗,𝑘 represents the maximum value, 𝑄𝑘𝑚𝑖𝑛 is the minimum value of the kth attribute
of a service “S” and 𝑄𝑘𝑚𝑖𝑛 represents the maximum value. The above-mentioned QoS utility computing is a simple weighted sum and its actual effect can be further optimized. The service selection with global QoS constraint is a multi-objective optimization process. For a given service composition “S”, its optimal choice should satisfy the
following two conditions: 1 2 3 4 5 6 7 8 9 10 11 12 13 14 15 16 17 18 19 20 21 22 23 24 25 26 27 28 29 30 31 32 33 34 35 36 37 38 39 40 41 42 43 44 45 46 47 48 49 50 51 52 53 54 55 56 57 58 59 60 61 62 63 64 65
(1) For a given vector “ CS = {𝐶1 , 𝐶2 , … , 𝐶𝑚 } ( 0 ≤ 𝑚 ≤ 𝑟 ” with global QoS constraint, q(s) C(𝐶𝑘 ∈ 𝐶𝑆, wherein q(s) is the QoS value of aggregated combination service. (2) The maximum total utility value “U(s)” is determined in the composite service. However, determining the optimal composition needs to enumerate all possible combinations of candidate services. It is essentially a NP problem, which is required to adopt the global multi-objective optimization algorithm with constraint to make quick choice. The traditional methods that are optional include genetic algorithm, ant colony algorithm, and mixed integer programming, etc. [8] For the SLA-oriented QoS service strategy, through the quantitative evaluation of QoS attributes in the above section, such as virtual machine performance indicator “P”, virtual machine time indicator “T”, alarm log indicator “A” and LSA risk identification indicator “R”, the membership degree of QoS attributes is required to be divided to determine whether SLA is breached, so there is a need to make qualitative identification and description of qualitative QoS attribute values. 2.3 The Risk Evaluation of SLA-oriented Cloud Computing Services Selection Cloud computing is an internet-based computing model, in which extensible and ondemand computing resources are provided. WebService can be used to build the service-oriented and distributed cloud computing applications [9]. According to the SOA paradigm, the composite application program is designated as an abstract process constituted by abstract service set (called service class or task). In the service operation, a candidate service is selected and called for each service class [10]. Therefore, WebService is frequently designed to be in a loosely coupled flexible structure, and a single service is reentrant and there is no strong dependency between service interfaces. QoS parameter plays an important role in service selection and directly determines whether a user’s access request is ultimately successful or not. QoS parameter often includes key quantitative indicators and qualitative indicators, such as virtual machine performance indicator P, virtual machine time indicator T, alarm indicator A, and LSA risk recognition indicator R. At the expected QoS level, SLA is often used as the contract basis between users and service providers. The purpose of QoS aware selection service is to effectively discover the best combination of WebService candidates, and to satisfy the final end-to-end QoS constraint under the condition of fulfilling a specific
SLA [11]. 1 2 3 4 5 6 7 8 9 10 11 12 13 14 15 16 17 18 19 20 21 22 23 24 25 26 27 28 29 30 31 32 33 34 35 36 37 38 39 40 41 42 43 44 45 46 47 48 49 50 51 52 53 54 55 56 57 58 59 60 61 62 63 64 65
Cloud computing environment is highly dynamic and the QoS values at the Web service layer change dynamically with service selection. Since different Web service combinations involve different virtual resources, main parameters in the corresponding QoS change accordingly. From a macro perspective, the service level agreements (SLA) are different in different cloud computing data centers (computer room) accordingly. So, risk evaluation can be used as both the condition of service selection with QoS constraint and the reference of cross-domain SLA service selection. Since the service selection itself will cause the cloud computing system to reschedule virtual resources, for the service-oriented cloud computing system application, the risk evaluation process should have quick reaction capability and self-adaptability, which are very important. Therefore, the following points are generally taken into account: (1) The service risk factor has not been taken into account in existing service selection methods. The QoS values at the Web service layer of a cloud computing system are usually weighted after the operating parameters of WebService nodes being collected. These operating parameters are from different operating systems, acquired using different programming languages, and operate in different virtual platforms. It is difficult to uniformly express massive data with different natures and dimensions as a consistent risk model. In a changeable cloud computing environment, many uncertainties such as resource location, wide-area network condition and service response time always affect the quality of cloud computing service. As a result, merely using basic quantitative data and qualitative evaluation, it is difficult for conventional QoS constraint-based service selection method to provide an effective service selection strategy for cloud computing system. (2) In different cloud computing service centers, the service level agreements of WebService are different, so the risk evaluation also changes for different cloud computing services. SLA evaluation is crucial for cross-domain cloud computing services.
3. The Risk Evaluation Model Based on Membership Cloud The above risk prediction method is to make analysis and prediction based on the data obtained from the virtual machine. The risk prediction value reflects both current risk status and subsequent trend [7], providing a reference for risk changing tendency of a single virtual machine node. But when the risk level evaluation of cloud computing system is made at a more macro level, or the service selection of cloud computing data
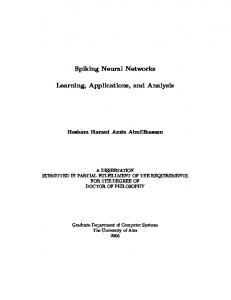
center is implemented at a SLA level, the single-node risk prediction of virtual machine is incapable to meet the demands. Therefore, a membership cloud model with five reference risk levels is firstly built in this study based on the construction principle of cloud model; then, the risk prediction values of virtual machines are collected into a risk evaluation center and the inverse cloud generator is used to construct cloud droplets, and a cloud with five indicators is constructed and these cloud droplets are converted into an evaluation cloud. The following figure is the process framework for overall risk evaluation of cloud computing system based on the risk prediction values. Risk evaluation aims at performing overall evaluation using the collected data of quantified risk value [12] to achieve a qualitative judgment of overall risk level of cloud computing system.
Risk Evaluation Request
Data Collection
Data Preprocessing
Attribute1
... Attributen
Backward Cloud Generator Of Risk Level
Risk Level Division
Weight Evaluation Of Risk Factors
Calculate Risk Level
Cloud Generator
Rules
Attribute Cloud of Risk level
Standard Risk Cloud Rules Generator
Synthesis
Risk Evaluation (overall)
Anomaly Analyzer
Risk Level
Comprehensive Risk Evaluation
Cloud Model-based risk evaluation scheme
1 2 3 4 5 6 7 8 9 10 11 12 13 14 15 16 17 18 19 20 21 22 23 24 25 26 27 28 29 30 31 32 33 34 35 36 37 38 39 40 41 42 43 44 45 46 47 48 49 50 51 52 53 54 55 56 57 58 59 60 61 62 63 64 65
The Result of Risk evaluation
Figure.3 Cloud Computing Risk Evaluation Scheme Based on Cloud Model
1 2 3 4 5 6 7 8 9 10 11 12 13 14 15 16 17 18 19 20 21 22 23 24 25 26 27 28 29 30 31 32 33 34 35 36 37 38 39 40 41 42 43 44 45 46 47 48 49 50 51 52 53 54 55 56 57 58 59 60 61 62 63 64 65
3.1 The Process of Membership Cloud Construction 3.1.1 Model Element Definition Definition.1: Suppose U={(x1,x2,…,xm)} is the domain of discourse under research; “T” is a risk description value related to “U”; “x1,x2,…,xm” are the risk evaluation attributes of elements; “risk membership cloud” or “risk cloud” refers to the distribution of risk membership degree “CT(x1,x2,…,xm)” in a domain of discourse, and “risk cloud droplet” is the ordered pair (xi,CT(xi)) of each element and its membership degree, where i=1,2,…,m. In this paper, for the risk domain situation of complex cloud computing service environment with nodes of thousands of virtual machines, the risk prediction values of virtual machines are converged to a risk level cloud based on the theory of cloud model to objectively reflect the randomness, fuzziness and uncertainty of overall system risk, with specific processes as follows: 1) Risk levels are divided and a standard risk cloud is generated via standard Risk Cloud Generator; 2) To meet the risk evaluation requirement, the related information of virtual machine node is collected, and data are preprocessed, such as Risk (P, T, A, R) description vector and RiskAHP-RBF value as stated in the previous section; 3) The risk level vectors describing attributes are normalized and the inverse cloud generator of risk attributes is used to generate a mathematical risk cloud; 4) The risk cloud of attributes is comprehensively analyzed to get a comprehensive cloud Riskcloud; 5) The similarity degree is calculated and evaluated to obtain the risk level; 6) The overall risk level represented by current converged cloud is evaluated according to the standard risk level. 3.1.2 Forward Generator of Standard Cloud Definition.2: Suppose a series of risk clouds are preset in a system, each of which is also called a standard risk sub-cloud; and there is a definite concept which describes the risk sub-cloud and corresponds to a risk level. If the range of risk value is at an interval [0,10], which is divided into “n” sub-intervals with the ith sub-interval expressed as [Rmini, Rmaxi]. For the previously generated risk evaluation indicator “X” of virtual machine, based on the sample value (𝑥1 , 𝑥2 , 𝑥3 , … , 𝑥𝑛−1 , 𝑥𝑛 ) of the indicator “X”, the cluster analysis
1 2 3 4 5 6 7 8 9 10 11 12 13 14 15 16 17 18 19 20 21 22 23 24 25 26 27 28 29 30 31 32 33 34 35 36 37 38 39 40 41 42 43 44 45 46 47 48 49 50 51 52 53 54 55 56 57 58 59 60 61 62 63 64 65
method is used to divide the indicator into five classes, the center values of which are represented as 𝑋̅1 , ̅𝑋2 , ̅𝑋3 , ̅𝑋4 and 𝑋̅5 respectively. Hierarchical clustering method and K-mean value clustering method are frequently used methods. But hierarchical clustering method is difficult to be used for large sample, thus to avoid the difficulty, K-mean value clustering method that has higher clustering efficiency is used to classify sample data. 3.1.3 Backward Cloud Generator of Virtual Machine Attributes Definition.3: The evaluated cloud computing system has altogether “n” monitored virtual machines and 5 attributes, including 4 indicator attributes (P, T, A, R) and 1 prediction value (RiskAHP-RBF) attribute; with each virtual machine being considered as a cloud droplet, the backward cloud generation algorithm is used to generate four attribute risk clouds and one comprehensive risk cloud, and this is the backward generator of risk cloud. Since different virtual machine nodes undertake different sets of Web service functions and therefore the importance of their responses to users is somewhat different, the concept of weighted percentage is introduced to indicate the weights of different virtual machine carriers. Definition.4: The weight of a virtual machine node is equal to the ratio of the statistical number of its service interface accesses to the total number of service accesses, which is called the weighted percentage and expressed as “θ”, i.e.: 𝑀
𝜃 = ∑ 𝜆𝑖 /𝑁
(6)
𝑖=1
In the formula, N is total evaluation value and λi is relative weight of each attribute. The weight matrix of four sub-indicators is as follows: 𝑊𝐴𝐻𝑃 = (0.1861,0.2133,0.1456,0.4550)𝑇
(7)
In this paper, after adding the prediction value RiskAHP-RBF, the importance degree of risk indication is set to 0.618 according to the golden section ratio and the original weight index is multiplied with 0.4 on its original basis to get a new weight matrix: 𝑊𝐴𝐻𝑃−𝑅𝐵𝐹 = (0.07109,0.081481,0.055619,0.017381,0.618)𝑇
(8)
Since the risk indicator calculation of attributes is normalized to an interval [0, 1], the weights of service interfaces of different virtual machines can be directly calculated. Algorithm .1 Backward generation algorithm of risk cloud Input the sample point Xi (xi1, xi2,…xim) , where i =1, 2,…,n; output “m” risk clouds (TPC1, PC2, …, TPCm), with numerical characteristics being (Ex1, Ex2,…, Exm, En1, En2,…, Enm,He1 ,He2 ,…,Hem ), wherein m=5. Specific implementation process is
1 2 3 4 5 6 7 8 9 10 11 12 13 14 15 16 17 18 19 20 21 22 23 24 25 26 27 28 29 30 31 32 33 34 35 36 37 38 39 40 41 42 43 44 45 46 47 48 49 50 51 52 53 54 55 56 57 58 59 60 61 62 63 64 65
shown below: 1) Calculate the risk membership degree:
i e
2ln(1/2) i n
(9)
2) Calculate the sample average:
x1
1 n 1 1 n 1 x ( ) x … m i 1i xmi ( i ) n i 1 2 n i 1 2
(10)
3) Calculate the attribute cloud gravity center, including (P, T, A, R) indicator attributes and comprehensive attribute RiskAHP-RBF.
( Ex1 , Ex2 , , Exm ) ( x1, x2 , xm );
(11)
(4) Calculate the entropy: En1 =
1 n 1 n 2 2 … En m = (x1i -Ex1) (x mi -Ex m) n-1 i=1 n-1 i=1
(12)
(5) Calculate the standard deviation of entropy: En 'i1 =
( xi1 Ex) ( xim Ex) … En 'im = 2lni 2lni
(13)
(6) Calculate the super-entropy: He1 =
1 n 1 n ' ' 2 … ( En En ) He = 1i 1 ( Enmi' Enm' )2 m n-1 i 1 n-1 i 1
(14)
3.1.4 Comprehensive Risk Evaluation Since each attribute has different focuses, in evaluating different entities, it is required to use the numerical characteristics and corresponding weights of risk attribute clouds to calculate a new comprehensive risk cloud, as shown in the formula below:
E x Ex i i 2 E n (E ni i ) m H e (H ei i ) i 1
(15)
In the formula, m is the number of attributes and its numerical value is 5; λi is the
corresponding weight of attribute. The weight distribution is: 1 2 3 4 5 6 7 8 9 10 11 12 13 14 15 16 17 18 19 20 21 22 23 24 25 26 27 28 29 30 31 32 33 34 35 36 37 38 39 40 41 42 43 44 45 46 47 48 49 50 51 52 53 54 55 56 57 58 59 60 61 62 63 64 65
(0.017381,0.081481,0.055619,0.07109,0.618)
(16)
The numerical characteristics (Ex,En,He) of attributes can be calculated via the formula (15), which comprehensively reflect the risk of an entity; then, the similarity degree is calculated: choose the standard risk sub-cloud most similar to the comprehensive risk cloud of the entity, and the risk level of the entity is the corresponding risk grade of the standard risk sub-cloud. Definition.5: Let Risk1(Ex1, En1,He1) and Risk2(Ex2,En2,He2) be two risk clouds, and the backward generator of risk cloud is used to generate a cloud droplet (xi,ui ) from Risk1; if the membership degree of xi in the cloud Risk2 is NORM(En2,Hei2), then its mean value is called the similarity degree of Risk1 and Risk2 and expressed as δ. Algorithm.2 Similarity calculation of risk cloud With risk clouds Risk1(Ex1, En1,He1) and Risk2(Ex2,En2,He2) as input into a system, the output is similarity degree “δ”. Concrete operation process is shown below: 1) Generate a normal random number in the risk cloud Risk1, whose expectation and variance are En1 and He12 respectively: Eni’=NORM(En,He2) 2) Generate a normal random number in RISK1, whose expectation and variance are Ex1 and En1’2 respectively: xi=NORM(Ex,Eni’2) 3) Calculate:
i' e
( x Ex2 )2 2( En2 )2
4) Repeat Steps 2) and 3) until “n” normal random numbers are generated; 5) Calculate:
1 n ' i n i 1
The result is obtained according to the synthesis of five attribute clouds.
Algorithm.3 Risk evaluation algorithm based on cloud model The risk evaluation consists of the following steps, as shown in Figure 4: 1) The request for risk evaluation is received and related data are collected and
1 2 3 4 5 6 7 8 9 10 11 12 13 14 15 16 17 18 19 20 21 22 23 24 25 26 27 28 29 30 31 32 33 34 35 36 37 38 39 40 41 42 43 44 45 46 47 48 49 50 51 52 53 54 55 56 57 58 59 60 61 62 63 64 65
preprocessed for normalization. 2) The risk value is obtained through calculation. 3) The information in a rule base, where rules of risk factor coefficient setting, risk alarm mechanism, and risk level evaluation, etc., are concerned, is read, and then the weight coefficient of risk factor is calculated; specific method is to evaluate the weights of risk factors via the risk factor weight evaluation module under the guidance of the rule base information and finally calculate the risk value: n
R ( Pf , C f ) Fi i i 1
In the formula, Pf is the occurrence probability of adverse event; the consequence produced in case of adverse event is expressed as Cf; the level evaluation value of the ith risk factor is Fi; λi is the weight of the ith risk factor. 4) The analysis of anomaly: the correctness of evaluation result is analyzed. If the result is inconsistent with actual situation, the analyzing result is submitted to the rule generator, and if there is abnormal result, proceed to Step 5), otherwise go to Step 6). 5) New rules are generated using rule generator: the abnormal analysis result is submitted to the rule generator, and based on which the corresponding rules in the rule base are modified and updated. 6) Comprehensive risk evaluation: By referring to the calculated risk value and risk factor, the comprehensive evaluation is made for the risk, and then the SLA services are selected according to the QoS constraint conditions. 3.2 Cloud Computing Service Selection with QoS-constrained Risk Evaluating For the SLA-based cloud computing service, the risk prediction value of single node for virtual machine of cloud computing system is firstly calculated, and four indicators P, T, A and R are obtained and processed for normalization; then, the quantitative data of multiple nodes are converted into the qualitative conclusion by converging the risk prediction values of multiple nodes generated by backward cloud generator and the four indicator values; finally, the converged cloud is composited according to the weight matrix and then compared with standard hierarchical cloud model, and the current state of QoS service level is judged to obtain the SLA risk level evaluation, thereby performing the QoS constraint selection. 3.2.1
Uncertainty Calculation for SLA
To reduce the impact of QoS uncertainty on service selection’s reliability, the quantitative QoS values (log) is converted into qualitative SLA concepts (uncertainty level) using cloud model in this paper to calculate the uncertainty. According to the
1 2 3 4 5 6 7 8 9 10 11 12 13 14 15 16 17 18 19 20 21 22 23 24 25 26 27 28 29 30 31 32 33 34 35 36 37 38 39 40 41 42 43 44 45 46 47 48 49 50 51 52 53 54 55 56 57 58 59 60 61 62 63 64 65
degree of uncertainty, the sustained good WebService of SLA differs from unstable SLA service. Therefore, how to calculate the uncertainty of Web service and how to determine the stability of SLA service are very important topics [13]. In this paper, the backward cloud generator of cloud model is adopted. Algorithm.4 Backward cloud generator Input: Take the virtual machine of cloud computing system as a unit to construct “n” cloud droplets {𝑥1 , 𝑥2 , … , 𝑥𝑛 }. Output: 3 numerical characteristics “Ex, En and He” of “n” cloud droplets. Steps: 1 1) Based on 𝑥𝑖 , calculate the sample average 𝑋̅ = 𝑛 ∑𝑛𝑖=1 𝑥𝑖 and the sample 1 variance 𝑆 2 = 𝑛−1 ∑𝑛𝑖=1(𝑥𝑖 − 𝑋̅)2 ;
2) The expected value of web service in QoS is calculated by the formula Ex =𝑋̅; 3) The entropy of web service in QoS is calculated by the formula En = √𝜋/2 𝑁
∑𝑁 𝑖=1 |𝑥𝑖 − 𝐸𝑥|; 4) Finally, the entropy increase is obtained by 𝐻𝑒 = √𝑆 2 − 𝐸𝑛2 .
Table .1 Comparison of WebService SLA Risk Evaluation Examples Cloud computing service: S ID
Risk level
Cloud computing service: T ID
Risk level
S1
Low risk
T1
Very low risk
S2
High risk
T2
Low risk
S3
Low risk
T3
Low risk
S4
Moderate risk
T4
Moderate risk
S5
Moderate risk
T5
Low risk
S
Moderate risk
T
Low risk
Suppose there are 5 WebService accesses, S represents actual LSA risk identification indicator R, and T represents the evaluated LSA risk identification indicator R; based
1 2 3 4 5 6 7 8 9 10 11 12 13 14 15 16 17 18 19 20 21 22 23 24 25 26 27 28 29 30 31 32 33 34 35 36 37 38 39 40 41 42 43 44 45 46 47 48 49 50 51 52 53 54 55 56 57 58 59 60 61 62 63 64 65
on these indicators, it can be found that the qualitative SLA value is expressed by 5 cloud droplets, namely (s1, ,s5) or (t1, ,t5). The qualitative QoS concept (degree of uncertainty) of each service can be represented by feature vector. Then, the feature vectors of these services “S” and “T” can be calculated as follows: 𝑁𝐶𝑠 ={low risk, high risk, low risk, moderate risk, moderate risk} and 𝑁𝐶𝑇 ={very low risk, low risk, low risk, moderate risk, low risk}.Since “good” < “excellent”, the risk identification indicator R of a service “S” is less than that of a service “T”. This means that the SLA assessment value of a service “T” has good stability, while the SLA assessment value of a service “T” fluctuates greatly. So, unlike traditional methods [20,21,22], a service “T” is more suitable for being selected as a service component than a service “S”. 3.2.2
Services Selection
To apply the cloud model of WebService, the parameters 𝜆 and h are set as the threshold values of En and He according to different service environments. The service with great SLA assessment value fluctuation can be differentiated from that with stable one by the conditions “𝐸𝑛 ≤ 𝜆” and “𝐻𝑒 ≤ ℎ” respectively. For the purpose of reliable service selection, the service with the latter condition will become a preferential candidate service compared with the service with the former condition, which will guarantee that the selected service can be reliably implemented. In addition, since 𝐸𝑛 > 𝜆 and He>h, the redundant candidate services of each service class will be clipped. In this way, the cloud model facilitates the reduction both in searching space of service selection and in computation time of service combination. Since the calculation of uncertainty in service quality is independent of any individual service requirement, it does not have to be made on the required time line [23]. Accordingly, to obtain reliable candidate services, a cloud model is offline used to quicken the service selection process. After the QoS uncertainty is calculated, in each service class, the candidate services with stable QoS performance are selected [24]. Then, it is necessary to design a service selection algorithm to find the most suitable service under the global QoS constraint. Focusing only on services with stable performance, we speed up the selection process and can select reliable service. Traditional method includes genetic algorithm and mixed integer programming [25,26], and the multi-objective optimization problem is selected for services which have implemented the QoS constraint under specific conditions. To improve the real-time performance of service selection and reduce the selection delay problems caused by complex algorithm, the quick selection algorithm is adopted to implement the QoS selection based on risk evaluation control:
1 2 3 4 5 6 7 8 9 10 11 12 13 14 15 16 17 18 19 20 21 22 23 24 25 26 27 28 29 30 31 32 33 34 35 36 37 38 39 40 41 42 43 44 45 46 47 48 49 50 51 52 53 54 55 56 57 58 59 60 61 62 63 64 65
r
k
1
Q kmax
n
l
x ji j i
q k(s ji )
1 1 max
Qk
Q kmin
wk
(17)
The distribution constraint which is influenced by global constraint and also meets the judgment conditions is as follows: n l q k (s ji ) x ji C k ,1 k m j 1 i 1 l x ji 1 j 1
(18)
The calculation is made according to each user’s access request; the risk evaluation result is taken as the quick selection condition to carry out the sorting of candidate service list and these candidate services are returned to the service combination engine or service agent [28,29,30] so that users achieve quick service selection with high success rate.
4. Experiment and Results In this study, we adopt the WS-DREAM data set combined with KDD99 to simulate the service access environment where a cloud computing system operates. Each virtual machine in the system is internally installed with the risk monitoring agent, and the parameters are collected at a fixed time according to the above-mentioned AHP-RBF method and four risk indicator values and one comprehensive indicator data are calculated. The system is composed of 10 physical nodes, each of which can virtualize 5 virtual machines with identical configuration, totaling 50 virtual machine nodes. In the experiment, each data set is randomly divided into 10 service classes. The threshold values of entropy and entropy increase are set to (λ=3.8, h=5.9). QoS attribute is set to 3 and the number of QoS constraints is set to 2. The number of candidate services in each service class ranges from 10 to 100.QoS is classified according to Web Security safety level and all results are on average reported. Table .2 Risk Level Classification Risk level Very low risk
定性描
Qualitative description The risk level of cloud computing system is very good. The risk level of cloud computing system is good and the measures can be taken to further improve its
Low risk safety level on the present level basis.
1 2 3 4 5 6 7 8 9 10 11 12 13 14 15 16 17 18 19 20 21 22 23 24 25 26 27 28 29 30 31 32 33 34 35 36 37 38 39 40 41 42 43 44 45 46 47 48 49 50 51 52 53 54 55 56 57 58 59 60 61 62 63 64 65
The risk level of cloud computing system is general and it is necessary to take measures to further Moderate risk improve its safety level and enhance monitoring. The risk level of cloud computing system is poor and it is necessary to take measures to improve its High risk safety level. The risk level of cloud computing system is very poor and the risk handling measures should be Very high risk immediately taken.
4.1 Membership Cloud of Overall Risk Evaluation (1) Data Preprocessing I. Determine the risk evaluation attributes, including event indicator, performance indicator, time indicator, risk identification indicator, comprehensive indicator of risk prediction; II. Normalize all attribute values to an interval [0, 10]; III. Definition of risk interval: For the WebService security risk evaluation indicator “X”, based on its sample value (𝑥1 , 𝑥2 , 𝑥3 , … , 𝑥𝑛−1 , 𝑥𝑛 ) , the clustering analysis method is used to divide the evaluation indicator into five classes, the center values of which are set as 𝑋̅1 , 𝑋̅2 , 𝑋̅3 , 𝑋̅4 and 𝑋̅5 respectively. Hierarchical clustering method and K-mean value clustering method are frequently used methods. Hierarchical clustering method is difficult to be applied for large sample [26], while K-mean value clustering method with higher clustering efficiency can avoid such difficulties. So Kmean value clustering method is used to classify sample data, and the cluster centers corresponding to the five risk levels are obtained: Table.3 Cluster Center of Cloud Computing System Risk Level Cloud Computing Risk Level
Very Low Risk
Low Risk
Moderate Risk
High Risk
Very High Risk
Cluster center value
0.26
2.26
5.08
7.84
9.7
Based on cluster center values as well as judgment experience, the risk interval is divided into an interval [0, 1.5] (very low risk), an interval [1.5, 3.5] (low risk), an interval [3.5, 6.5] (moderate risk), an interval [6.5, 8.5] (high risk), and interval [8.5, 10] (very high risk). (2) Risk Evaluation Level Calculation
I. The standard risk sub-cloud is divided into the very low, low, moderate, high and very high risk clouds, corresponding to SRisk1 (0.26, 0.5, 0.12), SRisk2 (2.26, 0.67, 0.14), SRisk3 (5.08, 1.33, 0.25), SRisk4 (7.84, 0.67, 0.23) and SRisk5 (9.7, 0.5, 0.18). Based on the classified sample data, the backward cloud algorithm is used to calculate the numerical characteristics of clouds in five class concepts. Table .4 Numerical Characteristics of Cloud Computing System Risk Cloud Cloud Computing Risk
Very Low
Level
Risk
Expectation (EX)
0.26
2.26
5.08
7.84
9.7
Entropy (En)
0.5
0.67
1.33
0.67
0.5
Super-entropy (He)
0.12
0.14
0.25
0.23
0.18
Low Risk
Middle Risk
High Risk
Very High Risk
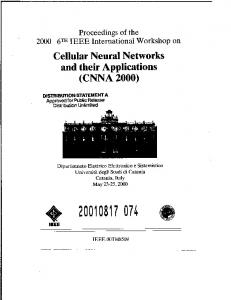
According to the numerical characteristics of clouds, the forward cloud algorithm is used to obtain the subordinate cloud functions of various class concepts, as shown in Figure 4: Lowest
Low
Middle
High
Highest
subordinated degree
1 2 3 4 5 6 7 8 9 10 11 12 13 14 15 16 17 18 19 20 21 22 23 24 25 26 27 28 29 30 31 32 33 34 35 36 37 38 39 40 41 42 43 44 45 46 47 48 49 50 51 52 53 54 55 56 57 58 59 60 61 62 63 64 65
Risk Value
Figure.4 Subordinate Cloud Chart for WebService Security II. Algorithm 2 is used to generate the attribute cloud from the preprocessed data. III. The attribute cloud is incorporated into the comprehensive evaluation cloud RISK(5.5, 1, 0.4), and the comparison of comprehensive evaluation cloud with standard risk cloud is shown in the figure below:
Lowest
Low
Middle
High
Very High
subordinated degree
1 2 3 4 5 6 7 8 9 10 11 12 13 14 15 16 17 18 19 20 21 22 23 24 25 26 27 28 29 30 31 32 33 34 35 36 37 38 39 40 41 42 43 44 45 46 47 48 49 50 51 52 53 54 55 56 57 58 59 60 61 62 63 64 65
Risk Value
Figure.5 Comparison of Comprehensive Cloud with Standard Cloud IV. The low risk value interval is [3.5, 6.5], and based on the location of distributed risk cloud droplets, the cloud droplets at the low risk and above account for 90% of total cloud droplets and the risk value is calculated to be ‘5.82’. 4.2 Analysis of Independent Indicator Moreover, four risk indicators (virtual machine performance indicator P, virtual machine time indicator T, alarm log indicator A, LSA risk identification indicator R) are matched with SLA subordinate cloud risks, and the actual distribution is shown in the figure below:
(a) Virtual Machine Performance Indicator P
(b) Virtual Machine Time Indicator T
1 2 3 4 5 6 7 8 9 10 11 12 13 14 15 16 17 18 19 20 21 22 23 24 25 26 27 28 29 30 31 32 33 34 35 36 37 38 39 40 41 42 43 44 45 46 47 48 49 50 51 52 53 54 55 56 57 58 59 60 61 62 63 64 65
(c) Alarm Log Indicator A
(d) LSA Risk Identification Indicator R
Figure.6 Membership Clouds of the Four Indicators Experimental results show that: the higher dispersion degree is, the more uncertainties of SLA risk evaluation exist; among 4 comprehensive QoS attribute values (virtual machine performance indicator P, virtual machine time indicator T, alarm log indicator A and LSA risk identification indicator R) with weighted mean calculation, the dispersion degree of virtual machine performance indicator is greatest; the risk evaluation uncertainty is highest and the SLA risk level is not most easily divided, and the dispersion degree of SLA risk identification indicator R is least; the risk evaluation uncertainty is smallest and the SLA risk level is most easily divided. 4.3 Comparative Result of Service Selection In this study, the test is conducted based on the public QoS service test data set WSDREAM, which contains about 1.5 million Web service call records used by 150 service users in 24 countries and regions. Three QoS attribute values (i.e. response time, response data size and failure probability) are collected from 10,258 Web services used by 150 service users. The second data set is a randomly generated data set (named RG) and also contains three QoS attribute values of 10,000 web services. In the experiment, each data set is randomly divided into 10 service classes. The threshold values of entropy and entropy increase are set to (λ=3.8, h=5.9).QoS attribute is set to 3 and the number of QoS constraints is set to 2.The number of candidate services in each service class ranges from 10 to 100. A threshold value is set for risk evaluation level, and a service selection with high risk service threshold value is cancelled and turned to an eligible service in other region. With a QoS (risk level, confidence level, price, region constraint, service response time, error rate)[31], taking risk level as a preferential constraint condition can simplify the multi-objective optimization problem with QoS constraint and remove a lot of service regions in noncompliance with risk control to realize the quick service selection.
1 2 3 4 5 6 7 8 9 10 11 12 13 14 15 16 17 18 19 20 21 22 23 24 25 26 27 28 29 30 31 32 33 34 35 36 37 38 39 40 41 42 43 44 45 46 47 48 49 50 51 52 53 54 55 56 57 58 59 60 61 62 63 64 65
Risk constraint
Figure.7 Comparison of Risk Constraint Method and LRU in Service Selection Success Rate As shown above, the LRU latest access scheduling principle that has been frequently used by cloud computing service providers is adopted to compare the service selection [32] . When an access point is busy, especially when it is suffering a DDos attack, the LRU method will evidently result in bigger access failure rate. The horizontal axis represents that 100~1000 continuous requests are initiated in each round of tests. The LRU method is compared with the MAIS method referred to in literature [15], and the latter is widely used for benchmark test comparison in service selection. But due to its complicated calculation, MAIS method is not suitable for quick service selection in the actual cloud computing application context. The test results are given as follows:
1 2 3 4 5 6 7 8 9 10 11 12 13 14 15 16 17 18 19 20 21 22 23 24 25 26 27 28 29 30 31 32 33 34 35 36 37 38 39 40 41 42 43 44 45 46 47 48 49 50 51 52 53 54 55 56 57 58 59 60 61 62 63 64 65
Risk constraint
Figure.8 Comparison of Risk Constraint Method and MAIS Method in Service Selection Success Rate
Through comparison, we find out that the risk constraint method has obvious advantages over traditional methods in terms of service selection success rate and selection speed [33,34,35]. This is because risk evaluation itself contains such information, including node load of the cloud computing system, service response capability, risk degree, etc. and particularly, the risk identification indicator and comprehensive risk prediction indicator can reflect the system’s security state more accurately in a DDoS environment [36]. With these as the constraint conditions of QoS service selection and the bases of SLA cross-domain service selection, it has referential value for a system to provide more stable and high-quality service [37].
5. Conclusions The strategy of SLA-based cloud computing service selection is discussed in detail, and the constraint conditions of risk evaluation are introduced for the QoS constraint model of cloud computing service selection. The cloud theory is adopted for uncertainty evaluation; the cloud theory-related concept and principles, the numerical feature representation of cloud and the generation algorithms of cloud generator and backward cloud generator are introduced; and then a membership degree division method of independent attributes (P, T, A, R) based on cloud theory and the cloud model construction method of comprehensive attribute RiskAHP-RBF are proposed. By constructing a sample cloud model, which is further compared with actual cloud, the overall risk level judgment of cloud computing system is obtained. Finally, according
1 2 3 4 5 6 7 8 9 10 11 12 13 14 15 16 17 18 19 20 21 22 23 24 25 26 27 28 29 30 31 32 33 34 35 36 37 38 39 40 41 42 43 44 45 46 47 48 49 50 51 52 53 54 55 56 57 58 59 60 61 62 63 64 65
the cloud model theory, the QoS membership degree risk of intrusion detection data is divided and the methods are used to perform the QoS constraint selection of WebService to improve evaluation performance.
6.References [1] Garg Saurabh Kumar; Toosi Adel Nadjaran;Gopalaiyengar Srinivasa K.;Buyya Rajkumar, SLAbased virtual machine management for heterogeneous workloads in a cloud datacenter, JOURNAL OF NETWORK AND COMPUTER APPLICATIONS, OCT 2014, Vol.45, pp(108-120), DOI(10.1016/j.jnca.2014.07.030) [2] Emeakaroha Vincent C.; Netto Marco A. S.;Calheiros Rodrigo N.;Brandic Ivona;Buyya Rajkumar;De Rose Cesar A. F., Towards autonomic detection of SLA violations in Cloud infrastructures,FUTURE GENERATION COMPUTER SYSTEMS-THE INTERNATIONAL JOURNAL OF GRID COMPUTING AND ESCIENCE, Vol 28,Issue 7,pp(1017-1029),JUL 2012,DOI(10.1016/j.future.2011.08.018) [3] Feng Liu, Zhenming Lei, Research on user-aware QoS based Web services composition. The Journal of China Universities of Posts and Telecommunications,2009,16(5):125~130. [4] Zhang Haiteng; Shao Zhiqing; Zheng Hong; Zhai Jie, Web Service Reputation Evaluation Based on QoS Measurement, SCIENTIFIC WORLD JOURNAL , 2014, DOI(10.1155/2014/373902) [5] Sioutas S.;Sakkopoulos E.;Makris Ch.;Vassiliadis B.;Tsakalidis A.;Triantafillou P., Dynamic Web Service discovery architecture based on a novel peer based overlay network, Journal of Systems and Software[J],2009, 82(5): 809~824, DOI(10.1016/j.jss.2008.11.845). [6] Satish Nill;Wahidabanu R. S. D.,Towards Context Aware QOS-Based Web Service Description and Discovery, JOURNAL OF INTERNET TECHNOLOGY, Vol 14 ,Issue 4 , pp(673-686),JUL 2013,DOI(10.6138/JIT.2013.14.4.12) [7] Yan Guofeng; Peng Yuxing; Chen Shuhong; You Pengfei , QoS Evaluation of End-to-End Services in Virtualized Computing Environments: A Stochastic Model Approach , International Journal of Web Services Research , Vol 12, Issue 1, pp(27-44),MAR 2015,DOI(10.4018/IJWSR.2015010103) [8] Hao Yanan;Zhang Yanchun;Cao Jinli, A novel QoS model and computation framework in web service selection ,WORLD WIDE WEB-INTERNET AND WEB INFORMATION SYSTEMS, Vol 15, Issue 5-6, pp(663-684) , SEP 2012,DOI(0.1007/s11280-012-0157-5) [9] Habich Dirk; Lehner Wolfgang; Richly Sebastian; Assmann Uwe, Using Cloud Technologies to Optimize Data-Intensive Service Applications, 3rd IEEE International Conference on Cloud Computing(CLOUD 2010), 2010, pp.19-26. [10]Goscinski Andrzej; Brock Michael, "Toward dynamic and attribute based publication, discovery and selection for cloud computing, Future Generation Computer Systems, vol. 26, pp. 947-970, July 2010, DOI(10.1016/j.future.2010.03.009). [11] Cardellini Valeria;Casalicchio Emiliano;Grassi Vincenzo;Lo Presti Francesco, Flow-Based Service Selection for WebService Composition Supporting Multiple QoS Classes, 2007 IEEE International Conference on Web Services, Proceedings (ICWS 2007), 2007, pp. 743-750. [12] Jula Amin;Sundararajan Elankovan;Othman Zalinda, Cloud computing service composition: A
1 2 3 4 5 6 7 8 9 10 11 12 13 14 15 16 17 18 19 20 21 22 23 24 25 26 27 28 29 30 31 32 33 34 35 36 37 38 39 40 41 42 43 44 45 46 47 48 49 50 51 52 53 54 55 56 57 58 59 60 61 62 63 64 65
systematic literature review, EXPERT SYSTEMS WITH APPLICATIONS, Issue 8, Vol 41,pp(3809-3824),JUN 2014, DOI(10.1016/j.eswa.2013.12.017). [13] Zadeh Lotfi A., Is there a need for fuzzy logic?, INFORMATION SCIENCES, Issue 13, Vol 178, pp(2751-2779), JUL 2008,DOI(10.1016/j.ins.2008.02.012). [14]Li Deyi; Liu Changyu; Gan Wenyan, A New Cognitive Model: Cloud Model, INTERNATIONAL JOURNAL OF INTELLIGENT SYSTEMS, Vol 24, Issue 3, pp (357-375), MAR 2009, DOI (10.1002/int.20340) [15]Yang Chao-Hui; Li De-Yi, PLANAR MODEL AND ITS APPLICATION IN PREDICTION [J]. CHINESE J.COMPUTERS, 1998, 21(11): 961-969. [16] Yu Qi; Bouguettaya Athman, Computing Service Skyline from Uncertain QoWS, IEEE Transactions on Services Computing, Issue 1,Vol. 3, pp(16-29), JAN-MAR 2010, DOI(10.1109/TSC.2010.7). [17] Zheng Zibin;Zhang Yilei;Lyu Michael R., CloudRank: A QoS-Driven Component Ranking Framework for Cloud Computing, 2010 29TH IEEE INTERNATIONAL SYMPOSIUM ON RELIABLE DISTRIBUTED SYSTEMS (SRDS 2010), pp(184193),2010,DOI( 10.1109/SRDS.2010.29). [18] Zheng Zibin;Zhou Tom Chao;Lyu Michael R.;King Irwin, Component Ranking for FaultTolerant Cloud Applications ,IEEE TRANSACTIONS ON SERVICES COMPUTING ,Issue 4,Vol 5,pp(540-550),OCT-DEC 2012,DOI(10.1109/TSC.2011.42 ) [19] Ardagna Danilo; Pernici Barbara, Adaptive service composition in flexible processes, IEEE Transactions on Software Engineering, Issue 6, vol 33, pp.(369-384), Jun 2007, DOI(10.1109/TSE.2007.1011). [20] Liu Zhi Zhong;Jia Zong Pu;Xue Xiao;An Ji Yu ,Reliable Web service composition based on QoS dynamic prediction ,SOFT COMPUTING ,Issue 5,Vol 19,pp(1409-1425),May 2015,DOI(10.1007/s00500-014-1351-4). [21] Haak Steffen; Weinhardt Christof,Optimizing customized services: efficient computation in large Service Value Networks ,INFORMATION SYSTEMS AND E-BUSINESS MANAGEMENT, Issue 3,Vol 12,pp(307-335),Aug 2014,DOI(10.1007/s10257-013-0218-z). [22] Alrifai Mohammad;Risse Thomas,Efficient QoS-aware Service Composition ,EMERGING WEB SERVICES TECHNOLOGY VOL III ,3rd Workshop on Emerging Web Services Technology/6th European Conference on Web Services, Vol 3,pp(75-87),2009. [23] Wu Jian;Chen Liang;Liang Tingting ,Selecting Dynamic Skyline Services for QoS-based Service Composition ,APPLIED MATHEMATICS & INFORMATION SCIENCES, Issue 5, Vol 8,Sep 2014. [24] Salimi Arash Jodeiri;Isazadeh Ayaz;Karimpour Jaber, Admission Control for WebServices in Enterprise Systems Using Expert Systems ,WEB INFORMATION SYSTEMS AND MINING(PT I) ,International Conference on Web Information Systems and Mining (WISM 2011) ,Vol 6987,pp(192-199),2011. [25] Selcuk K.;Li Wen-Syan;Phan Thomas;Zhou Minqi, Frontiers in Information and Software as Services ,ICDE: 2009 IEEE 25TH INTERNATIONAL CONFERENCE ON DATA ENGINEERING(VOLS 1-3) ,pp(1761-1768),2009. [26] Ghezzi Carlo;La Manna Valerio Panzica;Motta Alfredo;Tamburrelli Giordano,Performancedriven dynamic service selection, CONCURRENCY AND COMPUTATION-PRACTICE & EXPERIENCE, Issue 3, Vol 27,pp(633-650),Mar 2015,DOI(10.1002/cpe.3259).
1 2 3 4 5 6 7 8 9 10 11 12 13 14 15 16 17 18 19 20 21 22 23 24 25 26 27 28 29 30 31 32 33 34 35 36 37 38 39 40 41 42 43 44 45 46 47 48 49 50 51 52 53 54 55 56 57 58 59 60 61 62 63 64 65
[27]Li D; Cheung David; Shi XM ; Ng Vincent, Uncertainty reasoning based on cloud models in controllers, Computers & Mathematics with Applications, Issue 3,Vol 35, pp(99-123), Feb 1998, DOI(10.1016/S0898-1221(97)00282-4). [28] Zheng Zibin; Lyu Michae, Collaborative reliability prediction of service-oriented systems, 32nd ACM/IEEE International Conference on Software Engineering(ICSE 2010), pp(35-44), May 2010. [29] Son Seokho; Jung Gihun; Jun Sung Chan, An SLA-based cloud computing that facilitates resource allocation in the distributed data centers of a cloud provider, JOURNAL OF SUPERCOMPUTING ,Issue 2,Vol 64,pp(606-637),May 2013,DOI(10.1007/s11227-012-0861-z). [30] Emeakaroha Vincent C.; Brandic Ivona; Maurer Michael; Dustdar Schahram, Cloud resource provisioning and SLA enforcement via LoM2HiS framework ,CONCURRENCY AND COMPUTATION-PRACTICE & EXPERIENCE ,Issue 10,Vol 25,pp(1462-1481),Jul 2013, DOI(10.1002/cpe.2944) . [31] Zhang Chengwen; Su Sen; Chen Junliang, GAMi: Genetic algorithm-based middleware for QoS-aware web services selection ,CHINESE JOURNAL OF ELECTRONICS ,Issue 3, Vol 16, pp(537-542), Jul 2007 [32] Lin Chia-Feng;Sheu Ruey-Kai;Chang Yue-Shan;Yuan Shyan-Ming, A relaxable service selection algorithm for QoS-based web service composition ,INFORMATION AND SOFTWARE TECHNOLOGY ,Issue 12, Vol 53 ,pp(1370-1381), Dec 2011, DOI(10.1016/j.infsof.2011.06.010). [33] Sioutas S.; Sakkopoulos E.;Makris Ch.;Vassiliadis B.;Tsakalidis A.;Triantafillou P.. Dynamic Web Service discovery architecture based on a novel peer based overlay network, Journal of Systems and Software, Issue 5, Vol 82, pp( 809-824),May 2009, DOI(10.1016/j.jss.2008.11.845). [34] Kritikos Kyriakos; Plexousakis Dimitris, Requirements for QoS-Based Web Service Description and Discovery, IEEE TRANSACTIONS ON SERVICES COMPUTING, Vol 2,Issue 4, pp(320-337), DEC 2009 , DOI(10.1109/TSC.2009.26) [35] Xia Yunni;Zhou MengChu;Luo Xin;Zhu Qingsheng;Li Jia;Huang Yu, Stochastic Modeling and Quality Evaluation of Infrastructure-as-a-Service Clouds ,IEEE TRANSACTIONS ON AUTOMATION SCIENCE AND ENGINEERING ,Issue 1, Vol 12, pp(162-170), Jan 2015, DOI(10.1109/TASE.2013.2276477). [36] Mao Chengying;Chen Jifu;Towey Dave;Chen Jinfu;Xie Xiaoyuan, Search-based QoS ranking prediction for web services in cloud environments , FUTURE GENERATION COMPUTER SYSTEMS-THE INTERNATIONAL JOURNAL OF GRID COMPUTING AND ESCIENCE, Vol 50, pp(111-126), Sep 2015, DOI(10.1016/j.future.2015.01.008). [37] Wang Dandan;Yang Yang;Mi Zhenqiang ,QoS-Based and Network-Aware Web Service Composition across Cloud Datacenters, KSII TRANSACTIONS ON INTERNET AND INFORMATION SYSTEMS,Vol 9,Issue 3, pp(971-989), MAR 2015, DOI(10.3837/tiis.2015.03.008).