NeuroImage 101 (2014) 653–666
Contents lists available at ScienceDirect
NeuroImage journal homepage: www.elsevier.com/locate/ynimg
Neural correlates of language and non-language visuospatial processing in adolescents with reading disability Joshua John Diehl a,b,⁎, Stephen J. Frost b, Gordon Sherman c, W. Einar Mencl b, Anish Kurian b,d, Peter Molfese b, Nicole Landi b, Jonathan Preston b, Anja Soldan e, Robert K. Fulbright b,f, Jay G. Rueckl b,d, Mark S. Seidenberg b,g, Fumiko Hoeft b,h, Kenneth R. Pugh b,d a
Department of Psychology, 118 Haggar Hall, University of Notre Dame, Notre Dame, IN 46556, USA Haskins Laboratories, 300 George St., Suite 900, New Haven, CT 06511, USA c Newgrange School, 407 Nassau St., Princeton, NJ 08540, USA d Department of Psychology, 406 Babbidge Road, Unit 1020, University of Connecticut, Storrs, CT 06269-1020, USA e Department of Neurology, Division of Cognitive Neuroscience, Johns Hopkins School of Medicine, Baltimore, MD, USA f Department of Radiology, Yale University School of Medicine, MRRC, The Anlyan Center N137, P.O. Box 208043, New Haven, CT 06520-8043, USA g Department of Psychology, Brogden Hall, 1202W. Johnsons St., University of Wisconsin, Madison, WI 53706-1969, USA h Department of Psychiatry, University of California, Langley Porter Psychiatry Institute (LPPI), Langley Porter Psychiatric Hospital and Clinics (LPPHC), 401 Parnassus Avenue, San Francisco, CA 94143, USA b
a r t i c l e
i n f o
Article history: Accepted 18 July 2014 Available online 24 July 2014 Keywords: Reading Dyslexia fMRI Visuospatial processing Impossible figures
a b s t r a c t Despite anecdotal evidence of relative visuospatial processing strengths in individuals with reading disability (RD), only a few studies have assessed the presence or the extent of these putative strengths. The current study examined the cognitive and neural bases of visuospatial processing abilities in adolescents with RD relative to typically developing (TD) peers. Using both cognitive tasks and functional magnetic resonance imaging (fMRI) we contrasted printed word recognition with non-language visuospatial processing tasks. Behaviorally, lower reading skill was related to a visuospatial processing advantage (shorter latencies and equivalent accuracy) on a geometric figure processing task, similar to findings shown in two published studies. FMRI analyses revealed key group by task interactions in patterns of cortical and subcortical activation, particularly in frontostriatal networks, and in the distributions of right and left hemisphere activation on the two tasks. The results are discussed in terms of a possible neural tradeoff in visuospatial processing in RD. © 2014 Elsevier Inc. All rights reserved.
Introduction Reading disability (RD) has been characterized as a brain-based neurodevelopmental disorder associated with a failure to acquire fluent reading skills (e.g., Landi et al., 2013; Vellutino et al., 2004). There is a large body of research indicating that language deficits, particularly at the phonological level, underlie many reading difficulties (Lyon et al., 2003; Shankweiler et al., 1995). Moreover, evidence from studies of the neurobiology of reading supports the foundational role of left hemisphere language networks for the development of fluent reading skills (Diehl et al., 2011; Pugh et al., 2005) with relative anomaly in ⁎ Corresponding author at: Department of Psychology, 118 Haggar Hall, University of Notre Dame, Notre Dame, IN 46556, USA. Fax: +1 574 631 8883. E-mail addresses:
[email protected] (J.J. Diehl),
[email protected] (S.J. Frost),
[email protected] (G. Sherman),
[email protected] (W.E. Mencl),
[email protected] (A. Kurian),
[email protected] (P. Molfese),
[email protected] (N. Landi),
[email protected] (J. Preston),
[email protected] (A. Soldan),
[email protected] (R.K. Fulbright),
[email protected] (J.G. Rueckl),
[email protected] (M.S. Seidenberg),
[email protected] (F. Hoeft),
[email protected] (K.R. Pugh).
http://dx.doi.org/10.1016/j.neuroimage.2014.07.029 1053-8119/© 2014 Elsevier Inc. All rights reserved.
RD in comparison to typically-developing (TD) readers across these networks (Pugh et al., 2010). Although much of the previous research on RD has focused on the neurocognitive basis of phonological deficits (Vellutino et al., 2004), there remains interest in the potential contributions of visual processing abilities to reading and its disorders (Demb et al., 1998; Eden et al., 1996; Stein, 2001, 2003; Vidyasagar, 2013). With regard to visual processing and RD, difficulties with some aspects of visuospatial processing have been reported, including: 1) visuospatial attention (Facoetti et al., 2010; Vidyasagar and Pammer, 2010; Vidyasagar, 2013); 2) motion processing, thought to arise from an abnormal magnocellular system (Demb et al., 1998; Eden et al., 1996; Stein, 2001); and 3) perceptual signal-to-noise attentional mechanisms that impact the quality of sensory processing not only for vision, but for auditory processing as well (e.g., Sperling et al., 2004, 2006). While deficits have been the general focus, paradoxically there have been several reports suggesting relative strengths in RD for certain non-language visuospatial processing tasks including configural processing and visuospatial cue learning (Howard et al., 2006; Schneps et al., 2012; von Károlyi, 2001; von Károlyi et al., 2003). If such advantages do indeed exist for some tasks,
654
J.J. Diehl et al. / NeuroImage 101 (2014) 653–666
this might be taken to argue against a global visual processing deficit in RD and could reflect a type of tradeoff between reading and other visual processes. At present this issue has received very little attention in neurocognitive studies (but see Gilger et al., 2013; Gilger and Hynd, 2008; Olulade et al., 2012). Current neurocognitive theories are generally aimed at accounting for patterns of deficits that present in RD children, whether phonological (e.g., Fowler and Swainson, 2004; Goswami and Ziegler, 2006), visual (e.g., Stein, 2001), auditory (Gaab et al., 2007; Goswami et al., 2002), attentional (Facoetti et al., 2010; Ziegler et al., 2009), or involving domain general procedural learning mechanisms (Nicolson and Fawcett, 2007). No current theory, to our knowledge, directly predicts RD processing advantages in any domain, visuospatial or otherwise; though, at a more general level, we note that Geschwind and Galaburda (1987) did propose the existence of a “pathology of superiority,” where a predisposition to the neural deficits specific to reading could lead other areas of the brain to compensate for these deficits. Recent neurobiological studies have also suggested that individuals with RD use different neural networks to process visual stimuli (Olulade et al., 2012) and that strengths could be related to compensation for reading difficulties (Gilger et al., 2013). In any event, if relative advantages are found, all current major theories would be challenged to provide an account of these advantages. Cognitive research on enhanced visuospatial processing in individuals with RD Anecdotal reports and historical characterizations of RD have long been taken to suggest that some individuals with RD appear to have pronounced strengths in some kinds of visuospatial processing tasks. Prevalence estimates of children who are both gifted and learning disabled vary widely, with some estimates as high as 2–5% of schoolage children, although prevalence estimates on these populations are plagued by varying definitions of giftedness and learning disability (Davis and Rimm, 1985; McCallum et al., 2013; Nielson, 2002; Ruben and Reis, 2005). Several groups have asserted that there are higher rates of individuals with RD in professions where certain visuospatial skills are at a premium, such as art, architecture, engineering, and mechanics (Winner et al., 1991; Winner and Casey, 1993; Winner, 2000; Wolff and Lundberg, 2002). More recently, it has been suggested that genetic factors (although poorly understood currently) might undergird tradeoffs in individuals with superior nonverbal IQ and language/reading-based deficits, or “twice-exceptional” individuals (Craggs et al., 2006; Gilger et al., 2013). Findings across controlled experimental studies that attempted to identify visuospatial processing strengths in the cognitive profiles of individuals with RD have been decidedly mixed (Diehl et al., 2011; Gilger et al., 2013). Thus, some studies looking at non-language visuospatial tasks have reported that individuals with RD have some superior abilities (Bannatyne, 1971; Howard et al., 2006; Rugel, 1974; Swanson, 1984; Schneps et al., 2012; von Károlyi et al., 2003; von Károlyi, 2001), others find comparable abilities (Bacon et al., 2007; Koenig et al., 1991; Rudel and Denckla, 1976; Rugel, 1974; Siegel and Ryan, 1989; Sinatra, 1988; Smith et al., 1977; Winner et al., 2001), while others have suggested diminished skills (Bacon et al., 2007; Bannatyne, 1971; Benton, 1984; Eden et al., 1995; Johnston and Weismer, 1983; Morris et al., 1998; Naidoo, 1972; Rourke, 1985). Even when examined from the point of view of a single common neurocognitive task that has been used on several different samples (mental rotation; Vandenberg and Kuse, 1978), findings for that single test have been inconsistent (e.g., Olulade et al., 2012; Winner et al., 2001). Of course, all of these studies differ in important regards, including the specific tasks/skills studied and the criteria applied in defining RD; as such, direct comparisons are difficult. There are also methodological concerns related to studies that have found processing advantages (Winner et al., 2001). Clearly, more controlled cognitive research is needed to answer these questions, and it has been argued that neuroimaging might yield unique
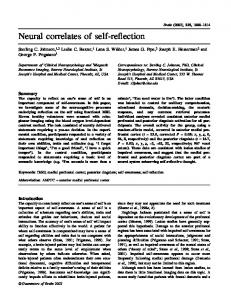
insights into this complex question by directly examining brain pathways for reading and language relative to other visuospatial skills (Gilger and Hynd, 2008). Recent research on implicit visuospatial learning in individuals with RD has suggested a possible visuospatial processing strength. Howard et al. (2006) found that adults with RD actually showed advantages relative to typically developing (TD) peers on a visuospatial cue learning task but impaired learning on a non-visuospatial sequential serial reaction time (SRT) task. Correlational analyses indicated that performance on cue learning was negatively correlated with reading skills, whereas SRT learning was positively correlated with reading skills (it should be noted that several other studies have also reported deficits on sequence learning tasks (Szmalec et al., 2011; Stoodley et al., 2006)). Thus, while implicit sequence learning, a type of procedural learning thought to be dependent on frontostriatal networks (e.g., Jenkins et al., 1994; Thomas et al., 2004; Willingham et al., 2002) has been shown to be deficient in RD (Howard et al., 2006), implicit learning for configural visuospatial patterns (thought to be medial temporal lobe dependent; Preston and Gabrieli, 2008) is not only spared, but also could be a relative strength in RD (Howard et al., 2006). Two other studies recently reported that children with RD show relative processing advantages in another non-language visuospatial configural processing task (von Károlyi, 2001; von Károlyi et al., 2003) and these directly motivated the current report. von Károlyi (2001) used stimuli that could potentially be viewed as 3-D (called possible and impossible figures; Carrasco and Seamon, 1996; Schacter et al., 1990). During the task participants needed to quickly determine whether or not a stimulus (see Fig. 1) could exist in a 3-D space (possible, see Fig. 1a) or not (impossible, see Fig. 1b). This task (hereafter referred to as the impossible figures task) requires the ability to see the gestalt of a figure quickly in order to get it to “pop out” of the page in 3-D. von Károlyi (2001) found that RD readers were reliably faster at this task but comparable on accuracy (suggesting that the latency advantage did not simply reflect a speed/accuracy tradeoff). These findings were later replicated by the same authors with a second, independent sample (von Károlyi et al., 2003); given the replication study, we employed the impossible figures tasks in the current neuroimaging report. It is important to note that both studies had small effect sizes, and the TD comparison groups had slightly (but not significantly) higher accuracy scores. Still, given that individuals with RD are often slower at processing tasks (e.g., Wolf et al., 2000), findings that show enhanced speed in RD without an accuracy tradeoff are intriguing. Why should there be an RD advantage on this type of task? Von Károlyi and colleagues hypothesized that this relative strength might be related to a global configural processing bias, as the ability to recognize possible figures is thought to be related to this process (e.g., Schacter, 1992). Other studies have also reported the presence of a global bias for processing in individuals with RD, meaning that individuals with RD seem to display a bias toward processing the gestalt over an image's parts, although data from these studies indicate that this bias is similar to the one shown by TD peers (Keen and Lovegrove, 2000; Matthews and Martin, 2009); this bias could, in principle, account for latency advantages in the impossible figures task. Is there a neural signature for reading vs. visuospatial processing tradeoffs? An extensive literature attests to the claim that language processing is typically left hemisphere (LH) dominant, whereas the right hemisphere (RH) systems plays a relatively heightened role for many aspects of non-language visuospatial processing (e.g., Hellige, 1996; Hellige and Michimata, 1989; Pallier et al., 2011). With respect to brain organization for reading, neuroimaging studies have found that TD readers develop a largely LH organized neurocircuity for print with inferior frontal, temporoparietal and occipitotemporal components (Pugh et al., 2000a, 2000b). Individuals with RD exhibit reduced activation (and functional connectivity) across LH posterior networks (see Richlan
J.J. Diehl et al. / NeuroImage 101 (2014) 653–666
655
the current fMRI study will be important in providing a first test of this hypothesis. Purpose of this study
Fig. 1. Examples of possible and impossible figures. Panel (a) is a representation of a “possible” figure. Lines connect in a manner that give the viewer the impression that it has depth; therefore, it is possible that it could exist as a three dimensional object. Panel (b) is a representation of an “impossible” figure. Lines do not connect in a way that depth is perceivable; therefore, it is impossible for this object to have a three dimensional equivalent.
et al., 2009, 2011, for a meta-analysis), and for many tasks show greater RH activation; these heightened RH responses have been argued to reflect compensatory processing in light of LH anomalies for phonological processing (Horwitz et al., 1998; Pugh et al., 2000b; Rippon and Brunswick, 2000; Shaywitz et al., 2003; Simos et al., 2002). At the level of neuroanatomy, some studies have reported a reversal of asymmetry (RH larger than LH) in the planum temporale in individuals with RD, although the evidence for this is somewhat mixed (Geschwind and Levitsky, 1968; Hynd et al., 1990; Larsen et al., 1990; Rumsey et al., 1997; Schultz et al., 1994). Reduced gray and white matter development in LH regions for RD readers has also been frequently reported (e.g., Beaulieu et al., 2005; Deutsch et al., 2005; Eckert, 2004; Keller and Just, 2009; Klingberg et al., 2000; Niogi and McCandliss, 2006; Richards et al., 2008; Rollins et al., 2009). Hemispheric differences in TD and RD for reading might suggest a possible mechanism for the language/non-language visuospatial tradeoff under consideration in this study. Thus, to the extent that RH systems dominate in individuals with RD we might see relative deficits in language and a potential advantage for visuospatial processing (cf. Craggs et al., 2006). Alternatively, the lack of LH specialization for reading in RD might allow greater contributions from LH networks to configural processing and thus the reported advantage. However, to date these kinds of tradeoffs have not been documented in RD, and
Although there is anecdotal and some experimental evidence for possibly enhanced non-language visuospatial processing in individuals with RD, research findings in this area have been limited, and current neurocognitive RD theories tend to focus almost exclusively on well-established processing deficits. This study aims to provide both a cognitive and neurobiological investigation of whether strengths in non-language visuospatial tasks do exist and, if they do, to explore the brain-basis of the dissociation between reading and other tasks. We can begin to address questions such as whether individuals with RD show a tendency or a preference to process information globally rather than relying on feature-based processing, whether individuals with RD may advantageously use contextual features to aid in areas of processing that are otherwise hard for them, and whether there are differences between RD and TD readers in hemispheric lateralization that might underlie visuospatial processing tradeoffs. More specifically, to precisely characterize relative strengths in different aspects of visuospatial processing and reading, we administered a standard behavioral battery of reading measures as well as the impossible figures and two other frequently employed non-language visuospatial tasks (mental rotation, Navon global/local processing; Navon hierarchical stimuli; Navon, 1977). Mental rotation was chosen because it has been used in multiple RD studies in the past (e.g., Olulade et al., 2012; Winner et al., 2001), whereas the Navon task is a common measure of the global-local processing differences (e.g., Behrmann and Kimchi, 2003; Fink et al., 1997; Matthews and Martin, 2009, among many others) that have been hypothesized by von Károlyi and colleagues as one possible explanation for putative visual processing strengths in the impossible figures task. In a subset of these participants, we then adapted the impossible figures paradigm that has shown RD advantages in two previous published studies (von Károlyi, 2001; von Károlyi et al., 2003) to be used during functional magnetic resonance imaging (fMRI) data, along with a visual lexical decision paradigm for printed words and pseudowords to examine the neurobiological signatures of each and how these tasks might interact with reading skill as assessed behaviorally. We also employed a simple one-back fMRI control task with figures vs. words in order to assess TD/RD differences when task is held constant but stimulus type varies. Method Participants Fifty-three participants with reading abilities ranging from RD to superior reading enrolled in the study (see Table 1 for descriptive characteristics of the sample). A subsample of 27 participants was recruited for the fMRI portion of the study. These participants were recruited specifically because they did or did not report having an RD in order to create two separate groups (RD and TD). These participants completed a diagnostic battery and a series of cognitive tasks, and a subset of this group (21 participants) was selected (as described below) to return to participate in the fMRI portion of the study. An additional 26 participants were recruited to provide a larger sample of data on our behavioral tasks. These participants were not recruited based on group (TD or RD) membership: they represented a spectrum of reading abilities. The six participants who completed behavioral testing but were not selected for the fMRI portion of the study were still included in the data for the cognitive tasks. All participants were recruited from the community using public advertisements, and from existing laboratory databases of families who had indicated an interest in participating in future studies. For the core cognitive tasks we obtained behavioral data for all participants for the Navon task, for 49
656
J.J. Diehl et al. / NeuroImage 101 (2014) 653–666
Table 1 Descriptive characteristics of samples used for the in-scanner and out-of-scanner tasks. Behavioral data sample
fMRI data sample
Group M (SD) [range]
RD M (SD) [range]
TD M (SD) [range]
TOWRE
53 28:25 17.9 (2.2) [13–22] 110.9 (11.8) [85–132] 112.1 (14.0) [80–138] 107.5 (11.5) [82–128] 101.8 (11.0) [72–123] 104.2 (11.6) [70–123] 98.6 (11.5) [73–120] 104.5 (18.1) [66–137] N/A
Reading composite
N/A
11 9:2 16.3 (1.8) [14–19] 105.5 (10.8) [86–117] 107.2 (14.6) [80–127] 102.6 (10.5) [87–123] 90.6 (7.5) [72–99] 92.0 (9.2) [70–106] 88.6 (8.1) [73–99] 81.7 (10.8) [66–99] 81.4 (10.6) [65–105] 83.94 (6.8) [71–94]
10 7:3 16.9 (2.2) [13–20] 112.7 (15.7) [85–132] 112.1 (16.5) [82–138] 110.0 (13.6) [90–125] 106.9 (9.1) [93–123] 107.8 (7.25) [96–122] 103.9 (9.7) [90–117] 115.8 (10.4) [103–132] 103.6 (19.7) [81–139] 108.3 (9.8) [94–123]
N Gender (M:F) Chronological age (in years) WASI FSIQ WASI VIQ WASI PIQ WJ basic reading cluster WJ letter-word ID WJ word attack WJ spelling
F
p
.52
.48
1.62
.22
.53
.48
2.00
.17
20.13
b.001
18.77
b.001
15.36
b.001
52.07
b.001
10.63
b.01
44.17
b.001
Note: WASI = Wechsler Abbreviated Scale of Intelligence (Wechsler, 1999). WJ = Woodcock Johnson Tests of Achievement, Third Edition (Woodcock et al., 2007). TOWRE = Test of Word Reading Efficiency (Torgesen et al., 1999). Reading Composite is composed of average scores of WJ Basic Reading Cluster, WJ Spelling, and TOWRE Total Reading. Only participants in the original fMRI subsample received the TOWRE.
participants on the mental rotation task, and for 47 participants on the impossible figures task.1 All participants were given a cognitive and diagnostic battery of tests that included the Wechsler Abbreviated Scale of Intelligence (WASI, Wechsler, 1999) and Woodcock-Johnson Test of Achievement (WJ-III, Woodcock et al., 2007). For the subset participants performing in the fMRI portion of the study, these participants were additionally given the Test of Word Reading Efficiency (TOWRE, Torgesen et al., 1999). Participants in the fMRI subsample met criteria for RD if the average of their standard scores on the WJ-III Basic Reading cluster, WJ-III Spelling subtest, and the TOWRE Total Word Reading scores were 90 or lower or clinical judgment based on developmental history. All but one participant in the RD group had a score lower than 90 (Reading Composite = 94), but this participant had a significant and documented history of reading difficulties, so he was included in the RD group based on past history and clinical judgment. From the initial sample of 27, we selected a subset of TD and RD participants that were group matched on chronological age and gender, and WASI Verbal IQ, did not reliably differ (although the scores for the TD group were numerically higher on all three WASI scales; see Table 1). Materials and procedure After completing the diagnostic battery, participants completed two cognitive experiments (Navon and mental rotation). Together, diagnostic and behavioral testing took approximately 2–3 h. Participants were then given mock scanner training to prepare them for the fMRI tasks. Before participating in the fMRI portion of the study, participants were given the instructions for the tasks to be completed in the scanner and completed practice sessions for each task. Participants completed three tasks during scanning (impossible figures, lexical decision, and a one-back task using the print and figure stimuli from the key experimental conditions). Participants used their right hand to respond to 1 There were a small number of instances of technological failure that compromised data on the cognitive tasks, and a small number of participants who were unable to complete all of the tasks.
tasks in the magnet. Total time in the fMRI scanner was approximately 1 h, including anatomical scans. Immediately after the participants finished the fMRI session, they performed an additional session of the impossible figures task outside of the scanner. The motivation for this procedure was to acquire data under conditions more similar to the previously published behavioral studies (i.e., von Károlyi, 2001, 2001). This behavioral data was collected after the in-scanner session, however, in order to avoid any priming effects that could affect the fMRI patterns (Korsnes and Magnussen, 2006; Soldan et al., 2006, 2008). Cognitive measures of visuospatial processing The same general procedure was used for each of three tasks measuring different aspects of visuospatial processing in TD and RD. For each task participants were seated in a comfortable non-rotating chair approximately 50 cm from a computer screen. Stimulus presentation and responses were controlled using E-Prime 2.0 software (Psychology Software Tools, Pittsburgh, PA). Responses for all tasks were collected using the outside two buttons on a five-button box. For all tasks each stimulus was present for 4 s, and if the participant did not respond in those 4 s, the item was scored as incorrect and the program advanced to the next item with a 750 ms inter-trial interval. Participants were given no feedback on whether their response was correct or incorrect on experimental trials. Impossible figure behavioral task. This task, identical to the in-scanner version (but collected immediately after the fMRI session), involved a figure judgment (Schacter et al., 1990) similar to the conditions that have shown an advantage in reaction time without cost to accuracy for participants with RD (von Károlyi, 2001; von Károlyi et al., 2003). Participants viewed the 2D drawings figures, and indicated by means of a button press whether the figures were “possible” or “impossible” (see Fig. 1 for examples). Participants were instructed that “possible” figures looked as if they were a real 3D object that you could reach out, grab and hold, whereas it was “impossible” for an impossible figure to exist in real life because one or more of the lines or corners was out of place. The majority of the stimuli were taken from the original set of
J.J. Diehl et al. / NeuroImage 101 (2014) 653–666
possible/impossible stimuli (Schacter et al., 1990); however, following a pilot study, some stimuli were made easier (by adding or subtracting lines or corners) in order make the stimulus difficulty more suitable for younger adolescents. Participants had already completed the fMRI version of this task, so they were not given any practice items. The task consisted of 168 stimuli, presented randomly in two 96 stimuli blocks, separated by a short break and counterbalanced across groups for order of blocks and side of responses on the button box (e.g., possible on either left or right). Mental rotation task. For this task we adapted a common mental rotation task (Peters and Battista, 2007; Vandenberg and Kuse, 1978) in order to test a domain of visual processing that does not involve global-local processing but still involves visual processing in 3 dimensions. Participants viewed pairs of shapes made of blocks, and needed to determine if the figures were the same or different if one was rotated. During practice participants were initially shown 3D examples of the stimuli, and then examples in a laminated book to demonstrate the task. Participants were allowed to practice the task once on the computer with eight practice stimuli to ensure that they understood the task. None of the participants showed any difficulty understanding the task. The experimental task consisted of 94 stimuli, presented randomly in two 47 stimuli blocks, separated by a short break and counterbalanced across groups for order of blocks and side of responses on the button box (e.g., same on either left or right). Navon task. This task was adapted from the hierarchical stimuli paradigm (Navon, 1977) that is commonly used to detect global-local processing biases (e.g., Behrmann and Kimchi, 2003; Fink et al., 1997; Matthews and Martin, 2009, among many others). On each trial participants were presented with a figure with an ‘H’ or an ‘S’ in it and they had to identify which of the letters the figure contained. The target letters could be represented either by a number of small letters that made up the figure or by the gestalt of a figure. In order to control for any implicit learning that might be occurring, ‘H’ was always paired with ‘A,’ and ‘S’ was always paired with E to facilitate implicit learning; however, there was a third type of stimuli where both ‘H’ and ‘S’ were paired with ‘T’ and therefore would have no implicit associations between the two letters. Participants were shown examples of the stimuli in a laminated book, and then were allowed to practice on the computer with 12 practice stimuli in order to ensure that they understood the task. None of the participants showed any difficulty understanding the task. The experimental task consisted of 160 stimuli, presented randomly in two 80 stimuli blocks, one block using the stimuli with the stronger global bias, and another block using the stimuli with a stronger local bias, separated by a short break and counterbalanced across groups for order of blocks. FMRI tasks Participants completed three tasks in the fMRI scanner: (1) a version of the impossible figures task, (2) a lexical decision (word/pseudoword discrimination) task, and (3) a one-back task using stimuli similar to those used in the two key experimental tasks. Participants alternated between functional imaging runs of the impossible figure and lexical decision tasks, with order counterbalanced across participants, and then finished with the one-back task. The one-back was completed at the end of the session to ensure there were not any priming effects during the critical trials of the impossible figures task. Before scanning sessions participants were given instructions on the tasks with print outs of sample stimuli followed by practice on a computer in the Yale Reading Center. Participants were given feedback on their performance in order to ensure that they understood what “possible” and “impossible” meant. All participants demonstrated that they understood the tasks in the practice run. In the scanner stimuli were presented using E-Prime 2.0, and accuracy and latencies were recorded using a fiber optic button box. Participants were given an
657
additional short practice run in the scanner to familiarize them with how the task would run in the scanner. Impossible figure fMRI task. For the fMRI impossible figures runs, the task demands were similar to the out of scanner version of the task conducted immediately afterwards, although the timing of stimulus presentation was adapted for ideal fMRI data acquisition. In each of six functional imaging runs in an event-related design, participants viewed 28 figures (half possible, half impossible). Unlike the behavioral version, participants did not advance to the next figure once they registered a decision. Stimuli were presented for 2.5 s. Trials entailed multiple randomized or “jittered” durations (4–7 s) to facilitate analysis (Miezin et al., 2000), and occasional longer durations (i.e., “null” trials) to improve our estimate of baseline activation. Lexical decision task. For this event-related scanner task, participants were asked to determine whether a printed token was a real English word or not. Word stimuli were medium frequency (mean frequency, HAL Study: 23399.19; range: 731–324,161; Balota et al., 2007; Lund and Burgess, 1996) and matched to pseudowords in length (range: 4–6 letters, mean: 4.5 letters). In addition, half of the real words and half of the pseudowords were presented in mixed case to provide a difficulty manipulation that would be analogous to the impossiblepossible figures contrast. Stimulus presentation times and trial durations were identical to those used for the impossible figures functional imaging runs. In each run, participants saw 28 items (7 of each of the 4 stimulus types described above). In order to lessen task demands for participants, “real” and “possible” responses were always on the same button, and “pseudoword” and “impossible” were always on the same button for each individual participant. One-back task. For the last 2 runs at the scanner, participants completed a task designed to identify the underlying perceptual circuits involved in processing figures and printed stimuli with a common (one-back) task that involved minimal cognitive processing demands. This allows us to determine whether differences in activation patterns between groups on figures vs. print tokens seen in the primary lexical decision vs. impossible figures task comparisons are still observed when the task is held constant. If general patterns are similar in the common task condition this would imply basic perceptual processing as opposed to task-specific cognitive processing differences for language and non-language visual tokens. In the one-back condition participants identified whether the stimulus on the screen was the same or different from the preceding stimulus. A block design was used with 3 blocks of possible figures and 3 blocks of real (not case-mixed) words (8 items per block) in each run alternating with a baseline condition in which participants saw a ‘+’ sign on the screen and alternated between left and right button presses with each subsequent ‘+,’ rather than making one-back decisions. FMRI image acquisition and analysis FMRI data were acquired using a Siemens 3 Tesla “Tim Trio” scanner at the Yale School of Medicine. Foam wedges around the head and a restraining band across the forehead were used in an 8 channel head coil to minimize movements. Prior to functional imaging, 32 axialoblique anatomic images (FA [flip angle], 60°, TE [echo time], 2.47 ms; TR [repetition time], 300 ms; 4 mm slice thickness, no gap; 256 × 256 mm × 2 NEX [number excitations]) were prescribed parallel to the intercommissural line. Activation images were collected at these same slice locations using single shot, gradient echo, echo planar acquisitions (FA, 80°; TE, 30 ms; TR, 2000 ms; 4 mm slice thickness, no gap; 64 × 64 × 1 NEX), resulting in 95 images obtained per 3:10 functional run with an additional 5 images at the beginning of each run discarded due to image stabilization. High-resolution anatomical images were gathered for 3D reconstruction (sagittal MPRAGE acquisition, FA, 8°;
658
J.J. Diehl et al. / NeuroImage 101 (2014) 653–666
TE, 3.65 ms; TR, 2000 ms; 256 × 256 mm; 1 mm slice thickness, no gap; 1 NEX; 160 slices total). Data analysis was completed using algorithms developed in MATLAB (Mathworks, Inc.) in conjunction with Bio-Image Suite (REF). Functional images were corrected for slice-acquisition time, motioncorrected with SPM2 (Friston et al., 1995), and spatially smoothed with a 3.125 mm FWHM Gaussian filter. Images in which rotation exceeded 2° or displacement exceeded 2 mm and functional runs in which 65% or more of the images exceeded tolerance were excluded from analysis. Using Bio-Image Suite, each subject's T1 anatomic was mapped onto the 2-mm MNI standard space “Colin” brain defined by the Montreal Neurological Institute. This was applied to all singlesubject activation maps prior to across subject analysis with trilinear interpolation. Preprocessed images acquired during the block design of the one-back task were then submitted to a linear regression analysis at each voxel for every subject in order to compare the mean signal for each experimental condition to the baseline condition. By dividing by the square root of the error mean square for the model, the differences of the signal were converted to standardized activation values. Preprocessed images acquired during the event-related design of the impossible figures and lexical decision tasks were processed using a linear regression based method that allows for direct estimation of the hemodynamic response function for each condition on a voxelwise basis without a priori specification of a reference function (Miezin et al., 2000). Single subject activation maps were created for each condition using the regression estimates to calculate the mean activation difference between a baseline (0–3 s prior to trial onset) and an activation period (3–8 s post onset). Because of a planned scanner upgrade midway through data acquisition, we employed two methods to account for differences in signal across subjects. First, we acquired data on individuals from both groups pre (7 RD, 8 TD) and post (4 RD, 2 TD) upgrade such that any uncorrected scanner differences would minimally impact our primary group comparisons. Second, within each single subject analysis, regression parameters (B-weights) were converted to standardized activation values by dividing them by the square root of the error mean square for the model, as in Pugh et al. (2008). For across-subjects analyses of both block and event-related data, values from the single-subject analyses were entered into repeated measures analyses of variance conducted on a voxel-wise basis with planned comparisons for main effects and interactions of interest. All comparisons are report at a p b .01, with a correction for false discovery rate (FDR; Genovese et al., 2002). Results Results below are presented both for the entire sample (53 participants) and for the subsample of 21 (11 RD, 10 TD) who participated in the fMRI portion of the study. Results are presented in the following order: (1) behavioral results for the full sample out of the scanner, (2) behavioral results for the fMRI subgroup on tasks conducted out of the scanner, (3) behavioral results for the fMRI subgroup in the scanner, and (4) fMRI results. It should be noted that reaction times for all sections represent reaction times for correct trials only. Behavioral data Full sample, out of scanner tasks We conducted a series of analyses examining the relation between word reading skills and both accuracy and reaction times to correct responses on the visuospatial tasks (Navon, mental rotation, and impossible figures). Because current evidence suggests that RD is best understood as a dimensional disorder (Fletcher et al., 2007) in which relevant cognitive and neurobiological differences between skilled and less skilled readers are thought to be gradient, we utilize continuous
Table 2 Mean accuracy and reaction times for behavioral tasks conducted both outside of the scanner and inside the scanner. For the fMRI Subsample, data are presented for overall subsample and then for the groups with and without RD. Task (sample size) Entire sample — out of scanner Impossible figures (N = 47) Mental rotation (N = 49) Navon (N = 53) fMRI subsample — out of scanner Impossible figs overall (N = 21) RD group (N = 11) TD group (N = 10) Mental rotation overall (N = 21) RD group (N = 11) TD group (N = 10) Navon overall (N = 21) RD group (N = 11) TD group (N = 10) fMRI subsample — in scanner Impossible figures (N = 21) RD group (N = 11) TD group (N = 10) Lexical decision (N = 21) RD group (N = 11) TD group (N = 10) One-back (N = 21) RD (N = 11) TD (N = 10)
Accuracy — Mean %. Correct (SD)
Reaction Time — Mean-ms. (SD-ms.)
.81 (.09)
1254.57 (409.89)
.75 (.11)
1679.63 (431.48)
.98 (.04)
753.05 (153.06)
.81 (.10)
971.48 (210.09)
.78 (.09) .84 (.11) .75 (.11)
939.20 (222.52) 1007.00 (200.98) 1764.02 (419.08)
.73 (.07) .76 (.14) .98 (.02) .97 (.02) .98 (.02)
1710.97 (448.43) 1822.39 (399.53) 775.78 (169.70) 785.24 (123.08) 765.38 (216.64)
.73 (.13)
1266.28 (132.75)
.70 (.11) .77 (.13) .88 (.09)
1316.49 (75.52) 1211.05 (162.34) 1149.76 (239.48)
.84 (.08) .92 (.08) .80 (.19) .79 (.17) .82 (.20)
1290.92 (196.15) 994.49 (183.18) 575.27 (139.48) 596.13 (134.27) 552.32 (148.60)
RD — reading disability, TD — typically developing. Bolded text represents scores for the entire fMRI sample.
analyses of the behavioral data in which our sample size and skill distribution is adequate for this analytic approach. Given extensive variability on full-scale IQ scores in the full behavioral sample we also included this factor along with chronological age as nuisance variables in separate regression analyses performed with dependent variable WJ Letter-Word ID for each of six predictors of interest: (1) reaction times to possible/impossible figure judgments; (2) accuracy of possible/impossible figure judgments; (3) mental rotation reaction time; (4) mental rotation accuracy, (5) Navon reaction times, and (6) Navon accuracy. For each model WASI full-scale IQ and chronological age were entered into the model before the predictor of interest. Table 2 contains mean accuracies and reaction times, and Table 3 contains regression models along with zero order and partial correlations. All six models were significant; however, of our six variables of interest only reaction times for mental rotation and impossible figures significantly predicted Letter-Word ID (p = 0.03 and p = 0.01 respectively).2 In essence, lower reaction times on these tasks were correlated with lower scores on Letter-Word ID, suggesting that participants who were worse at reading also displayed a relative speed advantage in the mental rotation and impossible figures tasks. Importantly, there was no relationship between speed and accuracy in either the impossible figures task (r = .04, p = .81) or the mental rotation task (r = − .01, p = .95), suggesting that participants did not sacrifice
2 Because of previous research suggesting a global processing bias, we ran additional regression models, identical to the ones described above, with reaction times to stimuli in which participants had to make global and local judgments. We found no effects in either model (ps N .3).
J.J. Diehl et al. / NeuroImage 101 (2014) 653–666 Table 3 Regression Table for entire sample on out-of-scanner tasks for variables predicting WJ Letter-Word ID. Model Omnibus/ predictor 1
2
3
4
5
6
bweight
tvalue
pvalue
F(3,46) = 11.14, p b .001 Intercept 27.1 1.61 0.12 WASI FSIQ 0.53 4.53 b.001 Age 0.50 0.77 0.44 a IF RT 0.008 2.19 0.03 F(3,46) = 8.65, p b .001 Intercept 19.05 1.02 0.31 WASI FSIQ 0.55 4.22 b.001 Age 1.10 1.78 0.08 a IF ACC 4.94 0.31 0.76 F(3,48) = 14.45, p b .001 Intercept 8.99 0.58 0.56 WASI FSIQ 0.56 5.43 b.001 Age 1.12 2.00 0.05 MRa RT 0.007 2.62 0.01 F(3,48) = 10.55, p b .001 Intercept 23.23 1.47 0.15 WASI FSIQ 0.58 4.73 b.001 Age 0.89 1.47 0.15 MR ACC 0.88 0.06 0.95 F(3,52) = 11.71, p b .001 Intercept 9.06 0.49 0.63 WASI FSIQ 0.58 5.39 b.001 Age 1.35 2.18 0.03 Navon RT 0.01 1.06 0.30 F(3,52) = 11.38, p b .001 Intercept −1.11 −0.03 0.97 WASI FSIQ 0.56 5.04 b.001 Age 1.06 1.78 0.08 Navon RT 25.10 0.74 0.46
Correlation Partial correlation
0.57 0.23 0.41
Table 4 Regression Table for fMRI subsample on out-of-scanner tasks for variables predicting WJ Letter-Word ID. Model Omnibus/ predictor
bweight
1
b .05 27.81 0.50 0.26 0.01 = .08 48.67 0.46 −0.19 4.26 b .05 −4.81 0.57 1.30 0.01 = .08 48.46 0.47 −0.17 3.17 = .07 31.82 0.52 0.29 0.01 = .07 0.44 0.47 −0.25 52.85
0.57 0.12 0.32 2
0.57 0.23 0.27
0.54 0.26 0.05 3
0.62 0.23 0.28
0.63 0.29 0.36 4
0.62 0.23 0.30
0.58 0.21 0.01 5
0.60 0.25 −0.03
0.61 0.30 0.15 6
0.60 0.25 0.25
0.58 0.25 0.11
659
F(3,20) = 3.42, p Intercept WASI FSIQ Age IF RTa F(3,20) = 2.68, p Intercept WASI FSIQ Age IF ACCa F(3,20) = 4.55, p Intercept WASI FSIQ Age MRa RT F(3,20) = 2.68, p Intercept WASI FSIQ Age MR ACC F(3,20) = 2.78, p Intercept WASI FSIQ Age Navon RT F(3,20) = 2.76, p Intercept WASI FSIQ Age Navon RT
tvalue
pvalue
Correlation Partial correlation
0.80 0.43 2.89 b.01 0.22 0.83 1.24 0.23
0.57 −0.17 0.24
0.57 0.05 0.29
1.54 0.14 2.11 b.05 −0.16 0.88 0.16 0.88
0.57 −0.17 0.34
0.46 −0.04 0.04
−0.12 0.91 3.39 b.001 1.00 0.33 1.96 0.07
0.57 −0.17 0.27
0.64 0.24 0.43
1.51 0.15 2.41 b.05 −0.14 0.89 0.14 0.90
0.57 −0.17 0.25
0.50 −0.03 0.03
0.66 0.52 2.68 b.05 0.19 0.85 0.47 0.64
0.57 −0.17 −0.00
0.55 0.05 0.11
0.00 1.00 2.62 b.05 −0.21 0.84 0.44 0.67
0.57 −0.17 0.14
0.54 −0.05 0.11
MR = mental rotation; IF = impossible figure; RT = reaction time; ACC = accuracy.
MR = mental rotation; IF = impossible figure; RT = reaction time; ACC = accuracy.
accuracy for speed. The Letter-Word ID task is a commonly used sight word reading test used to examine word decoding skill (e.g., Pugh et al., 2013) and given that RD is defined by word level processing deficits, we employed this as our primary dependent measure for these analyses.
In-scanner tasks We then examined the behavioral performance of the fMRI subsample (RD = 11, TD = 10) on tasks that were conducted during the fMRI scan (impossible figures, lexical decision task, one-back). We conducted separate regression analyses for accuracy/RT on each task with chronological age and FSIQ as nuisance variables with WJ Letter-Word ID as the dependent variable (see Table 2 for accuracy/RT means, and Table 5 for regression models). All six overall3 models were at least marginally significant, with models for reaction times in impossible figures (p b .05) and lexical decision (p b .05) reaching significance. Reaction time on the lexical decision task,4 however, was the only factor to significantly predict Letter-Word ID in these models (p b .05).
FMRI subsample, out-of-scanner tasks Next, we separately examined the out-of-scanner performance of the subsample of 11 individuals with RD and 10 TD controls who also participated in the fMRI portion of the study, using the same data analysis approach that we used for the entire sample (see Table 2 for accuracy/RT means, and Table 4 for regression models). In this section we examined just out-of-scanner data to see if the samples were comparable. These analyses were performed to ensure that our subsample was similar to our overall sample in terms of their pattern of performance. All models showed at least a marginal trend toward significance, with the impossible figures and mental rotation reaction times reaching significance. The lack of significance for all models is likely due to the smaller sample sizes for the scanner tasks. Still, even with this subsample there was a trend toward a relationship between mental rotation reaction times (p = .07) even when FSIQ and age were included in the model. The RD subsample was faster that the TD group in reaction times for both the impossible figures task and the mental rotation task, although none of these differences reached significance (all Fs b 1). Additionally, in the RD group there was no significant relationship between reaction times and accuracy for impossible figures (r = .14, p = .68) or mental rotation (r = −.15, p = .67), suggesting that there was no trade-off between speed and accuracy. Performance on the impossible figures task inside and outside the magnet was highly correlated in terms of accuracy, r = .77, p b .001, but the reaction time correlation was smaller, r = .37, p = .10.
FMRI results Impossible figures vs. lexical decision tasks Using whole-brain analysis, thresholded at p = 0.01, with FDR correction: several regions were observed with higher activation in TD relative to RD including RH fusiform gyrus, bilateral lateral occipital gyrus, LH fusiform gyrus, LH putamen/insula, LH IPL, and bilateral 3 In the Navon tasks, even when reaction times for local and global stimuli were separately analyzed in regression models, there was still no significant relationship between RTs and WJ Letter-Word ID (all ps b .5). 4 We conducted ANOVAs on latencies of correct responses and accuracy for the lexical decision task in order to test whether we replicated findings on this population from previous studies. There was a standard effect of lexicality on reaction times with faster responses to words than pseudowords, F(1,19) = 6.51, p b .05, but no difference on proportion correct (words = .91; pseudowords = .90), F b 1. An effect of case mixing was also obtained on reaction times such that responses to items in lowercase were faster than to items in mixed case, F(1,19) = 7.07, p b .05. There was also an interaction of lexicality by case mixing by reader group on reaction times driven by TD readers showing a larger case mixing effect than RD readers but only on pseudowords, F(1,19) = 8.96, p b .01. All other effects were not significant, Fs b 3, p N .10.
660
J.J. Diehl et al. / NeuroImage 101 (2014) 653–666
Table 5 Regression Table for fMRI subsample on in-scanner tasks for variables predicting WJ Letter-Word ID. Model Omnibus/ predictor 1
2
3
4
5
6
F(3,20) = 3.11, p Intercept WASI FSIQ Age IF RT F(3,20) = 2.88, p Intercept WASI FSIQ Age IF ACC F(3,20) = 4.55, p Intercept WASI FSIQ Age Lexical Decision RT F(3,20) = 2.67, p Intercept WASI FSIQ Age Lexical Decision ACC F(3,20) = 2.67, p Intercept WASI FSIQ Age One-back RT F(3,20) = 2.69, p Intercept WASI FSIQ Age One-back ACC
bweight b .05 97.00 0.42 −1.03 −0.02 = .07 50.00 0.42 −0.38 13.36 b .05 106.62 0.34 −1.06 −0.02 = .08 51.11 0.48 −0.17 −0.01 = .08 51.11 0.48 −0.17 −0.01 = .08 49.15 0.48 −0.24 2.82
tvalue
pvalue
Correlation Partial correlation
1.65 0.12 2.23 b.05 −0.69 0.50 −0.95 0.36
0.57 −0.17 −0.21
0.48 −0.17 −0.22
1.62 0.12 2.11 b.05 −0.31 0.76 0.65 0.52
0.57 −0.17 0.34
0.46 −0.08 0.16
3.11 b.01 2.11 b.05 −1.00 0.33 −2.61 b.05
0.57 −0.17 −0.54
0.46 −0.24 −0.53
1.21 0.25 2.17 b.05 −0.14 0.89 −0.06 0.96
0.57 −0.17 −0.32
0.47 −0.03 0.01
1.21 0.25 2.17 b.05 −0.14 0.89 −0.06 0.96
0.57 −0.17 −0.32
0.47 −0.03 −0.01
1.57 0.13 2.64 b.05 −0.19 0.85 0.22 0.83
0.57 −0.17 0.07
0.54 −0.05 0.05
IF = impossible figure; RT = reaction time; ACC = accuracy.
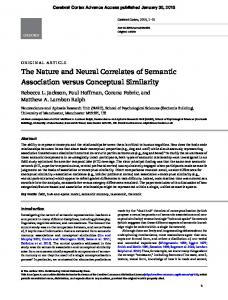
ventral prefrontal cortex (BA 6); no regions with RD greater than TD across tasks were observed. Main effects of task revealed a clear pattern. In frontal cortex, extending ventrally from IFG to more dorsal MFG and BA6/9, figures were associated with greater RH activation whereas print was associated with greater LH activation. Because our primary interest involves the neurobiological signature of the dissociations between reading and visuospatial processing that we observed behaviorally, the main effects are not reported further and we focus primarily on those regions showing a reliable Group × Task interaction. A number of regions showed Group × Task interactions (see Fig. 2 and Table 6) with a few distinct patterns observed across different regions. In order to illustrate these patterns, we extracted activation values for each subject at voxels that showed a significant Group × Task interaction in the composite map and generated barplots of the activation levels for figures and print for RD and TD separately (Fig. 4). First a disordinal interaction pattern was observed in which greater activation was observed for RD than TD when processing print and greater activation was observed for TD than RD when processing figures. This disordinal pattern was seen at several loci including: LH putamen/insula, bilateral precentral gyrus and supplementary motor areas bilateral SFG, LH IFG/MFG (BA 47), LH MFG (BA 46, prefrontal dorsolateral), anterior cingulate (BA 24), and LH intraparietal sulcus. A second pattern was observed in which the Group × Task interaction was driven by greater activation by TD for print relative to RD in regions including: bilateral IFG/lateral orbital gyrus (BA 47), LH IFG (BA 45), RH STG, and RH temporal pole as well as sub-regions in RH basal ganglia. A third pattern was characterized by increased activation for figures in TD relative to print with but similar activation for both print and figures in RD participants. Regions which displayed this third pattern of activation included: RH SFG, RH Insula, RH fusiform gyrus, RH IPL, RH precuneus,
Fig. 2. Regions showing a reader group by task (impossible figures, lexical decision) effect (p b .01, corrected for FDR). Images from top to bottom correspond to the following position along the z-axis in MNI space: + 40 + 22, + 4, − 4, − 10, − 20, and − 24, respectively, with the LH on the right side of the images.
and anterior aspects of LH MTG. A final pattern was observed for bilateral lateral occipital gyrus regions in which RD participants showed relatively decreased activation for print but strong activation for figures with similar levels of activation in TD participants for both figures and print. In sum, a disordinal (crossover) pattern was seen in frontostriatal networks with RD showing greater activation for print than figures and TD showing the opposite pattern. In addition, for TD figures were associated with strong RH activation but print with localized LH activation. For RD less laterally differences were seen; for these participants we observed major task differences in frontostriatal regions and strong responses to figures in visual cortex.
J.J. Diehl et al. / NeuroImage 101 (2014) 653–666 Table 6 Interaction Table for GROUP (TD vs. RD) by task (figures vs. print) in magnet tasks. Region
BA
Vol. (mm3)
MNI
Coord.
(X, Y, Z)
p-value
L cerebellum R IPL L precentral gyrus R cerebellum R SFG L IPL L subcallosal gyrus R fusiform gyrus L lateral occipital gyrus R precentral R lateral occipital gyrus L lateral occipital gyrus L MTG L putamen/insula R MTG R lateral occipital gyrus L SFG R SFG L MFG R STG L intraparietal sulcus Bilateral sup. SFG R MTG R IFG/precentral gyrus L IFG/lateral orbital gyrus R MFG R sup. frontal sulcus L fusiform gyrus R insula R IFG R SFG (sup. aspect) R basal ganglia R IFG R postcentral gyrus L IFG R IFG/lateral orbital gyrus L putamen R temporal pole L MFG R precentral gyrus L MTG R STG
18 39 6 19 6 40 34 19 18 6 19 19 22 13 21 18 9 9 46 22 7 6 21 13 47 9 8 20 – 47 6 – 44 1 45 47 – 38 8 6 37 21
17200 14470 13264 13000 8416 7528 6832 6432 6352 5704 5624 4568 4288 4200 3952 3664 3408 3312 2144 2056 2032 2032 1872 1848 1600 1232 1200 1152 1128 896 800 752 632 624 616 608 528 480 464 432 392 288
−26 54 −51 54 −6 −60 10 34 −42 34 30 −38 −40 −30 62 26 2 4 −32 66 −22 12 48 36 −48 46 30 −36 34 62 12 30 64 62 −58 46 −30 34 −34 24 −64 62
−86 −69 0 −72 −6 −44 8 −66 −84 −6 −84 −68 −22 20 −26 −98 41 58 32 −36 −52 20 −2 2 36 34 22 −12 16 24 8 −8 18 −26 26 38 −4 16 18 −24 −57 4
−38 30 44 −34 58 40 −16 −9 −12 44 18 9 −12 7 −13 4 38 30 16 10 46 62 −24 22 −6 34 54 −20 4 0 70 −4 14 47 2 −16 10 −36 60 74 −6 −16
0.0021 0.0018 0.0001 0.0033 0.0001 0.0025 0.0001 0.0001 0.0015 0.0001 0.0001 0.0001 0.0053 0.0001 0.0020 0.0021 0.0033 0.0026 0.0001 0.0001 0.0001 0.0020 0.0035 0.0001 0.0029 0.0045 0.0025 0.0032 0.0007 0.0054 0.0018 0.0037 0.0032 0.0001 0.0021 0.0042 0.0004 0.0027 0.0034 0.0033 0.0031 0.0008
One-back task This task was included to identify regions where group by stimulus type differences were seen when task is held constant (thus allowing us to distinguish patterns that were task vs. stimulus type related across the two experiments). The general pattern on this simple one-back task regarding group differences is very similar to the task contrasts. Strikingly, as shown in Fig. 3, the data show a clear group by stimulus
Fig. 3. Reader group differences during the one-back task in voxels significantly activated (p b .001, FDR corrected) for figures and print across the entire cortex.
661
type difference even when looking at a simple count of numbers of activated voxels across the entire cortex. For figures, TD readers showed much higher numbers than RD, whereas the opposite pattern is seen for voxels activated by print stimuli. In summary, when simply processing these different types of stimuli, TD and RD show a reversed pattern in terms of activated networks across a broadly distributed bilateral set of regions, and as in the task comparison data, suggest a straightforward link between performance and activation patterns across distributed brain networks. We consider the implications of these findings, both local and distributed, in the Discussion. To summarize, broad group by stimulus hemispheric differences were observed in this study. Indeed, as illustrated in Fig. 4, TD readers showed heightened RH responses to figures at precentral gyrus (BA 6), insula, fusiform gyrus, and IPL. By contrast, print showed heightened activation for TD in a number of LH regions including IFG/lateral occipital gyrus, IFG, and BA 38. Thus, along with heightened frontostriatal activation for figures many RH regions contributed more to these readers processing of figures and LH regions for print in TD but this differentiation by hemisphere was not seen in RD. Findings from the one-back task reinforce these patterns even when a common task is employed. Discussion Behaviorally, the current findings (with the full sample) replicate two previous studies reporting a latency advantage (faster latencies without corresponding error increases) for the impossible figures as reading skill decreases (von Károlyi et al., 2003; von Károlyi, 2001). We also obtained a similar latency advantage on the mental rotation task with decreasing reading skill (it should be noted that this task has produced inconsistent findings with regard to RD in previous studies; e.g., Olulade et al., 2012; Winner et al., 2001). These behavioral findings do suggest a possible visuospatial processing strength with children reading difficulties. At the neurobiological level of analysis, when comparing the impossible figures with the lexical decision tasks, we focused primarily on Group × Task interactions (see Figs. 2 & 4) in a matched subset of TD and RD readers. One disordinal (crossover) pattern was seen across frontostriatal networks (including the putamen/insula, motor and premotor sites) with decreased activation for RD relative to TD participants for figures but the opposite pattern for print. Another type of pattern was seen at a number of LH and RH sites and revealed what appeared to be hemispheric differentiation for print vs. figures for TD but not for RD; thus, for TD several LH networks uniquely responded more vigorously to print than figures (fusiform and IFG), while a number of RH networks (IPL, fusiform, and MFG) showed very elevated responses to figures relative to print in TD but less differentiation in general for RD individuals. Findings from the one-back task analyses (used to compare groups on processing these two types of stimuli with a common overt task that does not involve explicit geometric or linguistic judgments) indicate a clear Group by Stimulus type dissociation; across a wide array of regions, the TD group showed greater activation for figures than print while the opposite pattern was found for RD (similar to Olulade et al., 2012, with a mental rotation task). All of these findings suggest a more circumscribed and efficient neural organization for those stimuli for which a given group showed a reaction time advantage; thus, in general, brain and behavioral data converge. We next discuss the implications of these findings for neurological accounts of RD. We first consider the implications of the crossover interaction pattern seen in frontostriatal networks (see Fig. 4). This system is known to support procedural learning (Barnes et al., 2005; Ullman, 2004) across multiple domains including reading (McNorgan et al., 2011), math (Rivera et al., 2005), and sensorimotor learning (Barnes et al., 2005). Previous studies indicate that this system tends to be less activated for “overlearned” relative to more effortful, less well-learned processes (Rivera et al., 2005). Extrapolating from this, the current
662
J.J. Diehl et al. / NeuroImage 101 (2014) 653–666
Fig. 4. Functionally defined regions of interest from the reader group by task (impossible figures, lexical decision) pattern interaction.
data might be taken to suggest that processing of figures is in some sense more “expert-like” in RD readers and processing of print is more “expert-like” in TD readers in terms of efficiency of processing. Similarly, many studies also suggest that RH networks, particularly RH IPL (BA 39), tend to show greater activation for less well-learned cognitive skills, perhaps reflecting greater attentionally controlled processing. To illustrate, in two developmental studies of children acquiring reading expertise over several years RH activation is reduced relative to LH activation as reading becomes more expert (Shaywitz et al., 1998, 2003; Turkeltaub et al., 2003). Given that TD readers showed higher RH activation for figures (relative both to print and to RD participants on figures) across multiple RH networks, including RH IPL, these data might be seen as reinforcing our interpretation of the frontostriatal asymmetry in suggesting that TD participants processed figures in a more effortful manner. Alternative interpretations of this crossover effect are of course possible. Thus, given that the impossible figure tokens are relatively novel for both groups, it is also possible that TD readers were simply
more intensively (and attentively) processing these stimuli than RD because they are, in some sense, more focused on learning about them. On such an account, we would expect that an initial advantage in latency for RD on figural stimuli would disappear after multiple exposures because TD are more actively engaged in learning about these tokens than RD. However, we think that this account is unlikely for two reasons. First, the RD latency advantage for figures was obtained in a follow-up behavioral testing session (after fMRI) and thus both groups had received multiple exposures to these stimuli prior to testing, so these stimuli were no longer entirely novel for either group during scanning. Secondly, the group-by-stimulus type differences on the one-back task when participants were not explicitly attending to feature judgments reinforce our preferred interpretation that brain differences reflect processing efficiency. Nonetheless, further studies that actually examine longer term learning will be needed to fully address this question. Next, we consider the group differences in hemispheric distributions. A hemispheric tradeoff hypothesis (Horwitz et al., 1998; Pugh et al.,
J.J. Diehl et al. / NeuroImage 101 (2014) 653–666
2000b; Rippon and Brunswick, 2000; Shaywitz et al., 2003; Simos et al., 2002) did receive some support in this study. The notion that specialization in one network for a given type of stimulus can result in less facility for other types of stimuli in that network has been termed the “crowding hypothesis” (e.g., Behrmann and Plaut, 2013; Dehaene et al., 2010). By way of illustration, a recent study (Cai et al., 2013) leveraged the wellestablished finding that most but not all individuals are LH dominant for language and RH dominant for visuospatial processing and the dissociation is thought to avoid crowding. To test this idea, the authors examined a subset of participants with reversed language dominance (RH instead of LH) and found that for these individuals visuospatial processing was associated with greater LH dominance; these results were seen as supporting the crowding hypothesis. In the context of the current study this might have manifested in the following ways. Either for TD, given greater LH specialization for print, visuospatial processing in the impossible figures task would show relatively greater reliance on RH networks, or with regard to RD, greater RH involvement for print might lead to greater LH involvement for figures. The results seem to confirm the first hypothesis regarding TD participants. Thus, for these participants we see greater hemispheric differentiation across tasks with heightened RH activation for figures (relative both to print and relative to RD participants for figures). Given these effects, we can entertain the hypothesis that TD readers (who have been found in previous studies to transition developmentally from bilateral activation for print to LH ventral organization for print as they develop expertise (Pugh et al., 2000a; Vellutino et al., 2004)) may be forced to rely more on RH pattern recognition processing systems for non-language stimuli. By contrast, lack of LH specialization for reading could engender less differentiation in RD and hence a small but robust advantage for impossible figure processing. Of course all of this is speculative, and even if this view is correct, we cannot determine in this study whether these group differences are consequence of reading experience, or whether differences in LH/RH activation patterns reflect TD/RD tuning characteristics that are present even before learning to read. In order to address that developmental question, future studies will need to examine brain and behavior tradeoffs in emergent readers (as children transition from pre to post literate brain organization). Nevertheless, the current findings could be viewed as consistent with the notion that greater LH expertise in print could incur some cost for other materials in TD. Importantly, these findings suggest that for those processing skills that are a relative strength for RD learners, systems-level brain organization appears relatively “normal” (at least to the granularity available to fMRI). Although the patterns of reduced activation at LH reading relevant networks for print in RD are consistent with many previous fMRI studies (Pugh et al., 2013), the novel findings from the impossible figures task suggest that this type of processing task (which is a relative strength in RD) is associated with highly efficient functional brain organization, both in cortical/subcortical pathways associated with learning and in visual pattern processing regions. This may have implications for how we view the etiology of reading difficulties. Because RD is characterized as a brain-based learning disability, much research has simply searched for structural or functional anomalies in this population (see Diehl et al., 2011, for a review) and many have been reported. This focus on anomaly follows from the idea that RD, a gene-based condition, is associated atypical neuronal development that acts as an effective functional lesioning of those networks key to language and literacy learning. Structural anomalies have been reported at several levels of analysis ranging from the cellular (Galaburda, 2006) to large-scale gray and white matter distributions (e.g., Hoeft et al., 2007; Richlan et al., 2012). However, many previous studies, both of long-term remediation (Sandak et al., 2004; Shaywitz et al., 2003; Simos et al., 2002; Temple et al., 2003) or short-term learning in RD learners (Pugh et al., 2008), suggest that neurobiological systems are “noisy,” but not fundamentally lesioned. Indeed, as behavioral performance improves neurobiological anomalies are diminished in RD, suggesting a relative deficit (Pugh et al., 2000b). We should note
663
that we found little evidence of task invariant neurobiological anomaly in this study. Thus, while a few regions did show lower activation in RD than TD irrespective of task (including RH fusiform gyrus, bilateral occipital gyrus, LH fusiform gyrus, LH insula, LH IPL, and bilateral ventral prefrontal cortex), the differences seen were relative (these networks do not appear to be profoundly disrupted in an absolute sense), and none contributed directly to the group by task patterns which appear relevant to performance differences. We suspect that only a systems level account of RD will makes sense of both the relative strengths and relative weaknesses in behavior and the fact that when performance is good, the neural systems appear intact (see Goswami, 2011; Vidyasagar, 2013 for examples of systems-level accounts). Further studies of relative strengths and weaknesses in RD will be needed to move toward a systems-level model that can account for why the same circuits can appear abnormal or normal depending on task in what ultimately is clearly a gene/brain based condition. It should be noted that recent neurobiological studies have examined the relationship between reading skill and mental rotation in individuals with RD compared to typically developing peers (Olulade et al., 2012) and “twice-exceptional” individuals with RD (Gilger et al., 2013). Interestingly, these studies demonstrated diminished neurological activity for individuals with RD. Unfortunately, we did not use the mental rotation task in the fMRI portion of the study, so our studies are not directly comparable. In general, we found a dissociation of skill rather than diminished activity, and we found behavioral differences outside of the scanner. It will be important in future research to determine whether or not these differences are related to the differences between the impossible figures and mental rotation tasks or differences between the samples. Implications for cognitive theories of RD None of the major RD neurocognitive theories are necessarily refuted by these findings. However, on the surface at least, a general visual processing deficit account would seem to be challenged by both the behavioral data (on mental rotation and impossible figures) and on the neural patterning in visual regions for figures, which suggested a high degree of skill in RD. We must note however, that at least one researcher (Stein, 2001) positing a magnocellular visual processing deficit theory of RD has speculated that advantages for certain kinds of stimuli relative to print might arise as a consequence of differences in the distributions of magnocellular and parvocellular neurons in RD, and so it remains to be seen whether this model can account for the current findings. It might also be argued that those accounts which posit domain general procedural learning deficits, wherein such learning deficits are thought to arise from non-intact frontostriatalcerebellar loops (see Nicolson and Fawcett, 2007; Ullman, 2004), would also be challenged to account for the crossover interaction seen in the frontostriatal systems, which seems to suggest increased efficiency (routinization) for configural processing in RD and print in TD. A general disruption in these cortical/subcortical pathways would not, on first pass analysis, seem to predict efficient neural patterning in frontostriatal networks for figures, though further studies that actually focus on learning and consolidation of these materials will be needed to properly test these ideas. In any case, the current findings pose a challenge to all current RD accounts since all are focused on deficits only. As to the specific underlying mechanisms responsible for producing a processing advantage for visual (configural) stimuli in RD, the current study is also not definitive. One idea that has been put forward (von Károlyi et al., 2003) is that RD learners are more attuned to global vs. local coding and this produces an advantage for configural processing. However, on the Navon task in the behavioral battery, no obvious global-local group differences were found and that would seem, in general, inconsistent with a simple global/local difference (though the use of letters in this task may induce advantages in TD readers that
664
J.J. Diehl et al. / NeuroImage 101 (2014) 653–666
might offset other processes so the Navon task may not be optimally suited to address this issue). Further studies targeting those networks identified here in the context of prospective longitudinal designs and/ or online learning will be needed to inform the question of mechanism for the advantage. Thus, if we see that advantages pre-sage reading experience it would suggest a congenital advantage in RD associated most likely with differences in visual tuning characteristics, but if these relative advantages are in fact the result of group differences in reading experience it may be argued that the impossible figures finding is in fact not an advantage in RD. This study has a number of important limitations that highlight the need for replication. First, the fMRI portion of the study has a relatively small sample size. Additionally, our RD sample has a broad range of cognitive abilities, and it is important to consider that the neurological profiles/pathways are not necessarily going to be the same across this spectrum of abilities (see Gilger and Kaplan, 2001). In our study IQ was covaried to control for this variance. However, research on “twice-exceptional” individuals might represent a unique behavioral profile from individuals with RD (Foley Nicpon et al., 2011), although there is some recent evidence for a similar neurological profile (Gilger et al., 2013). It should also be noted that our RD group had lower IQs than our TD group in the fMRI portion of the study. Still, we were able to find relative strengths and weaknesses despite this limitation. Finally, we found latency advantages for impossible figures when the test was conducted outside of the fMRI, but we did not replicate this behavioral finding during scanning. We cannot be certain that individuals with RD were using the same strategy inside and outside of the fMRI. Still, the disordinal brain differences in the frontostriatal networks would not seem to be influenced by strategy since the same pattern held in the simpler cognitive task (one-back). In summary, we found a small (but reliable) processing advantage for geometric patterns in RD. It may be that a proclivity for these kinds of materials and tasks reflect basic differences in the tuning characteristics of pattern recognition systems in RD that would be evident prior to formal literacy instruction, or it may be that these latency advantages are really in some sense “disadvantages” in TD that reflect a cost for increased focus on print processing in specialized LH networks. If the former is the case, then this might be seen as consistent with anecdotal evidence of RD strengths and talents in visuospatial domains. However, given the inability to establish directionality here we must be very cautious at this point in over-interpreting these findings until systematic developmental and learning studies are conducted. The current findings, at minimum, do indicate that at the granularity of fMRI, functional neurocircuits for some types of visuospatial processes are generally well-structured in RD learners, which stands in stark contrast to often reported anomalies for phonology and reading. A systems-level account is needed to provide insight into how the same circuits can appear anomalous or normal depending on task and experience in RD.
Acknowledgments This study was supported by a grant from the Learning Disabilities Network (Boston, MA), NIH P01 HD001994 (PI: Jay Rueckl), NIH R01 HD 048830 (PI: Kenneth R. Pugh), a pilot grant from NHK World, and the Institute for Scholarship in the Liberal Arts at the University of Notre Dame. These organizations had no involvement in the study design, collection/analysis/interpretation of data, writing of the report, or the decision to submit the article for publication. We would like to thank Heatherly Carlson, Brynn Gerstle, Kimberly Ladenheim, Jeannie O'Neill, and Elenor Tejada for their help with participant recruitment, data collection, and data management on this project. We would also like to thank Whitney McWherter, Heidi Miller, Kailey Kawalec, and Padraig Driscoll for their help with manuscript preparation.
References Bacon, A.M., Handley, S.J.,McDonald, E.L., 2007. Reasoning and dyslexia: a spatial strategy may impede reasoning with visually rich information. Br. J. Psychol. 98 (1), 79–92. http://dx.doi.org/10.1348/000712606X103987. Balota, D.A., Yap, M.J., Cortese, M.J., Hutchison, K.A., Kessler, B., Loftis, B., Neely, J.H., Nelson, D.L.,Simpson, G.B.,Treiman, R., 2007. The English lexicon project. Behav. Res. Methods 39, 445–459. http://dx.doi.org/10.3758/BF03193014. Bannatyne, A., 1971. Language, Reading and Learning Disabilities: Psychology, Neuropsychology, Diagnosis, and Remediation. Charles C. Thomas, Springfield, IL. Barnes, T.D., Kubota, Y., Hu, D., Jin, D.Z., Graybiel, A.M., 2005. Activity of striatal neurons reflects dynamic encoding and recoding of procedural memories. Nature 437 (7062), 1158–1161. http://dx.doi.org/10.1038/nature04053. Beaulieu, C.,Plewes, C.,Paulson, L.A.,Roy, D.,Snook, L.,Concha, L.,Phillips, L., 2005. Imaging brain connectivity in children with diverse reading ability. NeuroImage 25, 1266–1271. http://dx.doi.org/10.1016/j.neuroimage.2004.12.053. Behrmann, M., Kimchi, R., 2003. What does visual agnosia tell us about perceptual organization and its relationship to object perception? J. Exp. Psychol. Hum. Percept. Perform. 29 (1), 19–42. http://dx.doi.org/10.1037/0096-1523.29.1.19. Behrmann, M., Plaut, D.C., 2013. Distributed circuits, not circumscribed centers, mediate visual recognition. Trends Cogn. Sci. 17 (5), 210–219. http://dx.doi.org/10.1016/j. tics.2013.03.007. Benton, A., 1984. Dyslexia and spatial thinking. Ann. Dyslexia 34, 69–85. http://dx.doi.org/ 10.1007/BF02663614. Cai, Q.,Van der Haegen, L.,Brysbaert, 2013. Complementary hemispheric specialization for language production and visuospatial attention. Proc. Natl. Acad. Sci. 110 (4), E322–E330. http://dx.doi.org/10.1073/pnas.1212956110. Carrasco, M.,Seamon, J.G., 1996. Priming impossible figures in the object decision test: the critical importance of perceived stimulus complexity. Psychon. Bull. Rev. 3 (3), 344–351. http://dx.doi.org/10.3758/BF03210758. Craggs, J.G., Sanchez, J., Kibby, M.Y., Gilger, J.W., Hynd, G.W., 2006. Brain morphology and neuropsychological profiles in a family displaying dyslexia and superior nonverbal intelligence. Cortex 42, 1107–1118. http://dx.doi.org/10.1016/S0010-9452(08) 70222-3. Davis, G.A.,Rimm, S.B., 1985. Education and the Gifted and Talented. Prentice-Hall, Englewood Cliffs, NJ. Dehaene, S., Pegado, F., Braga, L.W., Ventura, P., Nunes Filho, G., Jobert, A., Cohen, L., 2010. How learning to read changes the cortical networks for vision and language. Science 330 (6009), 1359–1364. http://dx.doi.org/10.1126/science.1194140. Demb, J.B., Boynton, G.M., Best, M., Heeger, D.J., 1998. Psychophysical evidence for a magnocellular pathway deficit in dyslexia. Vis. Res. 38, 1555–1559. http://dx.doi. org/10.1016/S0042-6989(98)00075-3. Deutsch, G.K., Dougherty, R.F., Bammer, R., Siok, W.T., Gabrieli, J.D.E., Wandell, B., 2005. Children's reading performance is correlated with white matter structure measured by diffusion tensor imaging. Cortex 41, 354–363. http://dx.doi.org/10.1016/S00109452(08)70272-7. Diehl, J.J., Frost, S.J., Mencl, W.E., Pugh, K., 2011. Neuroimaging and the phonological deficit hypothesis. In: Braze, D., Brady, S., Fowler, C. (Eds.), Weighing Individual Differences in Reading: Theory and Evidence. Psychology Press, New York, pp. 217–237. Eckert, M., 2004. Neuroanatomical markers for dyslexia: a review of dyslexia structural imaging studies. Neuroscientist 10 (4), 362–371. http://dx.doi.org/10.1177/ 1073858404263596. Eden, G.F.,Stein, J.F., Wood, M.H., Wood, F.B., 1995. Verbal and visual problems in reading disability. J. Learn. Disabil. 28 (5), 272–290. http://dx.doi.org/10.1177/ 002221949502800503. Eden, G.F.,VanMeter, J.W.,Rumsey, J.W.,Maisog, J.,Zeffiro, T.A., 1996. Abnormal processing of visual motion in dyslexia revealed by functional brain imaging. Nature 348, 66–69. http://dx.doi.org/10.1038/382066a0. Facoetti, A., Trussardi, A.N., Ruffino, M., Lorusso, M.L., Cattaneo, C., Galli, R., Zorzi, M., 2010. Multisensory spatial attention deficits are predictive of phonological decoding skills in developmental dyslexia. J. Cogn. Neurosci. 22 (5), 1011–1025. http://dx.doi.org/ 10.1162/jocn.2009.21232. Fink, G.R.,Halligan, P.W.,Marshal, J.C.,Frith, C.D.,Frackowiak, R.S.J.,Dolan, R.J., 1997. Neural mechanisms involved in the processing of global and local aspects of hierarchically organized visual stimuli. Brain 120, 1779–17911. http://dx.doi.org/10.1093/brain/ 120.10.1779. Fletcher, J.F.,Lyon, G.R., Fuchs, L.S.,Barnes, M.A., 2007. Learning Disabilities: From Identification to Intervention. Guilford Press, New York, NY. Foley Nicpon, M., Allmon, A., Sieck, B., Stinson, R., 2011. Empirical investigation of twice-exceptionality: where have we been and where are we going? Gift. Child Q. 55, 3–17. http://dx.doi.org/10.1177/0016986210382575. Fowler, A., Swainson, B., 2004. Relationships of naming skills to reading, memory, and receptive vocabulary: evidence for imprecise phonological representations of words by poor readers. Ann. Dyslexia 54 (2), 247–280. http://dx.doi.org/10.1007/s11881004-0013-0. Friston, K.J.,Holmes, A.P.,Poline, J.B.,Grasby, P.J.,Williams, S.C.R.,Frackowiak, R.S.,Turner, R., 1995. Analysis of fMRI time-series revisited. Neuroimage 2 (1), 45–53. http://dx.doi. org/10.1006/nimg.1995.1007. Gaab, N.,Gabrieli, J.D.E.,Deutsch, G.K.,Tallal, P.,Temple, E., 2007. Neural correlates of rapid auditory processing are disrupted in children with developmental dyslexia and ameliorated with training: an fMRI study. Restor. Neurol. Neurosci. 25 (3), 295–310 (http://iospress.metapress.com/content/01UH6P4066615H77). Galaburda, A.M., 2006. Advances in cross-level research. In: Rosen, G.D. (Ed.), The Dyslexic Brain: New Pathways in Neuroscience Discovery. Psychology Press, New York, pp. 329–354.
J.J. Diehl et al. / NeuroImage 101 (2014) 653–666 Genovese, C.R., Lazar, N.A.,Nichols, T., 2002. Thresholding of statistical maps in functional neuroimaging using the false discovery rate. NeuroImage 15, 870–878. http://dx.doi. org/10.1006/nimg.2001.1037. Geschwind, N., Galaburda, A., 1987. Cerebral Lateralization. MIT Press, Cambridge, MA. Geschwind, N., Levitsky, W., 1968. Human brain: left–right asymmetries in temporal speech region. Science 161, 186–187. Gilger, J.W.,Hynd, G.W., 2008. Neurodevelopmental variation as a framework for thinking about the twice exceptional. Roeper Rev. 30, 214–228. http://dx.doi.org/10.1080/ 02783190802363893. Gilger, J.W., Kaplan, B.J., 2001. Atypical brain development: a conceptual framework for understanding developmental learning. Dev. Neuropsychol. 20 (2), 465–481. http:// dx.doi.org/10.1207/S15326942DN2002_2. Gilger, J.W., Talavage, T.M., Olulade, O.A., 2013. An fMRI study of nonverbally gifted reading disabled adults: has deficit compensation effected gifted potential? Front. Hum. Neurosci. 7, 1–12. http://dx.doi.org/10.3389/fnhum.2013.00507. Goswami, U., 2011. A temporal sampling framework for developmental dyslexia. Trends Cogn. Sci. 15, 3–10. http://dx.doi.org/10.1016/j.tics.2010.10.001. Goswami, U.,Ziegler, J.C., 2006. A developmental perspective on the neural code for written words. Trends Cogn. Sci. 10 (4), 142–143. http://dx.doi.org/10.1016/j.tics.2006.02.006. Goswami, U., Thomson, J., Richardson, U., Stainthorp, R., Hughes, D., Rosen, S., Scott, S.K., 2002. Amplitude envelope onsets and developmental dyslexia: a new hypothesis. Proc. Natl. Acad. Sci. 99 (16), 10911–10916. http://dx.doi.org/10.1073/pnas. 122368599. Hellige, J.B., 1996. Hemispheric asymmetry for visual information processing. Acta Neurobiol. Exp. 56, 485–497 (http://www.rozjec.ane.pl/pdf/56056.pdf). Hellige, J.B., Michimata, C., 1989. Categorization versus distance: hemispheric differences for processing spatial information. Mem. Cogn. 17 (6), 770–776. http://dx.doi.org/ 10.3758/BF03202638. Hoeft, F.,Ueno, T.,Reiss, A.L.,Meyler, A.,Whitfield-Gabrieli, S.,Glover, G., et al., 2007. Prediction of children's reading skills using behavioral, functional, and structural neuroimaging measures. Behav. Neurosci. 121, 602–613. http://dx.doi.org/10.1037/07357044.121.3.602. Horwitz, B., Rumsey, J.M., Donohue, B.C., 1998. Functional connectivity of the angular gyrus in normal reading and dyslexia. Proc. Natl. Acad. Sci. 95, 8939–8944. http:// dx.doi.org/10.1073/pnas.95.15.8939. Howard, J.H.,Howard, D.V.,Japiske, K.C.,Eden, G.F., 2006. Dyslexics are impaired on implicit higher-order sequence learning, but not on implicit spatial context learning. Neuropsychologia 44 (7), 1131–1144. http://dx.doi.org/10.1016/j.neuropsychologia. 2005.10.015. Hynd, G.W., Semrud-Clikeman, M., Lorys, A.R., Novey, E.S., Eliopulos, D., 1990. Brain morphology in developmental dyslexia and attention deficit/hyperactivity disorder. Arch. Neurol. 47, 919–926. Jenkins, I.H., Brooks, D.J., Nixon, P.D., Frackowiak, R.S., Passingham, R.E., 1994. Motor sequence learning: a study with positron emission tomography. J. Neurosci. 14 (6), 3775–3790. Johnston, J., Weismer, S., 1983. Mental rotation abilities in language-disordered children. J. Speech Lang. Hear. Res. 26, 397–403. Keen, A.G., Lovegrove, W.J., 2000. Transient deficit hypothesis and dyslexia: examination of whole-parts relationship, retinal sensitivity, and spatial and temporal frequencies. Vis. Res. 40, 705–715. http://dx.doi.org/10.1016/S0042-6989(99)00208-4. Keller, T.A., Just, M.A., 2009. Altering cortical connectivity: remediation-induced changes in the white matter of poor readers. Neuron 64, 624–631. http://dx.doi.org/10. 1016/j.neuron.2009.10.018. Klingberg, T., Hedeus, M., Temple, E., Salz, T., Gabrieli, J.D.E., Moseley, M.E., Poldrack, R.A., 2000. Microstructore of temporo-parietal white matter as a basis for reading ability: evidence from diffusion tensor magnetic resonance imaging. Neuron 25 (2), 493–500. http://dx.doi.org/10.1016/S0896-6273(00)80911-3. Koenig, O.,Kosslyn, S.,Wolff, P., 1991. Mental imagery and dyslexia: a deficit in processing multipart visual objects? Brain Lang. 41, 381–394. http://dx.doi.org/10.1016/0093934X(91)90162-T. Korsnes, M.S., Magnussen, S., 2006. Fast perceptual priming in the left and right hemispheres. Scand. J. Psychol. 47, 85–91. http://dx.doi.org/10.1111/j.1467-9450.2006. 00495.x. Landi, N.,Frost, S.J.,Mencl, W.E.,Sandak, R.,Pugh, K.R., 2013. Neurobiological bases of reading comprehension: insights from neuroimaging studies of word-level and text-level processing in skilled and impaired readers. Read Writ. Q. 29, 145–167. http://dx.doi. org/10.1080/10573569.2013.758566. Larsen, J.P.,Høien, T.,Lundberg, I.,Odegarrd, H., 1990. MRI evaluation of the size and symmetry of the planum temporale in adolescents with developmental dyslexia. Brain Lang. 39, 289–301. http://dx.doi.org/10.1016/0093-934X(90)90015-9. Lund, K., Burgess, C., 1996. Producing high-dimensional semantic spaces from lexical cooccurrence. Behav. Res. Methods Instrum. Comput. 28, 203–208. http://dx.doi.org/ 10.3758/BF03204766. Lyon, G.R., Shaywitz, S.E., Shaywitz, B.E., 2003. A definition of dyslexia. Ann. Dyslexia 53 (1), 1–14. http://dx.doi.org/10.1007/s11881-003-0001-9. Matthews, A.J., Martin, F.H., 2009. Electrophysiological indices of spatial attention during global/local processing in good and poor phonological decoders. Brain Lang. 111, 152–160. http://dx.doi.org/10.1016/j.bandl.2009.09.002. McCallum, R.S., Bell, S.M., Coles, J.T., Miller, K.C., Hopkins, M.B., Hilton-Prillhart, A., 2013. A model for screening twice-exceptional students (gifted with learning disabilities) within a response to intervention paradigm. Gift. Child Q. 57, 209–222. http://dx. doi.org/10.1177/0016986213500070. McNorgan, C., Alvarez, A., Bhullar, A., Gayda, J., Booth, J.R., 2011. Prediction of reading skill several years later depends on age and brain region: implications for developmental models of reading. J. Neurosci. 31 (26), 9641–9648. http://dx.doi.org/10.1523/ JNEUROSCI.0334-11.2011.
665
Miezin, F.M.,Maccotta, J.M.,Ollinger, S.E., Peterson, S.E., Buckner, R.L., 2000. Characterizing the hemodynamic response: effects of presentation rate, sampling procedure, and the possibility of ordering brain activity based on relative timing. NeuroImage 11, 735–759. http://dx.doi.org/10.1006/nimg.2000.0568. Morris, R., Stuebing, K., Fletcher, J., Shaywitz, S., Lyon, G.R., Shankweiler, D., Shaywitz, B., 1998. Subtypes of reading disability: coherent variability around a phonological core. J. Educ. Psychol. 90 (3), 347–373. Naidoo, S., 1972. Specific dyslexia. Wiley, New York. Navon, D., 1977. Forest before trees: the precedence of global features in visual perception. Cogn. Psychol. 9, 353–383. http://dx.doi.org/10.1016/0010-0285(77)90012-3. Nicolson, R.I., Fawcett, A.J., 2007. Procedural learning difficulties: reuniting the developmental disorders? Trends Neurosci. 30 (4), 135–141. http://dx.doi.org/10.1111/j. 1469-8749.2007.00306.x. Nielson, M.E., 2002. Gifted students with learning disabilities: recommendations for identification and programming. Exceptionality 10, 93–111. http://dx.doi.org/10.1207/ S15327035EX1002_4. Niogi, S.N., McCandliss, B.D., 2006. Left lateralized white matter microstructure accounts for individual differences in reading ability and disability. Neuropsychologia 44 (11), 2178–2188. http://dx.doi.org/10.1016/j.neuropsychologia.2006.01.011. Olulade, O.A., Gilger, J.W., Talavage, T.M., Hynd, G.W., McAteer, C.I., 2012. Beyond phonological processing deficits in adult dyslexics: atypical fMRI activation patterns for spatial problem solving. Dev. Neuropsychol. 37, 617–635. http://dx.doi.org/10.1080/ 87565641.2012.702826. Pallier, C., Devauchelle, A., Dehaene, S., 2011. Cortical representation of the constituent structure of sentences. Proc. Natl. Acad. Sci. 108 (6), 2522–2527. http://dx.doi.org/ 10.1073/pnas.1019723108. Peters, M., Battista, C., 2007. Applications of mental rotation figures of the Shepard and Metzler type and description of a mental rotation stimulus library. Brain Cogn. 66 (3), 260–264. http://dx.doi.org/10.1016/j.bandc.2007.09.003. Preston, A.R., Gabrieli, J.D.E., 2008. Dissociation between explicit memory and configural memory in the human medial temporal lobe. Cereb. Cortex 18 (9), 2192–2207. http://dx.doi.org/10.1093/. Pugh, K.R.,Mencl, W.E.,Jenner, A.R.,Katz, L.,Frost, S.J.,Lee, J.R.,Shaywitz, S.E.,Shaywitz, B.A., 2000a. Functional neuroimaging studies of reading and reading disability (developmental dyslexia). Ment. Retard. Dev. Disabil. Res. Rev. 6, 207–213. http://dx.doi.org/ 10.1002/1098-2779(2000)6:3b207::aid-mrdd8N3.0.co;2-p. Pugh, K.R.,Mencl, W.E.,Shaywitz, B.A.,Shaywitz, S.A.,Fulbright, R.K.,Constable, R.T.,Gore, J.C., 2000b. The angular gyrus in developmental dyslexia: task-specific differences in functional connectivity within posterior cortex. Psychol. Sci. 11 (1), 51–56. http:// dx.doi.org/10.1111/1467-9280.00214. Pugh, K.R., Sandak, R., Frost, S.J., Moore, D., Mencl, W.E., 2005. Examining reading development and reading disability in English language learners: potential contributions from functional neuroimaging. Learn. Disabil. Res. Pract. 20 (1), 24–30. http://dx. doi.org/10.1111/j.1540-5826.2005.00117.x. Pugh, K.R., Frost, S.J., Sandak, R., Landi, N., Rueckl, J., Constable, R.T., Mencl, W.E., 2008. Effects of stimulus difficulty and repetition on printed word identification: an fMRI comparison of nonimpaired and reading-disabled adolescent cohorts. J. Cogn. Neurosci. 20 (7), 1146–1160. http://dx.doi.org/10.1162/jocn.2008.20079. Pugh, K.R.,Frost, S.J.,Sandak, R.,Landi, N.,Moore, D.,Della Porta, G.,Rueckl, J.G.,Mencl, W.E., 2010. Mapping the word reading circuitry in skilled and disabled readers. In: Cornelissen, P.L., Hansen, P.C., Kringelbach, M.L., Pugh, K. (Eds.), The Neural Basis of Reading. Oxford Press, pp. 281–305. Pugh, K.R., Sandak, R., Frost, S.J., Moore, D., Rueckl, J.G., Mencl, W.E., 2013. Neurobiological studies of skilled and impaired reading: a work in progress. In: Rosen, G.D. (Ed.), The Dyslexic Brain: New Pathways in Neuroscience Discovery. Psychology Press, New York, pp. 21–47. Richards, T., Stevenson, J., Crouch, J., Johnson, L.C., Maravilla, K., Stock, P., Abbott, R., Berninger, V., 2008. Tract-based spatial statistics of diffusion tensor imaging in adults with dyslexia. Am. J. Neuroradiol. 29, 1134–1139. http://dx.doi.org/10.3174/ajnr. A1007. Richlan, F., Kronbichler, M., Wimmer, H., 2009. Functional abnormalities in the dyslexic brain: a quantitative meta-analysis of neuroimaging studies. Hum. Brain Mapp. 30 (10), 3299–3308. http://dx.doi.org/10.1002/hbm.20752. Richlan, F.,Kronbichler, M., Wimmer, H., 2011. Meta-analyzing brain dysfunctions in dyslexic children and adults. NeuroImage 56 (3), 1735–1742. http://dx.doi.org/10.1016/ j.neuroimage.2011.02.040. Richlan, F., Kronbichler, M., Wimmer, H., 2012. Structural abnormalities in the dyslexic brain: a meta-analysis of voxel-based morphometry studies. Hum. Brain Mapp. 34 (11), 3055–3065. http://dx.doi.org/10.1002/hbm.22127. Rippon, G., Brunswick, N., 2000. Trait and state EEG indices of information processing in developmental dyslexia. Int. J. Psychophysiol. 36, 151–165. Rivera, S.M.,Reiss, A.L.,Eckert, M.A.,Menon, V., 2005. Developmental changes in mental arithmetic: evidence for increased functional specialization in the left inferior parietal cortex. Cereb. Cortex 15 (11), 1779–1790. http://dx.doi.org/10.1093/cercor/bhi055. Rollins, N.K.,Vachha, B.,Srinivasan, P.,Chia, J.,Pickering, J.,Hughes, C.W.,Gimi, B., 2009. Simple developmental dyslexia in children: alterations in diffusion-tensor metrics of white matter tracts at 3 T. Radiology 251, 882–891. http://dx.doi.org/10.1148/ radiol.2513080884. Rourke, B.P. (Ed.), 1985. Neuropsychology of Learning Disabilities: Essentials of Subtype Analysis. Guilford, New York. Ruben, L.M., Reis, S.M., 2005. Identification and assessment of gifted students with learning disabilities. Theory Pract. 44, 115–124. http://dx.doi.org/10.1207/ s15430421tip4402_6. Rudel, R., Denckla, M., 1976. Relationship of IQ and reading score to visual, spatial, and temporal matching tasks. J. Learn. Disabil. 9 (3), 42–51. http://dx.doi.org/10.1177/ 002221947600900309.
666
J.J. Diehl et al. / NeuroImage 101 (2014) 653–666
Rugel, R., 1974. WISC scores of disabled readers. J. Learn. Disabil. 7 (1), 46–65. http://dx. doi.org/10.1177/002221947400700109. Rumsey, J.M., Nace, K., Donohue, B., Wise, D., Maisog, J.M., Andreason, P., 1997. A positron emission tomographic study of impaired word recognition and phonological processing in dyslexic men. Arch. Neurol. 54, 562–573. http://dx.doi.org/10.1001/archneur. 1997.00550170042013. Sandak, R., Mencl, W.E., Frost, S.J., Rueckl, J.G., Katz, L., Moore, D., et al., 2004. The neurobiology of adaptive learning in reading: a contrast of different training conditions. Cogn. Affect. Behav. Neurosci. 4, 67–88. http://dx.doi.org/10.3758/CABN.4.1.67. Schacter, D.L., 1992. Understanding implicit memory: a cognitive neuroscience approach. Am. Psychol. 47, 559–569. http://dx.doi.org/10.1037/0003-066X.47.4.559. Schacter, D.L.,Cooper, L.A.,Delaney, S.M., 1990. Implicit memory for unfamiliar objects depends on access to structural descriptions. J. Exp. Psychol. Gen. 119 (1), 5–24. http:// dx.doi.org/10.1037/0096-3445.119.1.5. Schneps, M.H.,Brockmole, J.R.,Sonnert, G.,Pomplun, M., 2012. History of reading struggles linked to enhanced learning in low spatial frequency scenes. PLoS ONE 7, e35724. http://dx.doi.org/10.1371/journal.pone.0035724. Schultz, R.T.,Cho, N.K.,Staib, L.H.,Kier, L.E.,Fletcher, J.M.,Shaywitz, S.E.,Shaywitz, B.A., 1994. Brain morphology in normal and dyslexic children; the influence of sex and age. Ann. Neurol. 35 (6), 732–742. http://dx.doi.org/10.1002/ana.410350615. Shankweiler, D., Crain, S., Katz, L., Fowler, A.E., Liberman, A.M., Brady, S.A., Shaywitz, B.A., 1995. Cognitive profiles of reading-disabled children: comparison of language skills in phonology, morphology, and syntax. Psychol. Sci. 6 (3), 149–156. http://dx.doi. org/10.1111/j.1467-9280.1995.tb00324.x. Shaywitz, S.E.,Shaywitz, B.A.,Pugh, K.R.,Fulbright, R.K.,Constable, R.T.,Mencl, W.E.,Gore, J.C., 1998. Functional disruption in the organization of the brain for reading in dyslexia. Proc. Natl. Acad. Sci. 95 (5), 2636–2641. http://dx.doi.org/10.1073/pnas.95.5.2636. Shaywitz, S.E., Shaywitz, B.A., Fulbright, R.K., Skudlarski, P., Mencl, W.E., Constable, R.T., Gore, J.C., 2003. Neural systems for compensation and persistence: young adult outcome of childhood reading disability. Biol. Psychiatry 54, 25–33. http://dx.doi.org/10. 1016/S0006-3223(03)01836-X. Siegel, L.,Ryan, E., 1989. Subtypes of developmental dyslexia: the influence of definitional variables. Read. Writ. 2, 257–287. http://dx.doi.org/10.1007/BF00377646. Simos, P.G.,Fletcher, J.M.,Foorman, B.R.,Francis, D.J.,Castillo, E.M.,Davis, R.N.,Fitzgerald, M., Mathes, P.G., Denton, C., Papanicolaou, 2002. Brain activation during the early stages of reading acquisition. J. Child Neurol. 17, 159–163. http://dx.doi.org/10.1177/ 088307380201700301. Sinatra, R., 1988. Styles of thinking and literacy proficiency for males disabled in print acquisition. Read. Psychol. 9, 33–50. http://dx.doi.org/10.1080/0270271880090104. Smith, M.,Coleman, J.,Dokecki, P.,Davis, E., 1977. WISC-R scores of learning disabled children. J. Learn. Disabil. 10 (7), 437–443. http://dx.doi.org/10.1177/002221947701000708. Soldan, A.,Mangels, J.A., Cooper, L.A., 2006. Evaluating models of object-decision priming: evidence from event-related potential repetition effects. J. Exp. Psychol. Learn. Mem. Cogn. 32 (2), 230–248. http://dx.doi.org/10.1037/0278-7393.32.2.230. Soldan, A.,Gazes, Y.,Hilton, H.J.,Stern, Y., 2008. Aging does not affect brain patterns of repetition effects associated with perceptual priming of novel objects. J. Cogn. Neurosci. 20 (10), 1762–1776. http://dx.doi.org/10.1162/jocn.2008.20130. Sperling, A.J., Lu, Z.L., Manis, F.R., 2004. Slower implicit categorical learning in adult poor readers. Ann. Dyslexia 54 (2), 281–303. http://dx.doi.org/10.1007/s11881-0040014-z. Sperling, A.J., Lu, Z.,Manis, F.R.,Seidenberg, 2006. Motion-perception deficits and reading: it's the noise, not the motion. Psychol. Sci. 17, 1047–1053. http://dx.doi.org/10.1111/j. 1467-9280.2006.01825.x. Stein, J., 2001. The sensory basis of reading problems. Dev. Neuropsychol. 20, 509–534. http://dx.doi.org/10.1207/S15326942DN2002_4. Stein, J., 2003. Visual motion sensitivity and reading. Dev. Neuropsychol. 41, 1785–1793. http://dx.doi.org/10.1016/S0028-3932(03)00179-9. Stoodley, C.J., Harrison, E.P.D., Stein, J.F., 2006. Implicit motor learning deficits in dyslexic adults. Neuropsychologia 44, 795–798. http://dx.doi.org/10.1016/j.neuropsychologia. 2005.07.009. Swanson, H.L., 1984. Semantic and visual memory codes in learning disabled readers. J. Exp. Child Psychol. 37, 124–140. http://dx.doi.org/10.1016/0022-0965(84)90062-6.
Szmalec, A., Loncke, M., Page, M., Duyck, W., 2011. Order or disorder? Impaired Hebb learning in dyslexia. J. Exp. Psychol. Learn. Mem. Cogn. 37 (5), 1270. http://dx.doi. org/10.1037/a0023820. Temple, E., Deutsch, G.K., Poldrack, R.A., Miller, S.L., Tallal, P., Merzenich, M.M., et al., 2003. Neural deficits in children with dyslexia ameliorated by behavioral remediation: evidence from functional MRI. Proc. Natl. Acad. Sci. 100, 2860–2865. http://dx.doi.org/ 10.1073/pnas.0030098100. Thomas, K.M., Hunt, R.H.,Vizueta, N.,Sommer, T., Durston, S., Yang, Y., Wordon, M.S., 2004. Evidence of developmental differences in implicit sequence learning: an fMRI study of children and adults. J. Cogn. Neurosci. 16 (8), 1339–1351. http://dx.doi.org/10. 1162/0898929042304688. Torgesen, J.,Wagner, R.,Rashotte, C., 1999. Test of Word Reading Efficiency. Pro-Ed, Austin, TX. Turkeltaub, P.E.,Gareau, L.,Flowers, D.L.,Zeffiro, T.A.,Eden, G.F., 2003. Development of neural mechanisms for reading. Nat. Neurosci. 6 (7), 767–773. http://dx.doi.org/10.1038/ nn1065. Ullman, M.T., 2004. Contributions of memory circuits to language: the declarative/procedural model. Cognition 92 (1), 231–270. http://dx.doi.org/10.1016/j.cognition.2003. 10.008. Vandenberg, S., Kuse, A., 1978. Mental rotation: A group test of three dimensional spatial visualization. Percept. Mot. Skills 47, 599–604. http://dx.doi.org/10.2466/pms.1978. 47.2.599. Vellutino, F.R.,Fletcher, J.M.,Snowling, M.J.,Scanlon, D.M., 2004. Specific reading disability (dyslexia): what have we learned in the past four decades? J. Child Psychol. Psychiatry 45, 2–40. http://dx.doi.org/10.1046/j.0021-9630.2003.00305.x. Vidyasagar, T.R., 2013. Reading into neuronal oscillations in the visual system: implications for developmental dyslexia. Front. Hum. Neurosci. 7, 811. http://dx.doi.org/10. 3389/fnhum.2013.00811. Vidyasagar, T.R., Pammer, K., 2010. Dyslexia: a deficit in visuo-spatial attention, not in phonological processing. Trends Cogn. Sci. 14 (2), 57–63. http://dx.doi.org/10.1016/ j.tics.2009.12.003. von Károlyi, C., 2001. Visual–spatial strength in dyslexia: rapid discrimination of impossible figures. J. Learn. Disabil. 34 (4), 380–391. http://dx.doi.org/10.1177/002221940103400413. von Károlyi, C., Winner, E., Gray, W., Sherman, G.F., 2003. Dyslexia linked to talent: global visual–spatial ability. Brain Lang. 85, 427–431. http://dx.doi.org/10.1016/S0093934X(03)00052-X. Wechsler, D., 1999. Wechsler Abbreviated Scale of Intelligence. Pearson, San Antonio. Willingham, D.B.,Salidis, J.,Gabrieli, J.D.E., 2002. Direct comparison of neural systems mediating conscious and unconscious skill learning. J. Neurophysiol. 88 (3), 1451–1460. http://dx.doi.org/10.1152/jn.00461.2001. Winner, E., 2000. The origins and ends of giftedness. Am. Psychol. 55 (1), 159–169. Winner, E., Casey, M., 1993. Cognitive profiles of artists. In: Cupchik, G., Laszlo, J. (Eds.), Emerging Visions: Contemporary Approaches to the Aesthetic Process. Cambridge University Press, Cambridge, UK. Winner, E.,Casey, M.,DaSilva, D.,Hayes, R., 1991. Spatial abilities and reading deficits in visual art students. Empir. Stud. Arts 9, 51–63. http://dx.doi.org/10.2190/528M-DXT5WUJA-W297. Winner, E., von Károlyi, C., Malinsky, D., French, L., Seliger, C., Ross, E., Weber, C., 2001. Dyslexia and visual–spatial talents: compensation vs. deficit model. Brain Lang. 76, 81–110. http://dx.doi.org/10.1006/brln.2000.2392. Wolf, M., Bowers, P.G., Biddle, K., 2000. Naming-speed processes, timing, and reading: a conceptual overview, j. Learn. Disabil 33 (4), 387–407. http://dx.doi.org/10.1177/ 002221940003300409. Wolff, U., Lundberg, I., 2002. The prevalence of dyslexia among art students. Dyslexia 8 (1), 34–42. http://dx.doi.org/10.1002/dys.211. Woodcock, R.W.,McGrew, K.S.,Schrank, F.A.,Mather, N., 2007. Woodcock–Johnson III Test of Achievement Normative Update. Riverside Publishing, Rolling Meadows, IL. Ziegler, J.C., Pech‐Georgel, C., George, F., Lorenzi, C., 2009. Speech‐perception‐in‐noise deficits in dyslexia. Dev. Sci. 12 (5), 732–745. http://dx.doi.org/10.1111/j.14677687.2009.00817.x.