Neural network based approximations to posterior densities: a class of flexible sampling methods with applications to reduced rank models ∗ Lennart F. Hoogerheide†, Johan F. Kaashoek & Herman K. van Dijk Econometric Institute, Erasmus University Rotterdam Econometric Institute Report EI 2004-19 April 2004
Abstract Likelihoods and posteriors of econometric models with strong endogeneity and weak instruments may exhibit rather non-elliptical contours in the parameter space. This feature also holds for cointegration models when near non-stationarity occurs and determining the number of cointegrating relations is a nontrivial issue, and in mixture processes where the modes are relatively far apart. The performance of Monte Carlo integration methods like importance sampling or Markov Chain Monte Carlo procedures greatly depends in all these cases on the choice of the importance or candidate density. Such a density has to be ‘close’ to the target density in order to yield numerically accurate results with efficient sampling. Neural networks seem to be natural importance or candidate densities, as they have a universal approximation property and are easy to sample from. That is, conditionally upon the specification of the neural network, sampling can be done either directly or using a Gibbs sampling technique, possibly using auxiliary variables. A key step in the proposed class of methods is the construction of a neural network that approximates the target density accurately. The methods are tested on a set of illustrative models which include a mixture of normal distributions, a Bayesian instrumental variable regression problem with weak instruments and near non-identification, a cointegration model with near non-stationarity and a two-regime growth model for US recessions and expansions. These examples involve experiments with non-standard, non-elliptical posterior distributions. The results indicate the feasibility of the neural network approach. Keywords: importance sampling, Markov chain Monte Carlo, neural networks, Bayesian inference. JEL classification: C11, C15, C45
∗
A preliminary version of this paper was presented at the 2003 ASA-meeting, ESEM and EC2 . We are indebted to several participants of these meetings for helpful comments. † Correspondence to: L.F. Hoogerheide, Econometric Institute, Erasmus University Rotterdam, P.O. Box 1738, NL-3000 DR Rotterdam, The Netherlands. E-mail:
[email protected]
1
1
Introduction
Markov Chain Monte Carlo (MCMC) methods like Metropolis-Hastings (MH) and Gibbs sampling are extensively used in Bayesian analyses of econometric and statistical models. The theory of Markov chain samplers starts with Metropolis et al. (1953) and Hastings (1970). An important technical paper on MCMC methods is due to Tierney (1994). Well-known econometric studies are provided by Chib and Greenberg (1996) and Geweke (1999). Indirect independence sampling methods such as importance sampling (IS) have also been successfully applied within Bayesian inference. Importance sampling, see Hammersley and Handscomb (1964), has been introduced in Bayesian inference by Kloek and Van Dijk (1978) and is further developed by Van Dijk and Kloek (1980,1984) and Geweke (1989). However, in practice, the convergence behavior of Monte Carlo methods is still often uncertain. The complex structure of a model or some extraordinary properties of the data may cause this problem. We mention three cases. A first example of a complex model is a set of equations with a near reduced rank structure for the matrix of coefficients. Then the Hessian of the likelihood function is almost singular. This may be due to strong endogeneity and weak instruments and/or due to near non-stationarity. We refer to the studies by Schotman and Van Dijk (1991) and Kleibergen and Van Dijk (1994, 1998). Convergence problems of importance sampling with a normal or Student t importance density are described by Van Dijk and Kloek (1984) and Geweke (1989). A second example is due to Hobert and Casella (1996). These authors show that the Gibbs sampler does not converge in the case of a hierarchical linear mixed model if the prior is uniform. The reason is that, although all conditional posteriors are proper, the joint posterior is not. Similar problems may occur in dynamic panel data models using diffuse priors. As a third case we mention a multi-modal target density, which one may encounter in mixture processes with a small number of observations around one of the different modes. This may cause problems for all methods. If the MH candidate density is uni-modal, with a low probability of drawing candidate values in one of the modes, then this mode may be completely missed, even if the sample size gets very large. In this case importance sampling with a uni-modal normal or Student t importance density may yield a sample in which most drawings have a negligible weight and only a few drawings almost completely determine the sampling results. So, an important problem is the choice of the candidate or importance density, especially when one knows little about the shape of the target density. In this paper we introduce a class of neural network sampling methods which allow for sampling from a target (posterior) distribution that may be multi-modal or skew, or exhibit strong nonlinear correlation among the parameters. That is, a class of methods to sample from non-elliptical distributions. The basic idea of the neural network sampling algorithms is simple. First, a neural network is constructed that approximates the target density. An important advantage of neural network functions is their ‘universal approximation property’. That is, neural network functions can provide approximations of any square integrable function to any desired accuracy, see Gallant and White (1989). As an application of Kolmogorov’s general superposition theorem, the neural network approximation property is eluded by Hecht-Nielsen (1987). Proofs concerning neural network approximations for specific configurations can be found in Gallant and White (1989), Hornik et al. (1989), and Leshno et al. (1993). Stinchcombe (1988,1989) shows that it is the presence of intermediate layers with sufficiently many parallel processing elements that is essential for feedforward networks to possess universal approximation capabilities, and that sigmoid activation functions are not necessary for universal approximation. This approximation property implies that the algorithm can handle certain ‘strange’ target distributions, like multi-modal, ex2
tremely skew, strongly correlated or fat-tailed distributions. Second, this neural network is used as an importance function in IS or as a candidate density in MH. Depending on the specification of the neural network, an important advantage of neural network densities is that they are easy to sample from. The proposed methods are applied on a set of illustrative examples. We start with a mixture of normal densities. Next we perform some experiments with a Bayesian analysis of an instrumental variable regression model and a cointegration model. Finally, we explore a switching model with recessions and expansions for the US real Gross National Product (GNP) growth. Our results indicate that the neural network approach is feasible in cases where a ‘standard’ MH, Gibbs or IS approach would fail or be rather slow. The outline of the paper is as follows. In section 2 we discuss how to construct a neural network approximation to a density, how to sample from a neural network density, and how to use these drawings within the IS or MH algorithm. In section 3 we describe a method yielding estimates of moments of the target distribution without requiring a sampling algorithm. Section 4 shows the feasibility of our approach in a simple example of a mixture of bivariate normal distributions. Section 5 illustrates our algorithms in an example with simulated data in an instrumental variable (IV) regression and a cointegration model. Section 6 contains an empirical example concerning a switching model for the quarterly growth rate of the real GNP in the USA. Conclusions are given in section 7 and technical details are given in the appendices.
2
Approximating with and sampling from neural networks
Consider a certain distribution, for example a posterior distribution, with density function p(x) with x ∈ Rn . The aim is to investigate some of the characteristics of p(x), for example the mean and/or covariance matrix of a random vector X ∼ p(x). The approach followed in this paper is: 1. Find a neural network approximation nn : Rn → R to the target density p(x). 2. Obtain a sample of random points from the density (kernel) nn(x). 3. Perform importance sampling or the Metropolis-Hastings algorithm using this sample in order to obtain estimates of the characteristics of p(x). Consider a 4-layer feed-forward neural network with functional form: nn(x) = eG2 (CG1 (Ax + b) + d) + f,
x ∈ Rn ,
(1)
where A is H1 × n, b is H1 × 1, C is H2 × H1 , d is H2 × 1, e is 1 × H2 and f ∈ R. The integers H1 and H2 are interpreted as the numbers of cells in the first and second hidden layer of the neural network, respectively. The vector functions G1 : RH1 → RH1 and G2 : RH2 → RH2 are defined by G1 (y) = (g1 (y1 ), · · · , g1 (yH1 ))0 and G2 (z) = (g2 (z1 ), · · · , g2 (zH2 ))0 (2) where g1 : R → R and g2 : R → R are the activation functions. A neural network is used because of its well-known universal approximation property, see e.g. Gallant and White (1989) and Hornik et al. (1989). Stinchcombe (1988) poses a sufficient condition for universal approximation capabilities for hidden layer activation functions other than sigmoid; for instance, this condition is satisfied by continuous probability densities. In the following sections, three specifications of (1) will be used:
3
Type 1 neural network: A standard three-layer feed-forward neural network (in the notation of (1): H2 = 1, e = 1, f = 0 and g2 is the identity g2 (y) = y). As activation function g1 in (2), we take the scaled arctangent function: g1 (y) =
1 1 arctan(y) + , π 2
y ∈ R.
(3)
The reason for this choice is that this activation function can be analytically integrated infinitely many times. We show in subsection 2.2.1, that this property makes the neural network, in the role of a density kernel, easy to sample from. Type 2 neural network: A simplified four-layer network of which the second hidden layer consists of only one cell (H2 = 1, e = 1, f = 0) and with g2 the exponential function: g2 (y) = exp(y),
y ∈ R.
(4)
In this case, the activation g1 in (2) is taken to be a piecewise-linear function, called plin: 0 y < −1/2 y + 1/2 −1/2 ≤ y ≤ 1/2 plin(y) = 1 y > 1/2
(5)
With these activation functions, the neural network function can be analytically integrated (once). We show in subsection 2.2.2, that this property makes Gibbs sampling, see e.g. Geman and Geman (1984), possible. To allow for easy sampling it is sufficient to specify a function g2 which is positive valued and has an analytical expression for its primitive that is analytically invertible; see subsection 2.2.2. Another example of such a function is the logistic function. Type 3 neural network: A mixture of Student t distributions: nn(x) =
H X
ph t(x|µh , Σh , ν),
(6)
h=1
where ph (h = 1, . . . , H) are the probabilities of the components and where t(x|µh , Σh , ν) is a multivariate t density with mode µh , scaling matrix Σh , and ν degrees of freedom: Γ((ν + n)/2) t(x|µh , Σh , ν) = |Σh |−1/2 Γ(ν/2)(πν)n/2
Ã
(x − µh )0 Σ−1 h (x − µh ) 1+ ν
!−(ν+n)/2 (7)
Note that this mixture of t densities is a four-layer feed-forward neural network (with parameter restrictions) in which we have, in the notation of (1), H2 = H (the number of t densities), H1 = Hn, activation functions g1 (y) = y 2
and
g2 (z) = z −(ν+n)
Γ((ν + n)/2) , Γ(ν/2)(πν)n/2
and weights eh = ph |Σh |−1/2 (h = 1, . . . , H), f = 0 and: 0 0 ··· ιn /ν −1/2 −1/2 −Σ1 µ1 Σ1 0 ι0n /ν .. .. A= , b = , C = . . .. .. . . −1/2 −1/2 −ΣH µH ΣH 0 ··· 0 4
0 .. . 0 ι0n /ν
, d = ιH ,
where ιk is a k × 1 vector of ones. Notice that (x − µh )0 Σ−1 h (x − µh ) is the sum of the squared −1/2 elements of Σh (x − µh ). The reason for this choice is that a mixture of t distributions is easy to sample from, and that the Student t distribution has fatter tails than the normal distribution. Table 1 gives an overview of the reasons for which we have chosen these particular specifications. The implications shown in this table will be clarified in the sequel of this paper.
Table 1: Motivation of the particular neural network specifications specification of nn(x)
Type 1
special properties of nn(x)
consequences of special properties of nn(x) - Direct sampling from nn(x) is possible.
- The activation function g is analytically integrable infinitely many times.
⇒
- Analytical expressions exist for the moments of the distribution with density nn(x).
- The activation function g is piecewise-linear.
Type 2
Type 3
- The function g2 is positive valued and analytically integrable, and its primitive is analytically invertible. - The function g2 is the exponential function. - The neural network function nn(x) is a mixture of multivariate t densities.
⇒
- Gibbs sampling from nn(x) is possible.
⇒
- Auxiliary variable Gibbs sampling from nn(x) is possible.
⇒
- Direct sampling from nn(x) is possible.
In the next subsections we discuss the three steps of our approach: construction of a neural network, sampling from it, and using the sample in IS or MH.
2.1
Constructing a neural network approximation to a density
First, we discuss a procedure to obtain a Type 1 or Type 2 neural network approximation. Second, we describe a method to construct a Type 3 neural network.
5
2.1.1
Constructing a Type 1 or Type 2 neural network approximation
We suggest the following procedure to obtain a Type 1 or Type 2 neural network approximation to a certain target density p(x). First we draw a set of random uniform points xi (i = 1, . . . , N ) in the bounded region to which we restrict the random variable X ∈ Rn to take its values. Then we approximate the target density p(x) with a neural network by minimizing the sum of squared residuals: N X ¡ i ¡ ¯ ¢¢2 SSR(A, b, c, d) = p(x ) − nn xi ¯ A, b, c, d . (8) i=1
We choose the smallest neural network, i.e. the one with the least hidden cells, that still gives a ‘good’ approximation to the target distribution. One could define a ‘good’ approximation as one with a high enough squared correlation R2 . After that, we check the squared correlation R2 between the neural network and the target density for a (much) larger set of points than the ‘estimation set’. If this R2 is also high enough, then we say that the approximation is accurate and the estimation set is large enough. In that case the network does not only provide a good approximation to the target density in the points xi (i = 1, . . . , N ) but also in between. Otherwise, we increase the number of points N and start all over again. For example, we make the set twice as large. This process continues until the set is large enough to allow the neural network to ‘feel’ the shape of the target density accurately. In the case of our Type 1 (three-layer) neural network, we also have to deal with the problem that the neural network function is not automatically non-negative for each x. In order to prevent this we add a penalty term to (8), and check for non-negativity between the points xi (i = 1, . . . , N ) afterwards. If nn(x) is negative for some x, we look for its most negative value, and subtract this negative value from the network’s constant d. In that way nn(x) becomes non-negative for each x, so that it is a proper density kernel (on the bounded domain to which we restrict it). In our Type 2 (simplified four-layer) neural network the exponential function, or any positive valued function g2 , implies that non-negativity is automatically taken care of. 2.1.2
Constructing a Type 3 neural network approximation
We suggest the following procedure to obtain a Type 3 neural network approximation to a certain target density. First we compute the mode µ1 and scaling matrix Σ1 of the first Student t distribution in our mixture as the maximum likelihood estimator µ1 = x ˆM L and its estimated covariance matrix: à !−1 ¯ δ 2 log p(x) ¯¯ Σ1 = cov(ˆ c xM L ) = − δxδx0 ¯x=ˆxM L Then we draw a set of points xi (i = 1, . . . , N ) from the ‘first stage neural network’ nn(x) = t(x|µ1 , Σ1 , ν), with small ν to allow for fat tails. After that we iteratively add components to the mixture by performing the following steps: Step 1: Compute the importance sampling weights w(xi ) and scaled weights w(x ˜ i ): w(xi ) =
p(xi ) nn(xi )
and
w(xi ) w(x ˜ i ) = PN i i=1 w(x )
(i = 1, . . . , N )
We make use of simple diagnostics like the weight of the 5% most influential points to determine the number of components of the mixture. If the importance sampling weights 6
pass the diagnostics, then we stop: the current nn(x) is our Type 3 neural network approximation. Otherwise, go to step 2. Step 2: Add another t distribution with density t(x|µh , Σh , ν) to the mixture, where µh and Σh are estimates of the mean and covariance matrix of the ‘residual distribution’ with density kernel: res(x) = max{p(x) − c nn(x), 0}, where c is a constant; we take max{., 0} to make it a (non-negative) density kernel. These estimates of the mean and covariance matrix are easily obtained by importance sampling with the current nn(x) as the candidate density, using the sample xi (i = 1, . . . , N ) from nn(x) that we already have. The weights wres (xi ) and scaled weights w ˜res (xi ) (i = 1, . . . , N ) are: wres (xi ) =
res(xi ) = max{w(xi ) − c, 0} nn(xi )
and
wres (xi ) w ˜res (xi ) = PN , i i=1 wres (x )
and µh and Σh are obtained as: µh =
N X
i
i
w ˜res (x )x
Σh =
i=1
N X
w ˜res (xi )(xi − µh )(xi − µh )0 .
i=1
There are two issues relevant for the choice of c. First, the new t density should appear at places where nn(x) is too small (relative to p(x)). Second, there should be enough points with w(xi ) > c in order to make Σh nonsingular. A procedure is to calculate Σh for c equal to 10 times the average value of w(xi ); if Σh is nonsingular, accept c, otherwise lower c. Step 3: We now choose the probabilities ph (h = 1, . . . , H) in the mixture nn(x) =
H X
ph t(x|µh , Σh , ν),
h=1
by minimizing the (squared) coefficient of variation of the importance sampling weights. First we draw N points xih from each component t(x|µh , Σh , ν) (h = 1, . . . , H). Then we minimize E[w(x)2 ]/E[w(x)]2 , where: E[w(x)k ] =
N H ¡ ¢k 1 XX ph w xih N
(k = 1, 2)
i=1 h=1
with
p(xih ) ¡ i ¢. h=1 ph t xh |µh , Σh , ν
¡ ¢ w xih = PH
Step 4: Draw a sample of N points xi (i = 1, . . . , N ) from our new mixture of t distributions: nn(x) =
H X
ph t(x|µh , Σh , ν)
(9)
h=1
and go to step 1; in order to draw a point from (9) we first use a drawing from the U (0, 1) distribution to determine which component t(x|µh , Σh , ν) is chosen, and then draw from this multivariate t distribution. 7
In step 3 it may occur that the latest t density t(x|µH , ΣH , ν) only gets a negligible probability (i.e. pH ≈ 0). In that case we start all over again with a larger number of points N . The idea behind this is that the larger N is, the easier it is for the method to ‘feel’ the shape of the target density, and to specify the t distributions of the mixture adequately.
2.2
Sampling from a neural network density
In the following subsections we discuss sampling from Type 1 and Type 2 networks. In the previous subsection we already remarked that sampling from a Type 3 network, a mixture of t densities, only requires a draw from the U (0, 1) distribution to determine which component is chosen, and a draw from the chosen multivariate t distribution. 2.2.1
Sampling from a Type 1 (three-layer) neural network density
Suppose the joint density kernel of a certain X ∈ Rn is given by a standard three-layer feedforward neural network function with an activation function that is analytically integrable infinitely many times. Since the neural network function is a linear combination of these activation functions, the neural network function itself is integrable infinitely many times. Hence one can directly sample from the neural network by iteratively drawing the elements Xi (i = 1, . . . , n) in the following way: Draw x1 from nn(x1 ) Draw x2 from nn(x2 |x1 ) Draw x3 from nn(x3 |x1 , x2 ) .. .
(10)
Draw xn from nn(xn |x1 , x2 , x3 , · · · , xn−1 ) where nn(x1 ), nn(x2 |x1 ), nn(x3 |x1 , x2 ), etc. are the marginal and conditional neural network densities corresponding to the joint density kernel nn(x). The marginal distribution function CDFnn (x1 ): R x1 R ∞ R∞ x1 , x2 , . . . , xn )dxn · · · dx2 d˜ x1 −∞ −∞ · · · −∞ nn(˜ R∞ , (11) CDFnn (x1 ) = R ∞ R ∞ x1 , x2 , . . . , xn )dxn · · · dx2 d˜ x1 −∞ −∞ · · · −∞ nn(˜ and the conditional distribution function CDFnn (x2 |x1 ) R x2 R ∞ R∞ ˜2 , . . . , xn )dxn · · · dx3 d˜ x2 −∞ −∞ · · · −∞ nn(x1 , x R∞ CDFnn (x2 |x1 ) = R ∞ R ∞ ˜2 , . . . , xn )dxn · · · dx3 d˜ x2 −∞ −∞ · · · −∞ nn(x1 , x
(12)
etc. can be evaluated analytically. An example of an activation function that can be analytically integrated infinitely many times, is the scaled arctangent function in (3). Some useful integration formulas for this activation function are given in appendices A.1 and A.2. So, one can easily sample from the density nn(x1 ) or nn(x2 |x1 ) in formulas (10) by drawing random variables Ui (i = 1, . . . , n) from the uniform distribution on [0, 1] and then finding the scalars xi (i = 1, . . . , n) for which U = CDFnn (x1 ), U = CDFnn (x2 |x1 ), etc. The calculation of xi (i = 1, . . . , n) is done numerically with an algorithm such as the bisection method.
8
2.2.2
Sampling from a Type 2 (simplified four-layer) neural network density
Suppose the joint density kernel of a certain X ∈ Rn is given by the Type 2 neural network with g2 the exponential function and g1 the piecewise-linear function in (5). It is fairly easy to perform Gibbs sampling from this distribution, as one can divide the (bounded) domain of each Xi (i = 1, . . . , n) into a finite number of intervals on which the conditional neural network density is just the exponent of a linear function. Therefore we can analytically integrate the conditional neural network density, and draw from it using the inverse transformation method. Note that the three properties of g2 mentioned below formula (5) are used here explicitly. Details are given in appendix B.1. The Gibbs sampling procedure consists of iteratively sampling from one-dimensional conditional distributions: Specify feasible starting values x0 = (x01 , · · · , x0n ). Do for j = 1, 2, . . . , m xj+1 from nn(x1 |xj2 , xj2 , · · · , xjn ) 1 j j xj+1 from nn(x2 |xj+1 2 1 , x3 , · · · , xn ) j+1 j j xj+1 from nn(x3 |xj+1 3 1 , x2 , x4 , · · · , xn ) .. .
(13)
j+1 j+1 j+1 xj+1 from nn(xn |xj+1 n 1 , x2 , x3 , · · · , xn−1 )
Under certain regularity conditions, the sequence {x0 , x1 , · · · , xj , · · · } converges to a sample from the distribution with joint density nn(x1 , . . . , xn ). It is also possible to use a different method to draw from a four-layer neural network density: auxiliary variable Gibbs sampling. Using this method, we do not have to restrict ourselves to the piecewise-linear activation function plin. It allows for well-known activation functions such as the logistic and scaled arctangent functions. Auxiliary variable Gibbs sampling is a Gibbs sampling technique, developed by Damien et al. (1999). The method is based on work of Edwards and Sokal (1988). In this method, latent variables are introduced in an artificial way in order to facilitate drawing from the full set of conditional distributions. Auxiliary variable Gibbs sampling is possible if the density kernel p can be decomposed as follows: K Y p(x) ∝ π(x) lk (x), (14) k=1
where π is a density kernel from which sampling is easy, and lk (k = 1, . . . , K) are non-negative functions of x ∈ Rn . Suppose a density kernel of X ∈ Rn is given by ½ nn(x) if xi ∈ [xi , x ¯i ] ∀i = 1, . . . , n pnn (x) = (15) 0 else where [xi , x ¯i ] is the interval to which Xi (i = 1, . . . , n) is restricted. This restriction ensures that (15) is a proper density kernel. The function nn(x) is given by: ÃH Ã n ! ! X X nn(x) = exp ch plin ahi xi + bh + d . (16) i=1
h=1
9
In Appendix B.2 it is shown that (15) and (16) can be written as (14) with π(x) =
n Y i=1
I {xi < xi < x ¯i } , Ã
lh (x) = exp ch plin
Ã
n X
(17) !!
ahi xi + bh
for h = 1, . . . , H,
(18)
i=1
where π(x) is the ‘easy’ density kernel of n independent variables Xi (i = 1, . . . , n) with distribution U (xi , x ¯i ). This means that we can draw from (15) and (16) using auxiliary variable Gibbs sampling. In the appendix it is shown that in this case auxiliary variable Gibbs sampling only requires sampling from uniform distributions, which is done easily and fast.
2.3
Importance sampling and Metropolis-Hastings
Once we have obtained a sample of random drawings from the neural network density nn(x), we use this sample in order to estimate those characteristics of the target density p(x) that we are interested in. Two methods that we can use for this purpose are importance sampling and the Metropolis-Hastings algorithm. A discussion of importance sampling can be found in Bauwens et al. (1999). Let X be a random variable with density p. Suppose we are interested in the expectation E(h(X)) for a certain function h : Rn → R. Then the importance sampling (IS) approach to obtain an estimate of E(h(X)) is: Step 1: Draw a sample of yi ’s (i = 1, . . . , m) from a ‘candidate distribution’ with density q, the so-called importance function. Step 2: The estimate of E(h(X)) is now given by: Pn w(yi )h(yi ) Pn hIS = i=1 , i=1 w(yi )
(19)
where w(x) ≡ p(x)/q(x) is the so-called weight function. The Metropolis-Hastings (MH) algorithm was introduced by Metropolis et al. (1953) and generalized by Hastings (1970). The algorithm samples from a time-reversible Markov chain, converging to the target distribution of the random variable X ∈ Rn that we are interested in. The MH algorithm constructs a Markov chain of m random vectors in the following way: Initialization: choose feasible vector x0 ∈ Rn . Do for j = 1, 2, . . . , m Obtain y from a ‘candidate’ density q(y|xj−1 ), where q(y|xj−1 ) is the ‘transition density’ that may depend on xj−1 . Compute the ‘acceptance probability’ α(xj−1 , y): ½ ¾ p(y)q(xj−1 |y) j−1 α(x , y) ≡ min ,1 p(xj−1 )q(y|xj−1 ) Obtain u from the uniform distribution on (0,1). 10
If u ≤ α(xj−1 , y) then xj = y else xj = xj−1 . A realized Markov chain can be used in a number of ways. One way is considering all realizations after a certain burn-in period, and using the sample statistics of these realizations as estimates of the characteristics of the distribution of X that we are interested in. Note that in the case of a four-layer neural network we need Gibbs sampling in order to obtain the sample, so that the consecutive drawings are not independent. In this case it is not efficient to use the Metropolis-Hastings algorithm. Therefore we have six ‘neural network based’ algorithms at hand: • Neural Network Importance Sampling (NNIS) and Neural Network Metropolis-Hastings (NNMH) in which IS or MH is performed using random vectors that are (directly) drawn from a 3-layer neural network; • Gibbs Neural Network Importance Sampling (GiNNIS) and Gibbs with Auxiliary Variables Neural Network Importance Sampling (GiAuVaNNIS) in which IS is performed using random vectors that are drawn from a 4-layer neural network by Gibbs sampling (possibly with auxiliary variables); • IS or MH using random vectors that are (directly) drawn from an Adaptive Mixture of t distributions (AdMit-IS or AdMit-MH). Table 2 gives an overview. Table 2: Overview of neural network based sampling algorithms
Type 1 (3-layer) neural network: direct sampling Type 2 (4-layer) neural network: (auxiliary variable) Gibbs sampling Type 3 neural network (adaptive mixture of t densities): direct sampling
3
Importance sampling
MetropolisHastings
NNIS
NNMH
Gi(AuVa)NNIS
-
AdMit-IS
AdMit-MH
Analytical expressions for moments of the three-layer neural network distribution
There exist analytical expressions for the moments of the 3-layer neural network distribution with the scaled arctangent activation function, just like the expressions for the marginal and 11
conditional distribution functions that make direct sampling possible. The formulas are derived in appendix A.3. This feature of the 3-layer neural network makes the following algorithm possible if one only wants estimates of certain moments of the target distribution: Step 1: Construct a 3-layer neural network function nn(x) that gives a good approximation to the target density p(x). Step 2: Compute the moments of the neural network distribution using the formulas in appendix A.3. These moments provide estimates of those moments of the target density p(x) that one is interested in. In this case no sampling algorithm like MH or IS is needed. As in this case the neural network output is not ‘corrected’ by MH or IS, the neural network has to be a very accurate approximation to the target density. Otherwise its moments are inaccurate approximations. In Hoogerheide, Kaashoek and van Dijk (2003) this method is discussed more elaborately.
4
Example I: Generalizations of the bivariate normal distribution
In order to illustrate the neural network based algorithms in simple examples, we consider two generalizations of the bivariate normal distribution: (1) a mixture of two normal distributions and (2) the conditionally normal distribution of Gelman and Meng (1991).
4.1
A mixture of two normal distributions
Consider the following mixture of normal distributions: ¶ µµ ¶ µ ¶¶ µµ ¶ µ ¶¶ µ −5 1 0 5 1 0 X1 ∼ 0.5 N , + 0.5 N , , X2 −5 0 1 5 0 1
(20)
We use our algorithms in order to obtain estimates of the mean and standard deviation of X1 and X2 , and the correlation coefficient ρ(X1 , X2 ). For the Type 1 and 2 networks, we restrict the variables X1 and X2 to the interval [-10,10], i.e. we only consider the region {(X1 , X2 )| − 10 ≤ X1 ≤ 10, −10 ≤ X2 ≤ 10} .
(21)
This restriction does not affect our estimates, as the probability mass outside this region is negligible. First we use the approach described in subsection 2.1 in order to construct a Type 1 (3-layer) neural network approximation to the target density. We find a 3-layer neural network with H = 48 hidden cells which has a squared correlation R2 = 0.985 with the target density on a set of 2500 points on the region (21), and also R2 = 0.985 on a set of 5000 points. We also construct a Type 2 (simplified 4-layer) neural network approximation to the target density. We find a 4-layer network with H = 10 hidden cells with R2 = 0.988 on the estimation set and R2 = 0.984 on the larger set. Note the large difference between the sizes of the 3-layer network and the 4-layer network. The 3-layer network requires 5 times as many hidden cells. This suggests that the exponential transformation in the 4-layer network makes it much easier to construct an approximation to the target density. Then we construct a Type 3 (mixture of t distributions) neural network. We choose ν = 1 degree of freedom. We find a mixture of two t distributions with a sample of IS weights in which the 5% most influential points have 11.4% weight. 12
The contourplots of the neural network approximations are given by Figure 1, together with the contourplot of the target density. These contourplots confirm that the neural networks are good approximations to the target density. After we have constructed neural network approximations, we sample from these networks and use the samples in IS or MH. For the Type 1 and 2 networks we construct two samples, and we say that convergence has been achieved if the differences between the two estimated means of X1 and X2 are both less than 0.05. The results are in Table 3. Note that the six neural network sampling algorithms – NNIS, NNMH, GiNNIS, GiAuVaNNIS, AdMit-IS and AdMit-MH – all yield estimates differing less than 0.05 from the real values. The analytical expressions for the moments of the 3-layer neural network also yield quite good estimates, although not as good as the six neural network sampling algorithms. NNIS and NNMH require only 50000 drawings, whereas GiNNIS and GiAuVaNNIS require 200000 and 1000000 drawings, respectively. The reason for this is that NNIS and NNMH use a sample of uncorrelated points obtained by direct sampling, whereas GiNNIS and GiAuVaNNIS use Gibbs sequences in which the points are correlated. The first order serial correlations of the Gibbs sequences of X1 ’s are 0.90 and 0.97 in GiNNIS and GiAuVaNNIS, respectively. Apparently the addition of auxiliary variables increases the serial correlation in the Gibbs sequence, which explains why 1000000 points are needed instead of 200000. In this case AdMit-IS and AdMit-MH only use 25000 independent drawings obtained by direct sampling. If we look at the computing times (on an AMD AthlonTM 1.4 GHz processor) required for generating the samples, we conclude that AdMit-IS and AdMit-MH are the winners in this example. In AdMit-IS or AdMit-MH the construction of the network, the sampling, and the IS or MH require altogether 4.5 seconds, whereas the other methods take much more time to generate an adequate sample, and also require time to estimate a network. Among the methods using a Type 1 or 2 network, the GiNNIS algorithm is the fastest. The NNIS and NNMH algorithms are relatively slow, as these methods require a numerical method, such as the bisection method, in order to perform the inverse transformation method. The total weight of the 5% most influential points is below 15% for the three IS algorithms, confirming the quality of the importance density. The rather high NNMH and AdMit-MH acceptance rates of 67% and 56% indicate the quality of the neural network as a candidate density. We now compare the performance of the neural network algorithms with the performance of IS and MH with a Student t candidate distribution with 1 degree of freedom, and with the Griddy-Gibbs sampler (see Ritter and Tanner (1992)) using a grid of 10 equidistant points on (21). For the purpose of this example, we ignore the fact that the target distribution is a mixture of normal distributions from which direct sampling and Gibbs sampling are possible. All sampling 6
6
6
6
4
4
4
4
2
2
0
x2 0
–2
–2
–2
–4
–4
–4
–6
–6
2
2
x2 0
x2 0
–2 –4 –6 –6
–4
–2
0
x1
2
4
6
x2
–6
–4
–2
0
2
4
6
–6 –6
x1
–4
–2
0 x1
2
4
6
–6
–4
–2
0
x1
2
4
6
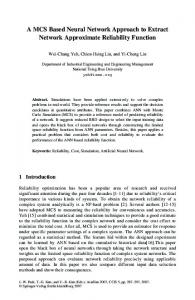
Figure 1: Contourplots: the density of the mixture of two normal distributions in (20) (left), and its Type 1 (second), Type 2 (third), and Type 3 (right) neural network approximation 13
methods in this example only require that one can evaluate a kernel of the target density. Again we construct two samples, and we say that convergence has been achieved if the differences between the two estimated means of X1 and X2 are both less than 0.05. As the Griddy-Gibbs sequences hardly ever move from one mode to the other, a naive Griddy-Gibbs approach would take extremely much time to converge. Therefore we decide to use a number of Griddy-Gibbs sequences of 100 points (plus 10 burn-in points) with different initial values that are drawn from a uniform distribution on (21): 5000 sequences are needed to reach convergence. The results are in Table 4. Note the large numbers of drawings required by IS and MH. Although the results of the three methods converge to the real values, more time is needed than in our AdMit-IS and AdMit-MH procedures. We conclude that the neural network approach is feasible, and that AdMit-IS and AdMit-MH are faster than three competing algorithms. Table 3: Neural network based sampling results for the mixture of two bivariate normal distributions in (20) real values 0 0 5.099 5.099 0.962
NNIS
NNMH
analytical moments 0.063 0.063 5.088 5.101 0.968
GiNNIS
E(X1 ) 0.024 0.011 E(X2 ) 0.022 0.012 σ(X1 ) 5.106 5.102 σ(X2 ) 5.103 5.099 ρ(X1 , X2 ) 0.962 0.962 drawings 50000 50000 time 568 s 568 s time/draw 11 ms 11 ms 5% weights 8.0% acc. rate 67% * The computing times for the AdMit methods concern construction of the neural networks.
0.035 0.040 5.097 5.104 0.962 200000 56 s 0.28 ms 7.4%
GiAuVa NNIS -0.048 -0.047 5.099 5.097 0.962 1000000 172 s 0.17 ms 7.4%
AdMit IS -0.024 -0.015 5.084 5.098 0.962 25000 4.5 s * 0.18 ms 11.4%
AdMit MH -0.029 -0.006 5.090 5.104 0.961 25000 4.5 s * 0.18 ms 56%
the whole procedure including the
Table 4: Alternative sampling results for the mixture of bivariate normal distributions in (20)
E(X1 ) E(X2 ) σ(X1 ) σ(X2 ) ρ(X1 , X2 ) drawings time time/draw 5% weights acc. rate
4.2
real values 0 0 5.099 5.099 0.962
t1 IS
t1 MH
0.033 0.032 5.099 5.101 0.961 1500000 27.5 s 0.02 ms 54.1%
-0.048 -0.019 5.097 5.072 0.962 2500000 47.5 s 0.02 ms
Griddy Gibbs 0.017 0.021 5.117 5.118 0.954 5000 × 100 81.4 s 0.16 ms
34 %
A conditionally normal distribution
It may seem a little unfair to use a mixture of normal distributions in order to test a method in which the target density is approximated with a mixture of t densities. Therefore we also apply our AdMit-IS and AdMit-MH methods to another distribution, a bivariate conditionally normal distribution.
14
Let X1 and X2 be two jointly distributed random variables, for which X1 is normally distributed given X2 and vice versa. Then the joint distribution, after location and scale transformations in each variable, can be written as (see Gelman and Meng (1991)): µ ¶ ¤ 1£ 2 2 2 2 p(x1 , x2 ) ∝ exp − Ax1 x2 + x1 + x2 − 2Bx1 x2 − 2C1 x1 − 2C2 x2 (22) 2 We consider the symmetric case in which A = 1, B = 0, C1 = C2 = 10, with conditional distributions µ ¶ µ ¶ 10 10 1 1 X1 |X2 = x2 ∼ N , X2 |X1 = x1 ∼ N , . 1 + x22 1 + x22 1 + x21 1 + x21 We find a mixture of four t distributions with a sample of IS weights in which the 5% most influential points have 11.5% weight. The contourplots of the neural network approximations are given by Figure 2. The results are in Table 5. We compare the performance of the AdMit algorithms with the performance of IS and MH with a t1 candidate distribution, and with the Griddy-Gibbs sampler using a grid of 100 equidistant points on [−5, 15] × [−5, 15]. We construct two samples, and we say that convergence has been achieved if the differences between the two estimated means of X1 and X2 are both less than 0.10. For the purpose of this example, we ignore the fact that Gibbs sampling from this target distribution is possible; it should be remarked that one would need more than one sequence to avoid extremely slow convergence, as the Gibbs sequences that we generated remained in one mode for 100000000 drawings. So, again all sampling methods only require that one can evaluate a kernel of the target density. The results are in Table 5. Notice the huge numbers of drawings required by IS and MH. Again all results have converged to the real values, but the AdMit-IS and AdMit-MH methods are faster than the three alternative sampling methods. 12 12
10 10
8
8
x2 6
x2 6
4
4
2
2
0
0
0
2
4
6
8
10
12
0
2
4
x1
6
8
10
12
x1
Figure 2: Contourplots: the density of the conditionally normal distribution in (22) with A = 1, B = 0, C1 = C2 = 10 (left), and its Type 3 neural network approximation (right)
5
Example II: Bayesian analysis of models with reduced rank
In this section we consider posterior densities for simulated data in two models with reduced rank: an instrumental variable (IV) regression and a vector error correction model (VECM) with cointegration.
5.1
Bayesian analysis of an IV regression
First, we give two examples of well-known IV regressions. Consider the stylized wage regression popular in empirical labor studies: y1 = βy2 + x1 γ + u1 , 15
(23)
Table 5: Sampling results for the conditionally normal distribution real values 4.946 4.946 4.894 4.894 -0.979
AdMit IS 4.907 4.986 4.893 4.894 -0.979 100000 237 s * 2.4 ms 11.5%
AdMit MH 4.889 5.001 4.891 4.893 -0.979 100000 237 s * 2.4 ms
t1 IS
t1 MH
Griddy Gibbs 4.961 4.912 4.883 4.883 -0.978 10000 × 100 1415 s 1.4 ms
E(X1 ) 4.963 4.865 E(X2 ) 4.913 5.022 σ(X1 ) 4.881 4.896 σ(X2 ) 4.900 4.902 ρ(X1 , X2 ) -0.979 -0.979 drawings 80000000 80000000 time 1652 s 1652 s time/draw 0.02 ms 0.02 ms 5% weights 59.4 % acc. rate 59 % 28 % * The computing times for the AdMit methods concern the whole procedure including the construction of the neural network.
where y1 is the log of hourly wage, y2 denotes education and x1 captures work experience – all in deviations from their mean values. The structural parameter of interest is β, the rate of return to schooling. However, in order to make inference on β, one should take into account that y2 is possibly endogenous: y2 and u1 may be highly correlated owing to the omission of a variable measuring (unobservable) ability, which is expected to be highly correlated with education. The problem is that potential instruments for y2 are hard to find as these variables must be correlated with education but uncorrelated with unobserved ability. Angrist and Krueger (1991) suggest using quarter of birth as a dummy variable, as this seems uncorrelated with ability and affects years of schooling weakly, through a combination of the age at which a person begins school and the compulsory education laws in a person’s state. Staiger and Stock (1997) show that inference on the rate of return to schooling can be greatly affected by the weak quarter of birth instruments. As another example, consider the problem of determining the fraction of temporary income consumers spend in a permanent-income-consumption model. Campbell and Mankiw (1989) use the simple regression equation ∆c = β∆y + u1 , (24) where c is log consumption and y is log income; β measures the fraction of temporary income consumed. As consumption and income are simultaneously determined, ∆y is possibly highly correlated with u1 . In the permanent-income model c and y are cointegrated with cointegrating vector (1,-1) and the error correction model for ∆y suggests using lagged values of ∆y and ∆c and the lagged error correction term, c−y, as instruments. However, ∆y is poorly predicted from this error correction model, so that the suggested instruments are probably fairly weak. Note that in this example the quality of the instruments is determined by the short-run dynamics in the growth rate of income. In our example, we consider the following equation y1t = y2t β + u1t (t = 1, . . . , T )
(25)
where y2t is a possibly endogenous regressor for which we have y2t = xt π + v2t (t = 1, . . . , T )
(26)
with (u1t , v2t ) ∼ N (0, Σ) and where xt is exogenous. We assume a diffuse prior for the parameters β, π and Σ: p(β, π, Σ) ∝ |Σ|−h/2 , h > 0 (27) 16
The likelihood function for a sample of size T is ·
−T /2
L(β, π, Σ|y1 , y2 , x) ∝ |Σ|
¸ 1 −1 0 exp − tr(Σ U U ) , 2
(28)
where U = (˜ u1 (β), v˜2 (π)) with u ˜1 (β) = y1 − y2 β and v˜2 (π) = y2 − xπ. So, the joint posterior based on the diffuse prior is ¸ · 1 −1 0 −(T +h)/2 p(β, π, Σ|y1 , y2 , x) ∝ |Σ| exp − tr(Σ U U ) . (29) 2 Using properties of the inverted Wishart distribution (see Zellner (1971) and Bauwens and Van Dijk (1989)), Σ−1 can be analytically integrated out of the joint posterior yielding the following joint posterior for (β, π): p(β, π|y1 , y2 , x) ∝ |U 0 U |−(T +h−3)/2 . (30) Choosing h = 3 results in the following posterior density p(β, π|y1 , y2 , x) ∝ |U 0 U |−T /2 ,
(31)
which equals the concentrated likelihood function of β and π. In this example we are interested in the (posterior) distribution of the vector (β, π). So, the parameter vector (β, π) plays the role of the random vector X in the previous sections, and p(β, π|y1 , y2 , x) plays the role of p(x). Now we simulate T = 20 data from the model in (25) and (26) with β = 0, π = 0.1, xt ∼ N (0, 1) i.i.d. and ¶ µµ ¶ µ ¶¶ µ 0 1 0.99 u1t ∼N , (t = 1, . . . , T ) v2t 0 0.99 1 Note the extremely high correlation ρ(u1t , v2t ) = 0.99, causing a very strong endogeneity of the regressor y2 in equation (25). Also note the low value of π = 0.1, so that x is a weak instrument for y2 . That is, there is ‘weak identification’. Notice that in this IV regression, β is not identified if π = 0 (unless cov(u1t , v2t ) is known). We restrict β to the interval [−5, 5] and π to the interval [−0.25, 0.25]; we have to make such a restriction, as otherwise the posterior density would be improper, i.e. its integral would not be finite. Figure 3 shows the contourplot of the posterior density in (31) for our simulated data set. In this case of weak identification and strong endogeneity the contours of the posterior are non-elliptical: we see a bimodal density with two curved ridges. If π is close to zero, large (positive and negative) values of β may occur, which reflects that β is not identified if π = 0. Van Dijk (2003) shows several cases of simulated IV regressions in which such non-elliptical contours occur. We use our neural network algorithms to obtain estimates of the posterior means and standard deviations. We find a Type 1 (3-layer) network with H = 43 hidden cells with R2 = 0.931 on an estimation set of 2500 points (and R2 = 0.930 on a set of 5000 points), and a Type 2 (simplified 4-layer) network with H = 10 hidden cells with R2 = 0.933 on the estimation set (and R2 = 0.927 on the larger set). Note that the 4-layer network is much smaller than the 3-layer network, just like in the first example. We also find a Type 3 (mixture of t distributions) network with H = 9 components in which the weight of the 5% most influential points is 23%. The contourplots are given by Figure 3. After we have constructed neural network approximations, we sample from these networks and use the samples in IS or MH. For the Type 1 and 2 networks we construct two samples, and 17
beta
4
4
4
4
2
2
2
2
0
beta
–2
0
beta
–2
–4
–0.1
0
0.1
0.2
–4
–4
–0.2
pi
–0.1
0
0.1
0.2
0
–2
–2
–4
–0.2
beta
0
–0.2
–0.1
pi
0
0.1
0.2
–0.2
–0.1
0 0.05 0.1 0.15
pi
pi
Figure 3: Contourplots: the posterior density in an IV regression in (31) for a simulated data set (left), and its Type 1 (second), Type 2 (third) and Type 3 (right) neural network approximation
Table 6: Neural network based sampling results for the Bayesian IV regression NNIS π
NNMH
analytical moments -0.01 0.12 0.49 2.49
GiNNIS
AdMit IS -0.01 0.11 0.64 2.35 10000 132.6 s * 13 ms 23%
AdMit MH -0.01 0.10 0.69 2.39 10000 132.6 s * 13 ms
mean -0.01 -0.01 -0.01 s.d. 0.10 0.10 0.11 β mean 0.65 0.65 0.67 s.d. 2.37 2.38 2.34 drawings 25000 25000 100000 time 261 s 261 s 28 s time/draw 10 ms 10 ms 0.28 ms 5% weights 9% 10 % acc. rate 59% 39 % * The computing times for the AdMit methods concern the whole procedure including the construction of the neural network.
Table 7: Maximum likelihood estimates in an IV regression Parameter: MLE: (std. error)
π -0.05 (0.23)
β 3.36 (11.09)
Table 8: Alternative sampling results for the Bayesian IV regression
π
mean s.d. β mean s.d. drawings time time/draw 5% weights acc. rate
normal candidate IS MH -0.07 -0.07 0.03 0.03 2.96 2.97 0.95 0.94 100000000 100000000 2312 s 2312 s 0.02 ms 0.02 ms 69% 6.8%
18
t1 candidate IS MH -0.01 -0.01 0.10 0.10 0.65 0.65 2.36 2.38 25000000 60000000 517 s 1288 s 0.02 ms 0.02 ms 92% 1.9%
Griddy Gibbs -0.01 0.10 0.62 2.37 200000 283 s 1.4 ms
5
5
pi × beta
pi × beta
4
4
3
3
2
2
1
1
0
0
−1
−1
−2
−2
−3
−3 −4
−4
−0.25
−0.20
−0.15
−0.10
−0.05
0.00
0.05
0.10
0.15
0.20
0.25
−0.25
−0.20
−0.15
−0.10
−0.05
0.00
0.05
0.10
0.15
0.20
0.25
Figure 4: Scatter plots: samples of points (π, β) from the posterior density (31) in the IV regression, obtained by NNMH (left) and MH with a normal candidate distribution (right) we say that convergence has been achieved if the differences between the two estimated posterior means of β and π are less than 0.05 and 0.005, respectively. The sampling results are in Table 6. We now compare the performance of the neural network algorithms with the performance of IS and MH with the maximum likelihood estimator’s asymptotic distribution as the candidate density. Recall that the asymptotic distribution of θˆM L can be approximated with: ¯ µ ³ ´−1 ¶ ³ ´ δ 2 log L(θ) ¯¯ ˆ ˆ ˆ ˆ ˆ N θM L , I θM L , I θM L = − (32) δθδθ0 ¯θ=θˆM L The maximum likelihood estimates are given by Table 7. The estimated correlation is very high: ρˆ(ˆ πM L , βˆM L ) = 0.9985. The sampling results are in Table 8. Note the large differences between the neural network algorithms and IS or MH with the normal candidate – not even after 100 million drawings the results of the normal candidate have converged to the same values. The scatter plots in Figure 4 of the NNMH and MH samples reveal the reason for these differences: NNMH yields a fine sample showing the contours of the joint posterior density, whereas MH with the normal candidate density completely misses one of the two modes. Table 8 also shows the results of IS and MH with a Student t distribution with 1 degree of freedom around the maximum likelihood estimator, and with Griddy-Gibbs (with 100 grid points). These methods yield approximately the same estimates as the neural network based methods; however, they take more time than the AdMit approach. Note that IS and MH with a Student t candidate density require huge amounts of drawings to reach convergence. We conclude that the neural network sampling algorithms seem to work well in this example (yielding approximately the same estimates). The analytical expressions for the moments of the 3-layer neural network also yield quite good estimates, although not as good as the other neural network methods. In this example IS or MH with the maximum likelihood estimator’s asymptotic distribution as the candidate distribution does not yield reliable estimates. AdMit-IS and AdMit-MH are the fastest among these algorithms.
5.2
Bayesian analysis of a VECM with cointegration
Many economic time series seem to follow random walk processes. A random walk implies that one cannot forecast any future changes of the series. When random walks are independent then the different series will tend to move in different directions. However, in practice it is observed that there exist stationary relationships between series that individually behave as random walks. Some examples are: short and long term interest rates, prices and dividends of stocks, consumption and income. This stylized fact is referred to as cointegration. 19
First, we mention some well-known cointegration studies that are based on economic theory. Campbell and Shiller (1987) study bubbles in asset prices. Campbell (1987) tests the hypothesis that consumption is determined by permanent income. King, Plosser, Stock and Watson (1991) consider the role of productivity shocks in the postwar US economy. Hall, Anderson and Granger (1992) analyze the term structure of interest rates. Consider the following two-dimensional VAR(1) model yt = Ayt−1 + εt
(t = 1, . . . , T ),
(33)
where yt = (y1t , y2t )0 and εt = (ε1t , ε2t )0 ∼ N (0, Σ). Define Π = A − I, then one can rewrite (33) in error correction form as: ∆yt = Πyt−1 + εt
(t = 1, . . . , T ).
(34)
Suppose the matrix Π is singular, i.e. |Π| = 0, and that it has rank one. This implies that the characteristic equation |I − zA| = 0 has one unit root and one root z outside the unit circle. The consequence of one unit root and one root outside the unit circle can be shown as follows. Given that the rank of Π is one, one can write Π = αβ 0 where α and β are 2 × 1 vectors. Thus we have ∆yt = αβ 0 yt−1 + εt
(t = 1, . . . , T ).
(35)
It follows directly that the linear combination β 0 yt is an AR(1) process with β 0 yt = (1 + β 0 α)β 0 yt−1 + β 0 εt
(t = 1, . . . , T ),
(36)
which is stationary if |1 + β 0 α| < 1. It can be shown that this inequality is satisfied if the characteristic equation |I − zA| = 0 has one unit root and one root z outside the unit circle. Thus the vector yt is cointegrated in the sense that a linear combination is stationary. The vector β is defined as the cointegration vector. It is seen from (35) and (36) that the cointegrating vector is defined up to a scale constant, that is, if β 0 yt is stationary then λβ 0 yt is stationary for any λ ∈ R. A usual normalization is β 0 = (1, −β2 ). The coefficients α1 and α2 are defined as adjustment parameters. Then we can rewrite (35) as: µ ¶ µ ¶ µ ¶ ∆y1t α1 ε1t = (y1,t−1 − β2 y2,t−1 ) + (t = 1, . . . , T ). (37) ∆y2t α2 ε2t In our example we analyze the posterior of the parameters in (37) for a simulated data set. We assume a diffuse prior for the parameters α1 , α2 , β2 and Σ: p(α1 , α2 , β2 , Σ) ∝ |Σ|−h/2 , h > 0.
(38)
The likelihood function for a sample of size T is ·
−T /2
L(α1 , α2 , β2 , Σ|y1 , y2 ) ∝ |Σ|
¸ 1 −1 0 exp − tr(Σ E E) , 2
(39)
where E = [˜ ε1 (α1 , β2 ), ε˜2 (α2 , β2 )] with ε˜1 (α1 , β2 ) = ∆y1 − α1 (y1 − β2 y2 ) and ε˜2 (α2 , β2 ) = ∆y2 − α2 (y1 − β2 y2 ). So, the joint posterior based on the diffuse prior is · ¸ 1 −(T +h)/2 −1 0 p(α1 , α2 , β2 , Σ|y1 , y2 ) ∝ |Σ| exp − tr(Σ E E) . (40) 2 20
Again, Σ−1 can be analytically integrated out of the joint posterior yielding the following joint posterior for (α1 , α2 , β2 ): p(α1 , α2 , β2 |y1 , y2 ) ∝ |E 0 E|−(T +h−3)/2 .
(41)
Choosing h = 3 results in the following posterior density p(α1 , α2 , β2 |y1 , y2 ) ∝ |E 0 E|−T /2 ,
(42)
which equals the concentrated likelihood function of α1 , α2 and β2 . In order to make (42) a proper density kernel, we restrict α1 ,α2 to [-0.2,0.2] and β2 to [-10,10]. Now we simulate T = 100 data from the model in (37) with α1 = −0.05, α2 = 0.05, β2 = 1 and ε1t , ε2t ∼ N (0, 1) i.i.d. (and mutually independent). Notice that in this cointegration model β2 is not identified if α1 = α2 = 0. We use AdMit-IS and AdMit-MH to obtain estimates of the posterior means and standard deviations. We find a Type 3 (mixture of t distributions) network with H = 4 components in which the weight of the 5% most influential points is 14.8%. The contourplots of the marginal candidate densities of (α1 , α2 ), (α1 , β2 ) and (α2 , β2 ) are given by Figure 5. Figure 6 shows scatter plots of points obtained by AdMit-MH. We compare the performance of AdMit-IS and AdMit-MH with IS and MH with a Student t distribution with 1 degree of freedom around the maximum likelihood estimator, and with Griddy-Gibbs (with 100 grid points). We construct two samples, and we say that convergence has been achieved if the differences between the three estimated posterior means of α1 , α2 and β2 are less than 0.005, 0.005 and 0.05, respectively. Table 9 shows the results. Note that IS and MH with Student t candidate density again require very large amounts of drawings to reach convergence. We conclude that AdMit-IS and AdMit-MH are much faster than the alternative algorithms, while all methods yield approximately the same estimates. It can be seen from the scatter plots in Figure 6 that if both α1 and α2 are close to zero, then a whole spectrum of values of β2 may occur. This reflects the fact that β2 is not identified if α1 = α2 = 0. Also notice the similarity in the mathematical structure of the IV regression and the VAR model with cointegration; in both models the same kind of identification issue may lead to the same sort of non-elliptical contours of the likelihood and posterior density. See also Hoogerheide and Van Dijk (2001) on the similarity of the Anderson-Rubin overidentification test and the Johansen test for cointegration.
0.1
10
10
8
8
6
6
4
0.05
4
2
alpha2
beta2
beta2
2
0
0
0
–2
–2 –4
–4
–0.05
–6
–6
–0.15
–0.1
–0.05
alpha1
0
0.05
–8 –0.2
–0.15
–0.1
–0.05 alpha1
0
0.05
0.1
–0.1
–0.05
0
0.05
0.1
0.15
0.2
alpha2
Figure 5: Contourplots: the Type 3 neural network approximation to the posterior density (42) in the VECM in the α1 × α2 plane (left), the α1 × β2 plane (middle), and the α2 × β2 plane (right).
21
10.0
10.0 0.150
alpha2 × alpha2
alpha1 × beta2
alpha1 × alpha2
0.125
7.5
7.5
5.0
5.0
2.5
2.5
0.0
0.0
−2.5
−2.5
0.100 0.075 0.050 0.025 0.000 −0.025 −0.050
−5.0
−5.0 −0.075 −0.200 −0.175 −0.150 −0.125 −0.100 −0.075 −0.050 −0.025
0.000
0.025
0.050
−0.200 −0.175 −0.150 −0.125 −0.100 −0.075 −0.050 −0.025
0.000
0.025
0.050
−0.08 −0.06 −0.04 −0.02
0.00
0.02
0.04
0.06
0.08
0.10
0.12
0.14
Figure 6: Scatter plots: sample of points (α1 , α2 , β2 ) from the posterior density (42) in the VECM, obtained by AdMit-MH and displayed in the α1 × α2 plane (left), the α1 × β2 plane (middle), and the α2 × β2 plane (right) Table 9: Sampling results for the Bayesian analysis of a VECM
α1
AdMit IS -0.07 0.04 0.03 0.03 1.20 0.64 50000 93 s 1.9 ms 14.8 %
AdMit MH -0.07 0.04 0.03 0.03 1.20 0.67 50000 93 s 1.9 ms
t1 IS
t1 MH
Griddy Gibbs -0.07 0.04 0.03 0.03 1.19 0.69 50000 364 s 7.2 ms
mean -0.07 -0.07 s.d. 0.04 0.04 α2 mean 0.03 0.03 s.d. 0.03 0.03 β2 mean 1.21 1.19 s.d. 0.67 0.64 drawings 15000000 25000000 time 660 s 1116 s time/draw 0.04 ms 0.04 ms 5% weights 26.1% acc. rate 64% 41% * The computing times for the AdMit methods concern the whole procedure including the construction of the neural network.
6
Example III: Bayesian analysis of a switching model for the quarterly growth rate of the real US GNP
In models for the growth rate of the gross national product one often allows for separate regimes for periods of recession and expansion. One problem that Bayesian analyses of such models may suffer from is the non-convergence of conventional sampling methods. The reason for this is the possible multi-modality of the posterior distribution. We consider the most simple model, a static 2-regime mixture model. In this model the growth rate yt has two different mean levels: ½ β1 + εt with probability p yt = , (43) β2 + εt with probability 1 − p where εt ∼ N (0, σ 2 ). For identification we assume that β1 < β2 , so that β1 and β2 can be interpreted as the mean growth rates during recessions and expansions, respectively. The prior densities of the parameters β1 and β2 are taken uniform on the set of values for which β1 < β2 , and zero elsewhere. The prior on p is taken uniform on the interval [0, 1], while for σ the uninformative prior π(σ) ∝ 1/σ is used. The underlying data we consider are the quarterly growth rates of the real US GNP in the period 1959-2001. The data are shown in Figure 7. The maximum likelihood estimates of the parameters are given by Table 10.
22
We use the neural network algorithms in order to obtain estimates of the posterior mean and standard deviation of β1 , β2 , σ and p. Looking at the graph of the quarterly growth rate and the maximum likelihood estimates, we choose to restrict the parameters to the following intervals: β1 ∈ [−3, 1], β2 ∈ [0.5, 2], σ ∈ [0.5, 1] and p ∈ [0, 1]. We construct a Type 2 (simplified 4-layer) neural network approximation to the target density; we find a network with H = 15 hidden cells with an R2 = 0.87 on an estimation set of 250000 points and R2 = 0.86 on a set of 500000 points. We also find a Type 3 (mixture of t distributions) network with H = 5 components in which the weight of the 5% most influential points is 35%. After we have constructed neural network approximations, we sample from these networks and use the samples in IS or MH. First we compare the results with IS and MH with a normal or t1 distribution around the maximum likelihood estimator, and with Griddy-Gibbs (with 50 grid points). These sampling methods only require that one can evaluate a kernel of the target density. We construct two samples, and we say that convergence has been achieved if the differences between the four estimated posterior means are less than 0.05. Table 11 and 12 show the results. Even after 25 million drawings IS and MH with the normal candidate distribution yield completely different results than the other algorithms. The other methods yield approximately the same results, where AdMit-IS and AdMit-MH are the fastest. Estimates of the marginal posterior densities obtained by GiNNIS, GiAuVaNNIS, AdMit-MH and IS with a normal candidate distribution are given by Figures 8, 9, 10 and 11, respectively. real US GNP (level)
8000
6000
4000
1960
1965
1970
1975
1980
1985
1990
1995
2000
1975
1980
1985
1990
1995
2000
real US GNP (growth)
2
0
−2 1960
1965
1970
Figure 7: Real GNP of the USA in billions of dollars (above), and its quarterly growth rate in % (below). Table 10: Maximum likelihood estimates in the 2-regime mixture model (43) Parameter: MLE: (std. error)
β1 -1.01 (0.51)
β2 0.93 (0.08)
23
σ 0.79 (0.06)
p 0.05 (0.04)
Note the large differences between IS with a normal candidate distribution and the other methods, especially in the marginal densities of β1 and p. The IS estimates indicate a much smaller posterior probability that β1 ≈ 0.8, and almost zero probability that p exceeds 0.25. This explains why the estimated posterior means of β1 and p are much smaller according to IS with a normal candidate distribution. In this model we can also perform Gibbs sampling from the posterior distribution, if we use the method of data augmentation of Tanner and Wong (1987). Data augmentation is used in order to sample from models with latent variables Z, in which sampling the parameters θ seems very difficult, but sampling θ given Z is straightforward. In this algorithm, the parameters θ are drawn conditionally on the latent variables Z, and the latent variables Z are drawn conditionally on θ. Forgetting the values of Z, this procedure yields a valid Markov chain for the parameters θ. In our model we define the latent variables Zt (t = 1, . . . , T ) as: ½ 1 if period t is a recession period Zt = . (44) 0 if period t is an expansion period Conditionally on these latent variables Z (and each other), β1 and β2 are normally distributed, while σ 2 and p have an inverted gamma and a beta distribution, respectively. Conditionally on the values of the parameters, the latent variables Zt (t = 1, . . . , T ) have a Bernoulli distribution. The results are in Table 12. Data augmentation estimates of the marginal posterior densities are given by Figure 12. Note that Gibbs sampling with data augmentation requires much more
Table 11: Neural network based sampling results for the 2-regime mixture model (43) GiNNIS
GiAuVaNNIS
Admit IS mean s.d. -0.22 0.84 1.00 0.19 0.84 0.06 0.26 0.29 10000 40 s * 4.0 ms 34%
Admit MH mean s.d. -0.22 0.85 0.99 0.18 0.84 0.07 0.26 0.28 10000 40 s * 4.0 ms
mean s.d. mean s.d. β1 -0.24 0.84 -0.26 0.83 β2 0.99 0.17 0.98 0.15 σ 0.84 0.07 0.83 0.07 p 0.24 0.27 0.22 0.25 drawings 400000 800000 time 269 s 421 s time/draw 0.67 ms 0.53 ms 5% weights 31% 32% acc. rate 31 % * The computing times for the AdMit methods concern the whole procedure including the construction of the neural network.
Table 12: Alternative sampling results for the 2-regime mixture model (43)
β1 β2 σ p drawings time time/draw 5% weights acc. rate
normal candidate IS MH mean s.d. mean s.d. -0.72 0.67 -0.73 0.67 0.93 0.08 0.93 0.08 0.82 0.06 0.82 0.06 0.07 0.05 0.07 0.05 25000000 25000000 2292 s 2292 s 0.09 ms 0.09 ms 40% 45%
t1 candidate IS MH mean s.d. mean s.d. -0.25 0.84 -0.21 0.85 0.99 0.17 0.98 0.15 0.83 0.06 0.84 0.07 0.25 0.28 0.27 0.30 10000000 15000000 873 s 1321 s 0.09 ms 0.09 ms 61% 18%
24
Griddy Gibbs mean s.d. -0.17 0.84 1.01 0.20 0.84 0.06 0.27 0.29 10000 131 s 13 ms
Data Augmentation mean s.d. -0.21 0.84 1.00 0.20 0.84 0.07 0.26 0.29 400000 42 s 0.11 ms
0.75
Density
Density
4
beta1
beta2
3 0.50 2 0.25 1
−3 Density
−2
−1
0
1
0.50
0.75 Density
sigma
4
4
2
2
0.6
1.00
1.25
1.50
1.75
p
0.7
0.8
0.9
1.0
0.00
0.25
0.50
0.75
1.00
Figure 8: GiNNIS estimates of the marginal posterior densities in the 2-regime mixture model (43)
0.75
Density
Density
beta1
beta2
3 0.50 2 0.25 1
−3 Density 6
−2
−1
0
1
0.50
0.75 Density
sigma
1.00
1.25
1.50
1.75
p
4 4
2
2
0.6
0.7
0.8
0.9
1.0
0.00
0.25
0.50
0.75
1.00
Figure 9: GiAuVaNNIS estimates of the marginal posterior densities in the 2-regime mixture model (43)
beta1
beta2 4
0.75 3 0.50 2 0.25
1
−3 sigma
−2
−1
0
1 5
0.75 p
1.00
0.00
0.25
1.25
1.50
1.75
2.00
6 4 3
4
2 2 1
0.7
0.8
0.9
1.0
0.50
0.75
1.00
Figure 10: AdMit-MH estimates of the marginal posterior densities in the 2-regime mixture model (43)
25
0.6
Density
Density
beta1
beta2
5 4
0.4
3 2
0.2
1 −3 Density
−2
−1
0
1
0.5 Density 10.0
sigma
1.0
1.5
2.0
2.5
p
6 7.5 4 5.0 2
2.5
0.5
0.6
0.7
0.8
0.9
1.0
0.0
0.2
0.4
0.6
0.8
1.0
Figure 11: IS estimates (with a normal candidate distribution) of the marginal posterior densities in the 2-regime mixture model (43)
beta1
beta2
1.00 3 0.75 2
0.50
1
0.25
6
−3 sigma
−2
−1
0
1
0.50
p
0.75
1.00
1.25
1.50
1.75
2.00
4
4
2
2
0.6
0.7
0.8
0.9
1.0
1.1
0.0
0.2
0.4
0.6
0.8
1.0
Figure 12: Data augmentation estimates of the marginal posterior densities in the 2-regime mixture model (43)
26
drawings than the Griddy-Gibbs sampler. The reason for this is that the addition of latent variables increases the serial correlation in the Gibbs sequence: the serial correlations in the Gibbs sequences of p’s are 0.992 and 0.854 in data augmentation and Griddy-Gibbs, respectively. We conclude that data augmentation yields about the same results as our neural network methods, while the AdMit procedures are even slightly faster than data augmentation, which requires more knowledge of the model – AdMit only requires that one can evaluate a kernel of the target density. Finally, consider another 2-regime mixture model for the growth rates yt of the real US GNP: ½ β11 + β12 yt−1 + εt with probability p yt = , (45) β21 + β22 yt−1 + εt with probability 1 − p where εt ∼ N (0, σ 2 ). For identification we assume that β11 < β21 . The prior densities of the parameters β11 , β12 , β21 and β22 are taken uniform on the set of values for which β11 < β21 , and zero elsewhere. The prior on p is taken uniform on the interval [0, 1], while for σ the uninformative prior π(σ) ∝ 1/σ is used. In this case we find a Type 3 (mixture of t distributions) network with H = 7 components in which the weight of the 5% most influential points is 68.7%. We compare the results with IS and MH with a t1 candidate distribution. If we perform IS and MH with a t1 distribution around the maximum likelihood estimator, where we require the estimated posterior means for two samples to differ no more than 0.10, then convergence has not been reached after 25000000 drawings. However, if we draw 2000000 points from the t1 distribution around the maximum likelihood estimator, and iteratively update the mean and covariance matrix, then we reach convergence after 10 iterations. Table 13 shows the results. The methods yield approximately the same results, where the AdMit procedures require less drawings and time. Estimates of the marginal posterior densities are given by Figures 13 and 14. Figure 15 shows scatter plots of points obtained by AdMit-MH. Note the bimodality in the marginal distribution of p and the non-elliptical contours in the scatter plots; this causes the slow convergence of IS and MH with a t1 candidate distribution. Table 13: Sampling results for the 2-regime mixture model in (45) Admit IS mean s.d. 0.15 0.56 0.44 0.20 1.35 0.76 -0.05 0.41 0.82 0.06 0.59 0.36 25000 314 s * 13 ms 68.7 %
Admit MH mean s.d. 0.17 0.54 0.45 0.20 1.32 0.75 -0.05 0.40 0.82 0.06 0.60 0.35 25000 314 s * 13 ms
IS
MH
mean s.d. mean s.d. β11 0.06 0.71 0.09 0.62 β12 0.40 0.27 0.43 0.25 β21 1.30 0.79 1.29 0.75 β22 -0.03 0.40 -0.04 0.38 σ 0.82 0.06 0.82 0.06 p 0.55 0.38 0.56 0.37 drawings 10 × 2000000 10 × 2000000 time 1320 s 1320 s time/draw 0.07 ms 0.07 ms 5% weights 98.2 % acc. rate 8.2 % 1.5 % * The computing times for the AdMit methods concern the whole procedure including the construction of the neural network.
27
Density
2
3
beta11
Density beta12
2 1 1
−2.0 −1.5 Density
−1.0
−0.5
0.0
0.5
1.0
beta21
1.0
−0.25 Density 1.5
0.00
0.25
0.50
0.75
1.00
beta22
1.0 0.5 0.5 0
1
Density
2
3
4
−1.0 Density
sigma
7.5
−0.5
0.0
0.25
0.50
0.5
1.0
p
2
5.0 1
2.5 0.7
0.8
0.9
1.0
0.00
0.75
1.00
Figure 13: AdMit-MH estimates of the marginal posterior densities in the 2-regime mixture model in (45) Density
Density
beta11
2
3
beta12
2 1 1 −2.5 −2.0 −1.5 −1.0 −0.5 0.0 Density
1.5
0.5
1.0
−0.75 −0.50 −0.25 0.00 Density beta22 2
beta21
0.25
0.50
0.75
1.00
1.0 1 0.5
0
Density
1
2
3
4
−1.0 Density
sigma
7.5
3
5.0
−0.5
0.0
0.25
0.50
0.5
1.0
p
2
2.5
1
0.6
0.7
0.8
0.9
1.0
0.00
0.75
1.00
Figure 14: MH estimates of the marginal posterior densities in the 2-regime mixture model (45) 1.0
p × beta22
beta12 × beta22
beta11 × p
beta11 × beta21
0.9
3.5
0.8 3.0
0.75
0.75
0.50
0.50
0.25
0.25
0.7 2.5
0.6
2.0
0.5
0.00
0.00
0.4
−0.25
−0.25
−0.50
−0.50
−0.75
−0.75
1.5
0.3 1.0
0.2 0.1
0.5 −1.75
−1.50
−1.25
−1.00
−0.75
−0.50
−0.25
0.00
0.25
0.50
0.75
−1.75
−1.50
−1.25
−1.00
−0.75
−0.50
−0.25
0.00
0.25
0.50
−0.3 −0.2 −0.1
0.75
0.0
0.1
0.2
0.3
0.4
0.5
0.6
0.7
0.8
0.9
1.0
0.0
0.1
0.2
0.3
0.4
0.5
0.6
0.7
0.8
0.9
1.0
Figure 15: Scatter plots: points (β11 , β12 , β21 , β22 , σ, p) from the posterior distribution in the mixture model (45), obtained by AdMit-MH and displayed in the β11 × β12 plane (left), the β11 × p plane (second), the β12 × β22 plane (third) and the p × β22 plane (right)
7
Conclusion
In this paper we have introduced a class of neural network sampling algorithms. In these algorithms neural network functions are used as an importance or candidate density in importance sampling or the Metropolis-Hastings algorithm. Neural networks are natural importance or candidate densities, as they have a universal approximation property and are easy to sample from. We have shown how to sample from three types of neural networks. One can sample directly
28
from a certain 3-layer network. Using a 4-layer network one can, depending on the specification of the network, either use a Gibbs sampling approach or sample directly from a mixture of distributions. A key step in the proposed class of methods is the construction of a neural network that approximates the target density accurately. The methods have been tested on a set of illustrative models which include a Bayesian instrumental variable regression problem with weak instruments and near non-identification, a cointegration model and a two-regime growth model for US recessions and expansions. In our examples, involving experiments with non-standard, non-elliptical posterior distributions, the 4-layer network specified as the mixture of t distributions performs the best among the exposed sampling procedures. It is the fastest and moreover the most reliable neural network algorithm, whereas some other algorithms such as the Gibbs sampler, MH and IS fail or are very slow. These results indicate the feasibility and the possible usefulness of the neural network approach. We emphasize that it is naive to expect one sampling method to dominate in all practical cases. We suggested a strategy in which a sophisticated network is specified for complex, non-elliptical densities, while in a relatively simple case of near-elliptical contours a unimodal density or a bimodal mixture may be sufficiently accurate as candidate density. Clearly, more work is needed in this area. We end this paper with some remarks on how to extend the proposed techniques. First, one may consider other ways of specifying and estimating neural networks. We mention here the following possible extensions. One may pursue the construction of well-behaved neural networks with other activation functions which are more smooth than the piecewise-linear one. We noted in section 2 that it is possible to perform auxiliary variable Gibbs sampling from a 4-layer neural network density with a scaled arctangent instead of the piecewise-linear function. One may also investigate the effects of substituting the exponential function in the second hidden layer by a different function such as the logistic function. One may also, as a first step, transform the posterior density function to a more regular shape. This line of research is recently pursued by, e.g., Bauwens, Bos, Van Dijk and Van Oest (2004) in a class of adaptive direction sampling (ADS) methods. A combination of ADS and neural network sampling may be of interest. In practice, one encounters cases where only part of the posterior density is ill-behaved. Then one may combine the neural network approach for the ‘difficult part’ with a Gibbs sampling approach for the regular part of the model. In recent work Richard (1998) and Liesenfeld and Richard (2002) constructed an efficient importance sampling technique where the estimation of the parameters of the importance function is done in a sequence of optimization steps. Second, more experience is needed with empirical econometric models like business cycle models as specified by Hamilton (1989) and Paap and Van Dijk (2002), stochastic volatility models as given by Shephard (1996), and dynamic panel data models; see Pesaran and Smith (1995). Third, the neural network approximations proposed in this paper may be useful for modelling volatility in financial series, see e.g. Donaldson and Kamstra (1997), and for evaluating option prices, see Hutchinson, Lo and Poggio (1994). We intend to report on this in future research.
29
A
Sampling from a three-layer neural network distribution and computing its moments
Appendix A.1 gives analytical expressions for the integrals of the arctangent function. Appendix A.2 shows how these expressions are used in order to sample from a three-layer neural network distribution. In appendix A.3 these expressions are used to obtain analytical expressions for the moments of a three-layer neural network distribution. For a more elaborate appendix with more detailed derivations we refer to Hoogerheide, Kaashoek and van Dijk (2002).
A.1
A simple analytical expression for the integrals of the arctangent function
Theorem A.1: The n-th integral of the arctangent function Jn (x) Z Z Jn (x) ≡ · · · arctan(x)dx · · · dx is given by Jn (x) = pn (x) arctan(x) + qn (x) ln(1 + x2 ) + rn (x),
(46)
where pn and qn are polynomials of degree n and n − 1, respectively: pn (x) = pn,0 + pn,1 x + · · · + pn,n−1 xn−1 + pn,n xn qn (x) = qn,0 + qn,1 x + · · · + qn,n−1 xn−1 The coefficients pn,k (k = 0, 1, . . . , n) and qn,k (k = 0, 1, . . . , n − 1) are given by: (−1)(n−k)/2 (−1)(n−k+1)/2 if n − k is even if n − k is odd (n−k)!k! 2(n−k)!k! pn,k = qn,k = 0 if n − k is odd 0 if n − k is even
(47)
The polynomial rn (of degree at most n − 1) plays the role of the integrating constant. Proof: We will prove this theorem by induction. First, note that for n = 1 the proposition holds, as we have by partial integration: Z 1 arctan(x)dx = x arctan(x) − ln(1 + x2 ), (48) 2 Now suppose that our proposition holds for a certain positive integer n. Then we have to show that this implies that the proposition also holds for n + 1. First, note that for any non-negative integer k partial integration yields: Z Z 1 1 xk+1 k k+1 x arctan(x)dx = x arctan(x) − dx, k+1 k+1 1 + x2 (49) Z Z k+2 1 2 x xk ln(1 + x2 )dx = xk+1 ln(1 + x2 ) − dx. k+1 k+1 1 + x2 Second, notice that a partial fraction decomposition yields: P(m−2)/2 (−1)i m−1−2i Z (−1)m/2 arctan(x) + i=0 if m is even, m m−1−2i x x dx = 1 + x2 2) P(m−3)/2 (−1)i m−1−2i (−1)(m−1)/2 ln(1+x + i=0 if m is odd. 2 m−1−2i x 30
(50)
We may omit the polynomials in (50), since these would eventually be absorbed by the irrelevant polynomial rn in formula (46), anyway. The induction assumption is that for a certain n it holds that: Jn (x) = (pn,0 + pn,1 x + . . . + pn,n xn ) arctan(x) ¡ ¢ + qn,0 + qn,1 x + . . . + qn,n−1 xn−1 ln(1 + x2 )
(51)
where the coefficients pn,k (k = 0, 1, . . . , n) and qn,k (k = 0, 1, . . . , n − 1) are given by (47). It follows from (49) and (50) that: Z Jn+1 (x) = Jn (x)dx µ ¶ pn,1 2 pn,n n+1 = pn+1,0 + pn,0 x + x + ... + x arctan(x) 2 n+1 ³ qn,1 2 qn,n−1 n ´ + qn+1,0 + qn,0 x + x + ... + x ln(1 + x2 ) 2 n Note that Jn+1 (x) has the shape of formula (46) with pn+1,k = pn,k−1 /k (k = 1, . . . , n + 1) and qn+1,k = qn,k−1 /k (k = 1, . . . , n). Combining this with the induction assumption, it is easy to see the validity of the formulas for pn+1,k and qn+1,k for k ≥ 1. Now we only have to prove that pn+1,0 and qn+1,0 are also given by (47). From (49) and (50) we have: pn+1,0 =
X {k|1≤k≤n;k
X (−1)(k+1)/2 2(−1)(k+2)/2 − pn,k + − qn,k . k+1 k+1 {k|0≤k≤n−1;k even} odd}
(52)
If n is even, all pn,k ’s and qn,k ’s in the two summations of (52) are equal to zero, so that in that case pn+1,0 = 0. If n is odd, we have: pn+1,0 =
X {k|1≤k≤n;k
X (−1)(n+3)/2 (−1)(n+1)/2 − + , − (n − k)!(k + 1)! (n − k)!(k + 1)! {k|0≤k≤n−1;k even} odd}
(53)
which can be rewritten as: pn+1,0
µ ¶ n (−1)(n+1)/2 (−1)(n+1)/2 X n+1 k (−1) = = , k+1 (n + 1)! (n + 1)!
(54)
k=0
where the last equality of (54) follows from Newton’s binomium. The proof for qn+1,0 is similar. We conclude that pn+1,0 and qn+1,0 are also given by (47), so that we have proved the theorem by induction. 2
31
A.2
The marginal and conditional distribution functions corresponding to a three-layer neural network density
Suppose the random vector X = (X1 , . . . , Xn )0 has the following density p(x1 , . . . , xn ): ¯i ∀ i = 1, . . . , n nn(x1 , . . . , xn ) if xi ≤ xi ≤ x p(x1 , . . . , xn ) = 0 else
(55)
where [xi , x ¯i ] is the interval to which the variable xi (i = 1, 2, . . . , n) is restricted, and where nn(x1 , . . . , xn ) is the following three-layer neural network function: H X ch
nn(x1 , . . . , xn ) =
h=1
π
H
arctan(a0h x
1X + bh ) + ch + d. 2
(56)
h=1
Then the cumulative distribution function of X is given by: Z x˜n Z x˜2 Z x˜1 CDFX (˜ x1 , . . . , x ˜n ) = ··· nn(x1 , . . . , xn )dx1 dx2 · · · dxn xn
x2
Z
x1
Z x˜2 Z x˜1 ch x˜n = ··· arctan(a0h x + bh )dx1 dx2 · · · dxn π xn x2 x1 h=1 ! Ã H 1X ch + d x1 x2 · · · xn . + 2 H X
(57)
h=1
d(a0h x
Using the fact that dx1 = following change of variables: Z x˜1 arctan(a0h x + bh )dx1 = x1
=
1 ah1
+ bh )/ah1 (for constant values of x2 , . . . , xn ), we make the Z
ah1 x ˜1 +a0h,−1 x−1 +bh
ah1 x1 +a0h,−1 x−1 +bh
arctan(a0h x + bh )d(a0h x + bh )
¤ 1 £ J1 (ah1 x ˜1 + a0h,−1 x−1 + bh ) − J1 (ah1 x1 + a0h,−1 x−1 + bh ) , ah1
where we define ah,−1 = (ah2 , . . . , ahn )0 and x−1 = (x2 , . . . , xn )0 . If we continue in this way, we obtain the following formula: Z x˜n Z x˜2 Z x˜1 ··· arctan(a0h x + bh )dx1 dx2 · · · dxn = (58) xn
=
x2
x1
1 1 X X 1 ··· (−1)D1 +D2 +···+Dn Jn (ah1 x1,D1 + · · · + ahn xn,Dn + bh ) ah1 ah2 · · · ahn D1 =0 Dn =0
where we define xi,0 = x ˜i and xi,1 = xi (i = 1, 2, . . . , n), the upper and lower bounds of the integration intervals. The primitive Jn (x) is given by Theorem A.1 in appendix A.1. Substituting (58) into (57) yields: Ã H ! 1X CDFx (˜ x1 , . . . , x ˜n ) = ch + d x1 x2 · · · xn + 2 h=1
+
H X h=1
1 1 X X ch ··· (−1)D1 +···+Dn Jn πah1 ah2 · · · ahn D1 =0 Dn =0
32
à n X i=1
! ahi xi,Di + bh
.
(59)
The marginal distribution functions CDFXj (xj ) (j = 1, . . . , n) are now obtained by taking x ˜i = x ¯i ∀i = 1, . . . , n; i 6= j: CDFXj (xj ) = CDFx (¯ x1 , . . . , x ¯j−1 , xj , x ¯j+1 , . . . , x ¯n ).
(60)
The Pn conditional CDF of Xj given Xj+1 , . . . , Xn is derived in a similar way, simply by substituting i=j+1 ahi xi + bh for bh and treating the neural network as a function of x1 , . . . , xj . As we have explicit formulas for the marginal and conditional distribution functions, it is easy to sample a random vector from a three-layer neural network density with (scaled) arctangent activation function. We can use the numerical inverse transformation method in the following way: Step 1: Draw n independent U(0,1) variables U1 , U2 , . . . , Un . Step 2: Draw Xn from its marginal distribution by computing the value of Xn such that CDFXn (Xn ) = Un (using, for example, the bisection method). Step 3: For j = n−1, n−2, . . . , 1 iteratively draw Xj from its conditional distribution on Xj+1 , . . . , Xn by computing the value of Xj such that CDF (Xj |Xj+1 , . . . , Xn ) = Uj .
A.3
Analytical expressions for the moments of a three-layer neural network distribution
Suppose the vector X = (X1 , . . . , Xn )0 has the three-layer neural network density p(x1 , . . . , xn ) given by (55) and (56). Then the expectation of Xnk (k = 1, 2, . . .) is given by: E(Xnk ) = Z x¯nZ x¯n−1Z = ··· xn
xn−1
x ¯1
x1
xkn nn(x1 , . . . , xn )dx1 · · · dxn−1 dxn
H X
1 1 X X £ ch (−1)D1 +···+Dn−1 × = ··· πah1 · · · ah,n−1 D1 =0 Dn−1 =0 h=1 ! # Ãn−1 Z x¯n X × xkn Jn−1 ahi xi,Di + ahn xn + bh dxn
à +
1 2
H X h=1
! ch + d
xn
(61)
i=1
1 (¯ x1 − x1 ) · · · (¯ xn−1 − xn−1 )(¯ xk+1 − xk+1 n n ), k+1
where we define xi,0 = x ¯i and xi,1 = xi (i = 1, 2, . . . , n − 1), the upper and lower bounds of the integration intervals. We now make use of the following theorem: Theorem A.2: If the n-th integral of a certain function f : R → R is given by Jn : R → R, then it holds for ah , x ∈ Rn , bh ∈ R and k = 0, 1, 2, . . . that: Z xki
Jn (a0h x
¶ k µ 1 m k! 1 X − xk−m Jn+1+m (a0h x + bh ). + bh )dxi = ahi ahi (k − m)! i
(62)
m=0
Proof: We will prove this theorem by induction with respect to k. First, note that for k = 0 we have: Z Z 1 1 0 Jn (ah x + bh )dxi = Jn (a0h x + bh )d(a0h x + bh ) = Jn+1 (a0h x + bh ), ahi ahi 33
which clearly corresponds to Theorem A.2 for k = 0. Now suppose that our proposition holds for a certain nonnegative integer k. Then we have to show that this implies that the proposition also holds for k + 1. Partial integration with xk+1 as the factor to be differentiated yields: i Z Z k+1 k+1 k+1 1 0 0 Jn+1 (ah x + bh ) − xi Jn (ah x + bh )dxi = xi xki Jn+1 (a0h x + bh )dxi . (63) ahi ahi The induction assumption is that Theorem A.2 holds for the value k. Using this induction assumption we rewrite the second term of (63) as: Z 1 − (k + 1) xki Jn+1 (a0h x + bh )dxi = ahi ¶ k+1 µ 1 j (k + 1)! 1 X − = xk+1−j Jn+1+j (a0h x + bh ) (64) ahi ahi (k + 1 − j)! i j=1
Adding (64) to the first term of (63) yields: Z xk+1 Jn (a0h x i
¶ k+1 µ 1 X 1 j (k + 1)! xk+1−j Jn+1+j (a0h x + bh ) + bh )dxi = − ahi ahi (k + 1 − j)! i j=0
which is just equation (62) with k + 1 instead of k. We conclude that we have proved Theorem A.2 by induction. 2
Substituting equation (62) of Theorem A.2 into (61) now yields E(Xnk ), which can be easily adjusted to the general case of E(Xik ) (i = 1, 2, . . . , n) by taking ahi and xi instead of ahn and xn : E(Xik )
1 1 X X £ ch ··· (−1)D1 +···+Dn × = πah1 · · · ahn D1 =0 Dn =0 h=1 !# Ã n µ ¶ k X X 1 m k! × − xk−m Jn+m ahi xi,Di + bh ahi (k − m)! i m=0 i=1 Ã H ! n Y 1X 1 k+1 + ch + d (¯ xk+1 − x ) (¯ xj − xj ) i 2 k+1 i H X
h=1
j=1;j6=i
34
(65)
In a similar fashion it can be derived that E(Xi Xj ) (i, j = 1, 2, . . . , n; i 6= j) is equal to: E(Xi Xj ) =
H X
1 1 X X ch ··· (−1)D1 +···+Dn × πah1 · · · ahn D1 =0 Dn =0 h=1 " Ã n ! X ahi xi,Di + bh × xi xj Jn i=1
à n ! X ahi xi + ahj xj Jn+1 ahi xi,Di + bh − ahi ahj i=1 à n !# X 1 + Jn+2 ahi xi,Di + bh ahi ahj i=1 à H ! n Y 1X 1 2 + ch + d (¯ xi − x2i )(¯ x2j − x2j ) (¯ xk − xk ). 2 4 h=1
(66)
k=1;k6=i,j
Using formulas (65) and (66), one can easily compute statistics of a three-layer feed-forward neural network distribution, such as mean, variance, skewness, kurtosis, covariances and correlations.
B
Sampling from a four-layer neural network distribution
Appendix B.1 discusses how to draw from a four-layer neural network distribution using Gibbs sampling. Appendix B.2 shows another way to draw from a four-layer neural network: auxiliary variable Gibbs sampling.
B.1
Gibbs sampling from a four-layer neural network distribution
Suppose a density kernel of X ∈ Rn is given by ½ nn(x) if xi ∈ [xi , x ¯i ] ∀i = 1, . . . , n p(x) = 0 else
(67)
where [xi , x ¯i ] is the interval to which Xi (i = 1, . . . , n) is restricted. Suppose the function nn(x) corresponds to the following four-layer feed-forward neural network with n inputs xi (i = 1, . . . , n), and H hidden cells: ÃH Ã n ! ! X X nn(x) = exp ch plin ahi xi + bh + d , (68) i=1
h=1
where plin : R → R is the following piecewise-linear function: 0 x < −1/2 x + 1/2 −1/2 ≤ x ≤ 1/2 plin(x) = 1 x > 1/2 We rewrite the neural network density nn(x) = nn(xj , x−j ) as H n X X nn(xj , x−j ) ∝ exp ch plin ahj xj + ahi xi + bh , h=1
i=1,i6=j
35
(69)
which is a kernel of the conditional density of xj given x−j . For each hidden cell h (h = 1, . . . , H) there are two points xj where its input a0h x + bh moves from one of the intervals (−∞, −1/2), [−1/2, 1/2] and (1/2, ∞) to another one: n n X X 1 1 1 ahj xj + ahi xi + bh = ± ⇔ xj = ± − ahi xi − bh . (70) 2 ahj 2 i=1,i6=j
i=1,i6=j
Consider only those ‘changing points’ x ˜j,k (k = 1, . . . , m with m ≤ 2H) that are in the interval ¯j ], and order these m points such that: of interest [xj , x x ˜j,1 < x ˜j,2 < · · · < x ˜j,m−1 < x ˜j,m If we define x ˜j,0 = xj and x ˜j,m+1 = x ¯j , we have m + 1 intervals [˜ xj,k , x ˜j,k+1 ] (k = 0, 1, . . . , m) on which a kernel of the conditional density of Xj given X−j is given by: nn(xj , x−j ) ∝ exp(˜ ak xj + ˜bk )
(71)
for certain constants a ˜k and ˜bk (k = 0, 1, . . . , m). The primitive of (71) is given by 1 Z ak xj + ˜bk ) + Ck if a ˜k 6= 0 a˜k exp(˜ ˜ exp(˜ ak xj + bk )dxj = exp(˜bk )xj + Ck if a ˜k = 0. where Ck (k = 0, 1, . . . , m) are integration constants that we specify in such a way that the CDF starts at the value 0 and is continuous in xj . After this kernel of the conditional CDF has been obtained, Xj is drawn from its conditional distribution using the inverse transformation method: one draws U ∼ U (0, 1) and computes: Xj =
log [˜ ak (S U − Ck )] − ˜bk a ˜k
or
Xj =
S U − Ck exp(˜bk )
depending on whether Xj falls in a region with a ˜k = 0 or not; S is the ‘scaling constant’ of the kernel, which is computed as the value of the kernel of the conditional CDF at x¯j . Since it is easy to draw Xj conditional on X−j (j = 1, . . . , n), it is easy to perform Gibbs sampling from a four-layer neural network distribution.
B.2
Auxiliary variable Gibbs sampling from a four-layer neural network distribution
Suppose a density kernel of X ∈ Rn is given by ½ nn(x) if xi ∈ [xi , x ¯i ] ∀i = 1, . . . , n p(x) = 0 else
(72)
where [xi , x ¯i ] is the interval to which Xi (i = 1, . . . , n) is restricted. Suppose the function nn(x) corresponds to the following four-layer feed-forward neural network with n inputs xi (i = 1, . . . , n), and H hidden cells: ÃH Ã n ! ! X X nn(x) = exp ch g ahi xi + bh + d , (73) i=1
h=1
36
where g : R → R is a monotonically increasing function taking its values in [0,1], which is invertible on the interval (x, x ¯) where it takes its values in (0,1). We will denote this invertible function by g˜ : (x, x ¯) → (0, 1) with inverse g˜−1 : (0, 1) → (x, x ¯). Note that the interval (x, x ¯) may be equal to (−∞, ∞). Examples of such a function g are the logistic, the piecewise-linear and the scaled arctangent function. Auxiliary variable Gibbs sampling is possible if the density kernel p can be decomposed as follows: K Y p(x) ∝ π(x) lk (x), (74) k=1
where π is a density kernel from which sampling is easy, and lk (k = 1, . . . , K) are non-negative functions of x ∈ Rn . The trick is that a set U = (U1 , . . . , UK ) of auxiliary variables is introduced such that a kernel of the joint density of X and U is given by: p(x, u) ∝ π(x)
K Y
I {0 < uk < lk (x)} .
(75)
k=1
It is easily seen that (74) is a marginal density kernel corresponding to the joint density (75). Therefore one can sample X ∼ p(x) by sampling both X and U from (75) and forgetting U . Kernels from the conditional distributions of X and U are easily obtained from the joint density kernel: p(x|u) ∝ π(x)I {lk (x) > uk , k = 1, . . . , K} (76) p(u|x) ∝
K Y
I {0 < uk < lk (x)}
(77)
k=1
It follows from (76) and (77) that an iteration of the auxiliary variable Gibbs sampler consists of drawing X from a truncated version of an ‘easy’ distribution with density kernel π, and sampling Uk (k = 1, . . . , K) from K independent uniform distributions. We rewrite (72) as: !! Ã Ã n n H Y X Y . (78) p(x) ∝ I {xi < xi < x exp ch g ahi xi + bh ¯i } i=1
i=1
h=1
which has the shape of (74) with π(x) =
n Y i=1
I {xi < xi < x ¯i } , Ã
lh (x) = exp ch g
à n X
(79) !!
ahi xi + bh
for h = 1, . . . , H.
(80)
i=1
where π(x) is the ‘easy’ density kernel of n independent variables Xi (i = 1, . . . , n) with distribution U (xi , x ¯i ). Drawing U conditionally on the values of X is straightforward. Combining (77) and (80), it follows that the elements Uh (h = 1, . . . , H) are drawn independently from the distributions: !#! Ã " Ã n X ahi xi + bh (81) Uh |X = x ∼ U 0, exp ch g i=1
37
Drawing X conditionally on the values of U is a little harder. We choose to break up X and sample the elements Xi (i = 1, . . . , n) conditionally on the values of U and the set of all other elements X−i . Combining (76), (79) and (80), we derive a density kernel of the conditional distribution of Xi given X−i and U : p(xi |u, x−i ) ∝ I {xi < xi < x ¯i } I {lh (xi , x−i ) > uh , h = 1, . . . , H}
(82)
We now take a closer look at the inequalities lh (xi , x−i ) > uh (h = 1, . . . , H). First, we can rule out that ch = 0 or ahi = 0 for any h, since in that case we just delete the involved hidden cell. If we consider lh (xi , x−i ) as a function of xi for given values of x−i , denoted by lh,x−i (xi ), then −1 (if it exists) is given by: the inverse lh,x −i −1 lh,x (uh ) = −i
1 −1 g˜ ahi
µ
log(uh ) ch
¶
−
n X
ahj xj + bh .
(83)
j=1,j6=i
Note that this inverse exists only if log(uh )/ch ∈ (0, 1), and that the cases in which the inverse −1 lh,x does not exist are the cases in which hidden cell h implies no restriction for xi . Also notice −i that this implies an upper bound for xi if ch ahi > 0 and a lower bound if ch ahi < 0. We conclude that (82) is a density kernel of the distribution Xi |U = u, X−i = x−i ∼ U (xi,LB (u, x−i ), xi,U B (u, x−i )), with
(84)
¯ ½ ¾ ¾ ¯ log(uh ) −1 ¯ xi,LB (u, x−i ) = max max lh,x−i (uh ) ¯ch ahi > 0, ∈ (0, 1) , xi 1≤h≤H ch ¯ ¾ ¾ ½ ½ ¯ log(uh ) −1 ¯ ∈ (0, 1) , x ¯i , xi,U B (u, x−i ) = min min lh,x−i (uh ) ¯ch ahi < 0, 1≤h≤H ch ½
−1 where lh,x (uh ) is given by (83), and where [xi , x ¯i ] is the interval to which Xi (i = 1, . . . , n) is −i a priori restricted.
The auxiliary variable Gibbs sampling procedure is now given by: Initialization: Choose feasible x0 = (x01 , . . . , x0n ). Do for j = 1, 2, . . . , m Do for h = 1, 2, . . . , H Obtain ujh ∼ Uh |X = xj−1 from (81). Do for i = 1, 2, . . . , n Obtain xji ∼ Xi |U = uj , X−i = xj−1 −i from (84). Here xj−1 −i denotes
j j j−1 j−1 xj−1 −i = x1 , . . . , xi−1 , xi+1 , . . . , xn ,
the set of all components except xi at their current values. Note that this procedure only requires drawing from uniform distributions, which is done easily and fast.
38
References [1] Angrist, J.D. and A.B. Krueger (1991): “Does Compulsory School Attendance Affect Schooling and Earnings?”, Quarterly Journal of Economics, 106, 979-1014. [2] Bauwens, L. and H.K. van Dijk (1989): “Bayesian limited information analysis revisited”. In: J. J. Gabszewicz et al. (eds), Economic Decision-Making: Games, Econometrics and Optimisation, North-Holland, Amsterdam. [3] Bauwens, L., M. Lubrano and J.-F. Richard (1999): Bayesian Inference in Dynamic Econometric Models, Oxford University Press. [4] Bauwens, L., C.S. Bos, H.K. van Dijk and R.D. van Oest (2004): “Adaptive Radial-Based Direction Sampling: Some flexible and robust Monte Carlo integration methods”, Journal of Econometrics, forthcoming. [5] Campbell, J.Y. (1987): “Does saving anticipate declining labor income? An alternative test of the permanent income hypothesis”, Econometrica, 55, 1249-1273. [6] Campbell, J.Y. and R.J. Shiller (1987): “Cointegration and tests of present value models”, Journal of Political Economy, 95, 1062-1088. [7] Campbell, J.Y. and G.N. Mankiw (1989): “Consumption, Income, and Interest Rates: Reinterpretinng the Time Series Evidence”, NBER Macroeconomics Annual 1989, MIT Press, Cambridge. [8] Chib, S. and E. Greenberg (1996): “Markov Chain Monte Carlo Simulation Methods in Econometrics”, Econometric Theory, 12(3), 409-431. [9] Damien, P., J. Wakefield and S. Walker (1999), “Gibbs Sampling for Bayesian Non-conjugate and Hierarchical Models by using Auxiliary Variables”, Journal of the Royal Statistical Society B, 61, 331-344 [10] Donaldson, R.G. and M. Kamstra (1997), “An Artificial Neural Network-GARCH Model for International Stock Return Volatility”, Journal of Empirical Finance, 4 (1), 17-46. [11] Edwards, R.G. and A.D. Sokal (1988), “Generalization of the Fortuin-Kasteleyn-SwendsenWang Representation and Monte Carlo Algorithm”, Physical Review D, 38, 2009-2012 [12] Gallant, A.R. and H. White (1989): “There exists a neural network that does not make avoidable mistakes”, in Proc. of the International Conference on Neural Networks, San Diego, 1988 (IEEE Press, New York). [13] Gelman, A. and X. Meng (1991): “A Note on Bivariate Distributions That Are Conditionally Normal”, The American Statistician, 45, 125-126. [14] Geman, S. and D. Geman (1984): “Stochastic Relaxation, Gibbs Distributions and the Bayesian Restoration of Images”, IEEE Transactions on Pattern Analysis and Machine Intelligence, 6, 721-741. [15] Geweke, J. (1989): “Bayesian inference in econometric models using Monte Carlo integration”, Econometrica, 57, 1317-1339.
39
[16] Geweke, J. (1999): “Using Simulation Methods for Bayesian Econometric Models: Inference, Development, and Communication”, Econometric Reviews, 18(1), 1-73. [17] Hall, A.D., H.M. Anderson and C.W.J. Granger (1992): “A cointegration analysis of treasury bill yields”, Review of Economics and Statistics, 74, 116-126. [18] Hamilton, J.D. (1989): “A New Approach to the Econometric Analysis of Nonstationary Time Series and Business Cycles”, Econometrica, 57, 357-384. [19] Hammersley, J. and D. Handscomb (1964): “Monte Carlo Methods”. Chapman and Hall, London. [20] Hastings, W.K. (1970): “Monte Carlo Sampling Methods using Markov Chains and their Applications”, Biometrika, 57, 97-109. [21] Hecht-Nielsen, R. (1987): “Kolmogorov mapping neural network existence theorem”, in Proc. IEEE First International Conference on Neural Networks, San Diego, 1987, 11-13. [22] Hobert, J.P. and G. Casella (1996): “The Effect of Improper Priors on Gibbs Sampling in Hierarchical Linear Mixed Models”, Journal of the American Statistical Association, 91(436), 1461-1473. [23] Hoogerheide, L.F. and H.K. van Dijk (2001): “Comparison of the Anderson-Rubin test for overidentification and the Johansen test for cointegration”, Econometric Institute report 2001-04, Erasmus University Rotterdam. [24] Hoogerheide, L.F., J.F. Kaashoek and H.K. van Dijk (2002): “Functional Approximations to Posterior Densities: A Neural Network Approach to Efficient Sampling”, Econometric Institute report 2002-48, Erasmus University Rotterdam. [25] Hoogerheide L.F., J.F. Kaashoek and H.K. van Dijk (2003): “Neural Network Approximations to Posterior Densities: An Analytical Approach”, 2003 Proceedings of the American Statistical Association, Section on Bayesian Statistical Science [CD-ROM], American Statistical Association, Alexandria, VA. [26] Hornik, K., M. Stinchcombe, and H. White (1989): “Multilayer feedforward networks are universal approximators”, Neural Networks, Vol. 2, 359-366. [27] Hutchinson, J., A. Lo and T. Poggio (1994): “A Nonparametric Approach to the Pricing and Hedging of Derivative Securities Via Learning Networks”, Journal of Finance, 49, 851-889. [28] King, R.G., C.I. Plosser, J.H. Stock and M.W. Watson (1991): “Stochastic trends and economic fluctuations”, American Economic Review, 81, 819-840. [29] Kleibergen, F.R., and H.K. Van Dijk (1994): “On the Shape of the Likelihood/Posterior in Cointegration Models”, Econometric Theory, 10(3-4), 514-551. [30] Kleibergen, F.R., and H.K. Van Dijk (1998): “Bayesian Simultaneous Equations Analysis using Reduced Rank Structures”, Econometric Theory, 14(6), 701-743. [31] Kloek, T., and H.K. Van Dijk (1978): “Bayesian estimates of equation system parameters: an application of integration by Monte Carlo”, Econometrica, 46, 1-19.
40
[32] Kolmogorov, A.N. (1957): “On the representation of continuous functions of many variables by superposition of continuous functions of one variable and addition”, American Mathematical Monthly Translation, Vol. 28, pp 55-59. (Russian original in Doklady Akademii Nauk SSSR, 144, 953-956) [33] Leshno, M., Lin, V.Y., Pinkus, A. and Schocken, S. (1993): “Multilayer Feedforward Networks With a Nonpolynomial Activation Function Can Approximate Any Function”, Neural networks, Vol. 6, 861-867. [34] Liesenfeld, R. and J.-F. Richard (2002): “Univariate and Multivariate Stochastic Volatility Models: Estimation and Diagnostics”, Discussion paper, University of Tubingen. [35] Metropolis, N., A.W. Rosenbluth, M.N. Rosenbluth, A.H. Teller, and E. Teller (1953): “Equations of State Calculations by Fast Computing Machines”, Journal of Chemical Physics, 21, 1087-1091. [36] Paap, R. and H.K. van Dijk (2002): “Bayes Estimates of Markov Trends in Possibly Cointegrated Series: An Application to US Consumption and Income”, Econometric Institute report 2002-42, Erasmus University Rotterdam. [37] Pesaran, M.H. and R. Smith (1995): “Estimation of Long-Run Relationships from Dynamic Heterogeneous Panels”, Journal of Econometrics, 68, 79-113. [38] Richard, J.-F. (2002): “Efficient High-dimensional Monte Carlo Importance Sampling”, Discussion paper, University of Pittsburgh. [39] Ritter, C. and M.A. Tanner (1992): “Facilitating the Gibbs Sampler: The Gibbs Stopper and the Griddy-Gibbs Sampler”, Journal of the American Statistical Association, 87, 861868. [40] Schotman, P.C. and H.K. van Dijk (1991): “A Bayesian Analysis of the Unit Root in Real Exchange Rates”, Journal of Econometrics, 49, 195-238. [41] Shephard, N. (1996): “Statistical aspects of ARCH and stochastic volatility”, in Time Series Models with Econometric, Finance and Other Applications, ed. by D.R. Cox, D.V. Hinkley and O.E. Barndorff-Nielson, Chapman and Hall, London. [42] Staiger, D. and J.H. Stock (1997): “Instrumental Variable Regression with Weak Instruments”, Econometrica, 65, 557-586. [43] Stinchcombe, M. (1989): “Universal Approximation Using Feedforward Networks with Nonsigmoid Hidden Layer Activation Functions”, in Proceedings of the International Joint Conference on Neural Networks, Washington DC, IEEE Press, New York. [44] Stinchcombe, M. (1990): “Approximating and Learning Unknown Mappings Using Multilayer Feedforward Networks with Bounded Weights”, in Proceedings of the International Joint Conference on Neural Networks, San Diego, IEEE Press, New York. [45] Tanner, M.A. and W.H. Wong (1987): “The Calculation of Posterior Distributions by Data Augmentation” (with discussion), Journal of the American Statistical Association, 82, 528550.
41
[46] Tierney, L. (1994): “Markov Chains for Exploring Posterior Distributions”, Annals of Statistics, 22, 1701-1762. [47] Van Dijk, H.K., and T. Kloek (1980): “Further experience in Bayesian analysis using Monte Carlo integration”, Journal of Econometrics, 14, 307-328. [48] Van Dijk, H.K., and T. Kloek (1984): “Experiments with some alternatives for simple importance sampling in Monte Carlo integration”, in Bayesian Statistics 2, ed. by J. M. Bernardo, M. Degroot, D. Lindley, and A. F. M. Smith, Amsterdam, North-Holland. [49] Van Dijk, H.K. (2003): “On Bayesian structural inference in a simultaneous equation model”, in Econometrics and the philosophy of economics, ed. by B.P. Stigum, Princeton University Press, Princeton, New Jersey. [50] Zellner, A. (1971): An introduction to Bayesian inference in econometrics. Wiley, New York.
42