Jan 27, 2010 - Pearson detection of a Gaussian signal using a wireless network of k ...... Lemma 2 As n, k â â, d(FRn ,FSn ) converges to zero in probability.
SUBMITTED TO IEEE TRANSACTIONS ON SIGNAL PROCESSING
1
Neyman-Pearson Detection of a Gaussian Source using Dumb Wireless Sensors Pascal Bianchi, Member, IEEE, J´er´emie Jakubowicz, Member, IEEE,
arXiv:1001.4703v2 [cs.IT] 27 Jan 2010
and Franc¸ois Roueff
Abstract We investigate the performance of the Neyman-Pearson detection of a stationary Gaussian process in noise, using a large wireless sensor network (WSN). In our model, each sensor compresses its observation sequence using a linear precoder. The final decision is taken by a fusion center (FC) based on the compressed information. Two families of precoders are studied: random iid precoders and orthogonal precoders. We analyse their performance in the regime where both the number of sensors k and the number of samples n per sensor tend to infinity at the same rate, that is, k/n → c ∈ (0, 1). Contributions are as follows. 1) Using results of random matrix theory and on large Toeplitz matrices, it is proved that the miss probability of the Neyman-Pearson detector converges exponentially to zero, when the above families of precoders are used. Closed form expressions of the corresponding error exponents are provided. 2) In particular, we propose a practical orthogonal precoding strategy, the Principal Frequencies Strategy (PFS), which achieves the best error exponent among all orthogonal strategies, and which requires very few signaling overhead between the central processor and the nodes of the network. 3) Moreover, when the PFS is used, a simplified low-complexity testing procedure can be implemented at the FC. We show that the proposed suboptimal test enjoys the same error exponent as the NeymanPearson test, which indicates a similar asymptotic behaviour of the performance. We illustrate our findings by numerical experiments on some examples.
I. I NTRODUCTION The design of powerful tests allowing to detect the presence of a stochastic signal using large WSN’s is a crucial issue in a wide range of applications. We investigate the NeymanPearson detection of a Gaussian signal using a wireless network of k sensors. Each sensor The authors are with Institut Telecom / Telecom ParisTech / CNRS LTCI, France. e-mails: {bianchi,jakubowi,roueff}@telecom-paristech.fr DRAFT
2
SUBMITTED TO IEEE TRANSACTIONS ON SIGNAL PROCESSING
observes a finite sample of the signal of interest, corrupted by additive noise, and then forwards some information towards the FC which takes the final decision. Neyman-Pearson detection of Gaussian signals using large sensor networks has been thoroughly investigated in the literature (see for instance [1], [2] and references therein). In such works, the FC is assumed to have a perfect knowledge of the observation sequence of each sensor. Unfortunately, in a WSN, the amount of information forwarded by each sensor node to the FC is usually limited, due to channel capacity constraints. Thus, in practice, each sensor node must compress its information in some way before transmission to the FC. This compression step of course degrades the performance of the detection. A large number of works has been devoted to the determination of relevant compression strategies, essentially within the framework of distributed detection [3], [4]. In these works, the data is locally processed by each sensor: Typically, a local Neyman-Pearson test is made by each node, based on the knowledge of the probabilistic law of the source to be detected. Unfortunately, such approaches require at the same time that each sensor possesses a significant computational ability allowing involved processing of its data, and that each sensor has a full knowledge of the source statistics. On the opposite, this paper investigates the case of dumb WSN. By this term, we refer to the case where: •
Individual sensor nodes are not aware of their mission and their environment. They process the observed data with no or few instructions from the central processor.
•
The processing abilities of each sensor node are limited due either to hardware or energy constraints.
Dumb WSN are of practical interest because they are simple, flexible (i.e., easily reconfigurable as a function of the sensor network’s mission) and avoid an excess of signaling overhead in the network. The aim of this paper is to propose and to study different compressing strategies which satisfy the above constraints and which are attractive in terms of detection performance. The paper is organized as follows. Section II introduces the signal model. Each sensor is assumed to observe n noisy samples of a stationary (correlated) Gaussian source. The spectral density f of the source is known at the FC but is unknown at the sensor nodes. The aim is to detect the presence of the source. To that end, each node forwards a compressed version of its observed sequence to the FC. In our model, the latter compression is achieved through simple (linear) processing of the DRAFT
BIANCHIET.AL.
3
data, allowing this way for low cost implementation. We refer to this step as linear precoding. Section III introduces the problem of the detection of the presence of the source (hypothesis H1 ) versus the hypothesis that only thermal noise is observed (hypothesis H0 ). It is well known that a uniformly most powerful (UMP) test is obtained by the celebrated Neyman-Pearson procedure. The corresponding test is derived in Subsection III-A. Intuitively, the good detection performance of the Neyman-Pearson test fundamentally relies on the relevant selection of the linear precoders used at the sensor nodes. Useful families of linear precoders are introduced, namely random iid precoders and orthogonal precoders. The detection performance associated with each of these families is studied in the asymptotic regime where both the number k of sensors and the number n of observations per sensor tend to infinity at the same rate (k, n → ∞, k/n → c where c ∈ (0, 1)). More precisely, we show in Section IV that for any fixed α ∈ (0, 1), the miss probability of the NP test of level α converges exponentially to zero. Error exponents are characterized and compared for the precoding strategies of interest. In particular, it is proved that the so-called Principal Frequencies Strategy (PFS) achieves the best error exponent among all orthogonal strategies. Numerical computations of all the obtained error exponents on some examples conclude this section. In the case where PFS is used, a suboptimal (non UMP) test is proposed in Section V. Based on the proof of a Large Deviation Principle governing the proposed test statistics, it is shown that our suboptimal test achieves the same error exponent as the Neyman-Pearson test. Finally, Section VI is devoted to the simulations.
Notations
Column vectors are represented by bold symbols. Notation kyk denotes the Euclidean norm of vector y. We denote by Leb the Lebesgue measure restricted to [−π, π]. For any function f : [−π, π] → R, we use notation f −1 (A) = {ω ∈ [−π, π] : f (ω) ∈ A} for the inverse image
of A, and we denote by Leb ◦ f −1 the image measure of Leb by f , i.e. which composes Leb
with f −1 . For any square matrix M, ρ(M) denotes its spectral radius. Finally, Ik denotes the k × k identity matrix. DRAFT
4
SUBMITTED TO IEEE TRANSACTIONS ON SIGNAL PROCESSING
II. T HE F RAMEWORK A. Observation model at the sensor nodes Consider a set of k sensors whose aim is to detect the presence of a certain source signal x(0), x(1), x(2) . . . . Each sensor i = 1 . . . k collects n noisy samples of the source signal. We assume that n ≥ k. Denote by y i = [yi (0), . . . , yi (n − 1)]T the n × 1 data vector observed by sensor i. For each i = 1, . . . , k, we consider the following signal model: yi = x + wi,
(1)
where x = [x(0), . . . , x(n−1)]T contains the time samples extracted from a zero mean stationary Gaussian process x with known spectral density function f (ω), ω ∈ [−π, π). Vector wi =
[wi (0), . . . , wi (n − 1)]T is a zero mean white Gaussian process which stands for the thermal noise of sensor i. We denote by σ 2 the variance of wi (0) which is assumed to be the same for
all i. Random vectors x, w 1 , . . . , wk are supposed to be independent. In the usual framework of Gaussian source detection, the aim is to detect whether the signal x of interest is present. Formally, this reduces to the following hypothesis testing problem: H1 :
y i = x + wi , ∀i = 1 . . . k
H0 :
y i = w i , ∀i = 1 . . . k .
In this paper, we make the following technical assumptions on the spectral density f : A1.
The spectral density f is continuous on [−π, π].
A2.
Measure Leb ◦ f −1 does not put mass on points.
Assumption A2 says that f cannot be constant over a set of positive Lebesgue measure (say, an interval of positive length). This e.g. rules out a white noise for x. On the other hand any ARMA process x that is not a white noise satisfies Assumptions A1 and A2.
B. Assumptions and constraints on the network We assume that the decision is taken by a distant node (the fusion center). The latter is supposed to have a perfect knowledge of the noise variance σ 2 and of the spectral density f of the signal x to be detected. In this paper, we are interested in WSN satisfying the following constraints. DRAFT
BIANCHIET.AL.
5
.
Sensor 1
y1 (0), . . . , y1(n − 1)
z1
Linear data precoding a1
Fusion Center Likelihood ratio Test
H0 /H1
Sensor k
yk (0), . . . , yk (n − 1)
zk
Linear data precoding ak
.
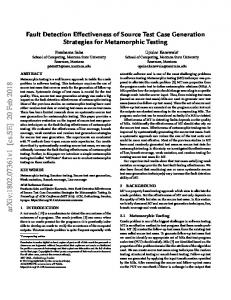
Fig. 1.
Sensor network using linear precoding at the nodes.
1) Communication constraint: In an ideal WSN architecture, each sensor i = 1, . . . , k would transmit all available observations yi (0), . . . , yi (n − 1) to the FC. Unfortunately, perfect forwarding of the whole information sequence y i by each sensor i is impractical in a large number of situations, the amount of information transmitted by each sensor node to the fusion center being usually limited. In this paper, we consider the case where only a compressed version of y i is likely to be forwarded. More precisely, we assume that each sensor i forwards a single scalar zi to the fusion center, where zi is a certain mapping of the sequence y i received by sensor i. 2) Signaling overhead constraint: Depending on the particular mission of the network or on the particular spectral density f to be detected, the network should be easily reconfigurable using a limited number of feedback bits from the fusion center to the sensors. In the sequel we assume that the spectral density f is known at the fusion center but is unknown (or at most partially known) at the sensor nodes. 3) Complexity constraint: Only low complexity data processing is likely to be implemented at the sensors’ side. More precisely, we assume that each sensor node i = 1 . . . k forwards a linear combination zi = aTi y i
(2)
of its observation sequence y i to the fusion center, where ai is a n × 1 vector to be determined. Figure 1 provides an illustration of the sensing scheme. Such a set of vectors a1 , . . . , ak will be refered to as a linear precoder. The n × k matrix An = [a1 , . . . , ak ] will be refered to as the DRAFT
6
SUBMITTED TO IEEE TRANSACTIONS ON SIGNAL PROCESSING
precoding matrix. III. L IKELIHOOD R ATIO T EST A. Expression of the Likelihood Ratio We denote by P0 and P1 the probability under H0 and H1 and by E0 and E1 the corresponding expectations. Denote by z = [z1 , . . . , zk ]T the available k × 1 observation vector at the fusion center, where for each i, zi is defined by (2). We denote by p0 : Rk → R+ and p1 : Rk → R+
the joint probability density function of z1 , . . . , zk under hypotheses H0 and H1 respectively. Due to the celebrated Neyman-Pearson’s Lemma, the Likelihood Ratio Test (LRT) is uniformly most powerful. The LRT rejects the null hypothesis for large values of the log-likelihood ratio (LLR) defined by: p1 (z) . (3) p0 (z) In the above definition, the lowerscript An has been introduced to recall that the distribution of the LAn = log
random variable LAn depends on the particular choice of the precoding matrix An = [a1 , . . . , ak ]. We now derive a closed form expression of the LLR LAn . It is worth noting that multiplying each ai by a non-zero constant does not modify the performance of the likelihood ratio test. Hence we may normalize An so that kai k = 1 for each i in the following. In this case, z is a zero mean Gaussian random vector with covariance matrix E1 (zz T ) = ATn Γn An + σ 2 Ik under hypothesis H1 , where Γn = E1 (xxT ) represents the n × n covariance matrix of vector x. Matrix Γn is the n × n Toeplitz matrix associated to the spectral density f of process x, namely, � � Z π 1 iω(k−l) f (ω)e dω . (4) Γn = Tn (f ) = 2π −π 1≤k,l≤n Under H0 , the covariance matrix of vector z simply coincides with E0 (zz T ) = σ 2 Ik . Using
these remarks, it is straightforward to show that kzk2 2 (5) 2 LAn = k log σ + 2 − log det(ATn Γn An + σ 2 Ik ) − z T (ATn Γn An + σ 2 Ik )−1 z . σ In the sequel, we assume as usual that the threshold of the test, say γn , is fixed in such a way that the probability of false alarm (PFA) does not exceed a level α (0 < α < 1), which reads P0 (LAn > γn ) ≤ α . We now analyze the miss probability of the above LLR test as a function of An . DRAFT
(6)
BIANCHIET.AL.
7
B. Introduction to error exponents Let PM (α; An ) denote the miss probability of the LLR test with level α based on the observation z1 , . . . , zk : n PM (α; An ) = inf P1 (LAn ≤ γn ) ,
where the inf is taken over all threshold values γn verifying the PFA constraint (6). The miss probability is generally the key metric to characterize the performance of hypothesis tests. Unfortunately, an exact expression of the miss probability as a function of An is difficult to obtain in the general case. Following [5], we thus analyze the asymptotic behaviour of the miss probability as the number of available observations tends to infinity. More precisely, we study the asymptotic regime where both the number of sensors k and the number of observations n per sensor tend to infinity at the same rate: n → ∞, k → ∞,
k →c n
(7)
where c ∈ (0, 1). Any sequence of n × k precoding matrices A = (An )n≥0 will be refered to as a linear strategy. Loosely speaking, we will prove that, at least for certain linear strategies of interest, the miss probability behaves as n PM (α; An ) ≃ e−nKα (A)
in the asymptotic regime (7), where Kα (A) is a certain constant which depends on the linear strategy but, as a matter of fact, does not depend on the level α. Such a constant is called the error exponent. It is a key indicator of the way the power of the test is influenced by the chosen linear strategy. More formally, we define for each A, 1 n (α; An ) , K α (A) = lim inf − log PM k→∞ n 1 n K α (A) = lim sup − log PM (α; An ) , n k→∞
(8) (9)
and we define the error exponent of A as Kα (A) = K α (A) = K α (A) as soon as (8) and (9) coincide. In the sequel, our aim is therefore to determine linear precoding strategies A having a large error exponent Kα (A) (and for which Kα (A) is well-defined, of course). The following Lemma (see [5]) provides a practical way to evaluate error exponents.
DRAFT
8
SUBMITTED TO IEEE TRANSACTIONS ON SIGNAL PROCESSING
Lemma 1 ([5]) The following inequalities hold: � � � � p0 (z) 1 K α (A) ≥ sup t : lim inf P0 log ≤t 0, D
N (0, σ12 ) || N (0, σ22)
�
� � σ12 σ12 1 = − log 2 + 1 − 2 , 2 σ2 σ2
which is increasing as σ1 /σ2 gets away from 1 from above or below. Since Φ is nondecreasing, we see that the frequencies ω lying in ∆c are those that maximize D (N (0, σ 2) || N (0, f (ω) + σ 2 )) in [−π, π]. Thus Korth (c) can be interpreted as some distance between the two spectral densities σ 2 (corresponding to H0 ) and f + σ 2 (corresponding to H1 ) restricted to a set of frequencies where these two spectral densities are the furthest apart.
C. Illustration and comparisons Error exponents Korth and Kiid defined in sections IV-B and IV-A depends on the following parameters: the spectral density f , the noise level σ, along with the sensors growth ratio c. When using the orthogonal strategy, one can expect that the more peaky f is, the more efficient the compression will be. That is, by using only a few sensors configured at the peak frequencies, one will get a attractive exponent error. This should also lead to a sharp increase of the error exponent curve Korth (c) for small c. On the contrary, when f is nearly flat (with a small range of values), there are no priviledged frequencies for the sensors to forward and the error exponent should increase slowly as c gets larger. Let us illustrate these intuitive arguments with numerical experiments. We consider two spectral densities corresponding to ARMA processes. The corresponding plots are depicted in Fig. 2. 2 1− 12 exp(iω)+ 14 exp(2iω) f1 (ω) = s21 1− 1 exp(iω)− 1 1 exp(2iω)− exp(3iω) 5 10 27 2 1 1+ exp(iω)− 5 exp(2iω) f2 (ω) = s22 1+ 10 2 exp(iω)− 3 exp(2iω) 5
DRAFT
10
BIANCHIET.AL.
13
f2(ξ) 1.8
8
1.6
Power Spectral Density
Power Spectral Density
f1(ξ) 9 7 6 5 4 3 2 1
that
-2
-1
0 Frequencies
1
2
−π
0.6 0.4
3
Left: Spectral density f1 with s1 adjusted such that
Rπ
1 0.8
0 -3
1 2π
1.2
0.2
0
Fig. 2.
1.4
-3
1 2π
Rπ
−π
-2
1
2
3
f2 = 1. One can notice that f1 has a sharp peak while f2 takes its values in much smaller range.
0.1 0.09 0.08 0.07 0.06 0.05 0.04 0.03 0.02 0.01 0
K(c) for various strategies 0.12
Korth Kiid Kfst
Korth Kiid Kfst
0.1 Error Exponent
Error Exponent
0 Frequencies
f1 = 1. Right: Spectral density f2 with s2 adjusted such
K(c) for various strategies
0.08 0.06 0.04 0.02 0
0
Fig. 3.
-1
0.2
0.4 0.6 c: Sensors Growth Rate
0.8
1
0
0.2
0.4 0.6 c: Sensors Growth Rate
0.8
1
Error Exponents Kiid (c), Korth (c) and Kfst (c) as functions of the growth ratio c = lim k/n, for spectral density
functions f1 (left) and f2 (right).
Fig. 3 represents Kiid (c) and Korth (c) for σ = 1. For comparison, we also plotted another error exponent curve, corresponding to an orthogonal, yet suboptimal strategy which uses precoding matrices An = [Ik
0]. This strategy amounts to keep only the first k values of the signal,
independently of f . It is straightforward to prove that the corresponding error exponent writes Kfst (c) = c · Korth (1). One can notice several numerical facts on Fig. 3. First, as expected from section IV-B, Kfst is always below Korth . Remark that, as expected, Korth has a sharper increase near c = 0 when used with f1 than when used with f2 . The fact that the random iid strategy seems to behave better for c close to 1 is more surprising but it reveals the following interesting fact: in some circumstances, a non-orthogonal strategy may outperform an optimal orthogonal strategy. Let us try to interpret this result. When setting up the sensor network design, one faces a tradeoff. DRAFT
14
SUBMITTED TO IEEE TRANSACTIONS ON SIGNAL PROCESSING
K(c) for various strategies 0.18
Korth Kiid Kfst
0.16
Korth Kiid Kfst
0.2 Error Exponent
0.14 Error Exponent
K(c) for various strategies 0.25
0.12 0.1 0.08 0.06 0.04
0.15 0.1 0.05
0.02 0
0 0
0.2
0.4 0.6 c: Sensors Growth Rate
0.8
1
0
0.2
K(c) for various strategies 0.025
Error Exponent
Error Exponent
0.015 0.01 0.005 0 0
0.2
0.4 0.6 c: Sensors Growth Rate
0.8
1
0.8
1
K(c) for various strategies
Korth Kiid Kfst
0.02
0.4 0.6 c: Sensors Growth Rate
0.8
1
0.02 0.018 0.016 0.014 0.012 0.01 0.008 0.006 0.004 0.002 0
Korth Kiid Kfst
0
0.2
0.4 0.6 c: Sensors Growth Rate
Fig. 4. Error Exponent curves for spectral density functions f1 (left) and f2 (right) with σ 2 = 1/2 (top) and σ 2 = 4 (bottom).
Either use an extra sensor over the same frequency that the previous sensor in order to denoise their common measurment, or use this extra sensor over a new frequency in order to discover another part of the spectral density f . At small levels of noise, it is always more interesting to discover f at new frequencies than to denoise ones already used by other sensors; indicating that the orthogonal strategy is always the best. But for high levels of noise, it may become more efficient to repeat (and thus denoise) key frequencies than to discover less important ones. To support this claim, we refer to Fig. 4 where we chose two levels of noise, one that is larger (σ 2 = 4) than the one used in Fig. 3, and one that is smaller (σ 2 = .5). One can see that when σ 2 = .5, the best orthogonal strategy outperforms the two others, whereas for σ 2 = 4 the upcrossing of Kiid over Korth near c = 1 is more important than on Fig. 3. The same conclusions hold for both spectral densities f1 and f2 . V. A PFS- BASED
LOW COMPLEXITY TEST
Results of the previous section indicate that the principal frequencies strategy is a good candidate for implementation in dumb sensor networks. Indeed it requires only few cooperation DRAFT
BIANCHIET.AL.
15
between the nodes and the fusion center, and is attractive from an error exponent perspective. In this section, we prove furthermore that when PFS is used, then a test procedure can be proposed which is much less complex than the LRT, and which achieves nevertheless the same error exponent. We assume throughout this section that PFS is used i.e., each precoding matrix is given by An = Wn where Wn is defined by (14). A. A low complexity test Recall that the LRT rejects the null hypothesis when the LLR (5) is above a threshold. As the terms k log σ 2 and log det(ATn Γn An + σ 2 Ik ) are constant w.r.t. the observation z, it is clear that the LRT reduces to the test which rejects the null hyopthesis for large values of the statistics: kzk2 − z T (ATn Γn An + σ 2 Ik )−1 z . σ2
(18)
Unfortunately, the evaluation of the above statistics is computationally demanding as k gets larger, since it requires the inversion of the k × k matrix ATn Γn An + σ 2 Ik . In order to avoid this, we propose to replace matrix Γn in (18) with its circulant approximation given by (13). In other words, product ATn Γn An is replaced by: ATn Fn diag (f (0) . . . f (2π(n − 1)/n)) FnT An = diag (f (2πj1n /n) . . . f (2πjkn /n)) . This leads directly to the following procedure. PFS low complexity (PFSLC) Test: Reject hypothesis H0 when the statistics Tn defined by: � � k X 1 1 2 , (19) − 2 Tn = |zℓ | n 2 /n) σ σ + f (2πj ℓ ℓ=1 is larger than a threshold. Although this statistics cannot give rise to a better test than the LRT, its numerical simplicity makes it worth to be considered. In the next paragraph, we study the performance of the test and we prove that it performs as well as the LRT in terms of error exponent. B. Asymptotic optimality of the PFSLC test As the statistics (19) is no longer a likelihood ratio, Lemma 1 cannot be used to evaluate the error exponent associated with the test (19). Instead, we must resort to arguments of large DRAFT
16
SUBMITTED TO IEEE TRANSACTIONS ON SIGNAL PROCESSING
deviations theory. Specifically, we shall study the large deviation behaviour of the test associated to this statistic, that is the limit of −n−1 log P1 (Tn ≤ ηn (α)) where ηn (α) is the (1 − α)-quantile of the statistic Tn under H0 , P0 (Tn > ηn (α)) = α. Under mild assumptions, we show below that this limit is given by the error exponent of the PFS. Hence, as far as error exponents are considered, there is no loss in the performance in using the statistic Tn defined in (19) rather than the likelihood ratio. Theorem 3 Assume that A1 and A2 hold true. For any level α ∈ (0, 1), the statistics Tn defined in (19) satisfies the following property. For ηn (α) such that P0 (Tn > ηn (α)) = α, the miss probability P1 (Tn ≤ ηn (α)) satisfies 1 lim − log P1 (Tn ≤ ηn (α)) = Korth . n→∞ n The proof of this result is provided in Appendix A-C.
VI. S IMULATIONS The error exponent theory is inherently asymptotic. In this section we provide numerical experiments to analyze the performance of the PFS on simulated data for finite n since we have already proved that the error exponent curve is the same. The point here is to test how well the error exponent theory is relevant for finite n. We use the same spectral density functions f1 and f2 as in section IV-C, whose error exponents are displayed in Fig. 3. We now compare, for a couple of values for c, the finite sample performances of the LRT with the iid, PFS and PCS Strategies by using their empirical Receiver Operating Characteristic (ROC) curves. When the PFS is used, we also consider the PFSLC test of section V. We have shown that the LRT with the PFS or the PCS and the PFSLC test share the same error exponent curve. How well this measure of the performance impacts the whole ROC curves at finite samples is displayed in Fig. 5. It turns out that the PCS, the PFS and the PFSLC have similar ROC curves, as indicated by the error exponent analysis. One can also notice the good performance of the PFS, PFSLC and PCS when c = .1, σ = 1 and n = 100 for f1 , which confirms the conclusions drawn from the error exponent curves in Fig. 3. For c = .9, σ = 2 and n = 100, one can notice that error exponent curves also provide a good prediction: the iid strategy slightly outperforms the PFS, PCS and PFSLC. DRAFT
BIANCHIET.AL.
17
ROC curves (c = .1, n = 100) 1
Kiid Kpfs Kpcs Kpfslc
0.8
Kiid Kpfs Kpcs Kpfslc
0.8
0.6
Power
Power
ROC curves (c = .1, n = 100) 1
0.4 0.2
0.6 0.4 0.2
0
0 0
0.2
0.4
0.6
0.8
1
0
0.2
0.4
PFA ROC curves (c = .9, n = 100) 1
1
Kiid Kpfs Kpcs Kpfslc
0.8
0.6
Power
Power
0.8
ROC curves (c = .9, n = 100) 1
Kiid Kpfs Kpcs Kpfslc
0.8
0.4 0.2
0.6 0.4 0.2
0
0 0
0.2
0.4
0.6
0.8
1
0
PFA
Fig. 5.
0.6 PFA
0.2
0.4
0.6
0.8
1
PFA
ROC curves associated to the PFS, PCS, PFSLC and Random iid Strategy for spectral density functions f1 (left) and
f2 (right). Top: c = .1 and σ = 1. Bottom c = .9 and σ = 2. As predicted by the error exponents curves, iid strategy is less efficient when σ = 1 but slightly more efficient when σ = 2 for large values of c.
VII. C ONCLUSION In this paper, we studied the performance of the Neyman-Pearson detection of a stationary Gaussian process in noise, using a large wireless sensor network (WSN). Our results are relevant for the design of sensor networks which are constrained by limited signaling and communication overhead between the fusion center and the sensor nodes. We studied the case where each sensor compresses its observation sequence using either a random iid linear precoder or an orthogonal precoder. In the random precoder case, we determined the error exponent governing the asymptotic behaviour of the miss probability, when k, n → ∞ and k/n → c ∈ (0, 1). In the orthogonal precoder case, we exhibit strategies (PCS and PFS) that achieve the best error exponent among all orthogonal strategies. The PFS has moreover the attractive property of being well suited for WSN with signaling overhead constraints. In addition, we proved that when the PFS is used, a low complexity test can be implemented at the FC as an alternative to the Likelihood Ratio (Neyman-Pearson) test. Interestingly, the proposed test performs as well as the DRAFT
18
SUBMITTED TO IEEE TRANSACTIONS ON SIGNAL PROCESSING
LRT in terms of error exponents. ACKNOWLEDGMENTS We thank Jamal Najim for helpful comments and for bringing useful references to our attention. A PPENDIX A P ROOFS
OF MAIN RESULTS
Observe that we may set σ 2 = 1 without loss of generality, since it amounts to divide f by σ 2 and the data y i by σ. Hence in the following proof sections, we assume σ = 1. In particular the LLR in (5) for a precoding matrix An with normalized precoders ai , i = 1, . . . , k is given by 2LAn = kzk2 − log det(ATn Γn An + Ik ) − z T (ATn Γn An + Ik )z .
(20)
A. Proof of Theorem 1 We assume without restriction that E((A111 )2 ) = 1. Due to Lemma 1, it is sufficient to prove that the normalized LLR associated to strategy A converges in probability to the rhs of equation (11) under H0 . Expression (20) of the LLR relies on the assumption that each precoder ai has unit norm, which is generally not the case for An defined as in Theorem 1. Since the false alarm and miss probabilities of this LRT do not depend on the norms kai k, i = 1, . . . , k, it is equivalent to consider precoders defined by the matrix A˜n = An Pn−1/2 , where Pn = diag
Pn
n 2 i=1 (Aij )
(21)
� : j = 1, . . . , k . With this definition, we may use expression (20)
which is valid for normalized precoders. In order to prove Theorem 1, it is now sufficient to show that −(1/n)LA˜n converges to the constant Krnd defined in (11).
The main issue lies in the asymptotic study of the two terms n1 log det(A˜Tn Γn A˜n + Ik ) and 1 T ˜T z (A Γn A˜n + Ik )−1 z. This can be done by successively using the results of [9], [10] and [11].
n
n
The crucial point is to characterize the limiting spectral measure of matrix A˜Tn Γn A˜n . Define: Rn = A˜Tn Γn A˜n , Sn = DRAFT
1 T A Γn An . n n
BIANCHIET.AL.
19
First, we prove (see Lemma 2 below) that the spectral measure of Rn is asymptotically close to the one of Sn in a sense which is made clear below. Second, we apply the results of [12], [10] along with [7] to determine the limiting spectral measure of Sn . Finally, closed form expressions of the desired quantities follow from the results of [11]. Denote by d the L´evy distance on the set of distribution functions. We recall that FQ denotes the distribution function of the spectral measure of Q (see Section IV-A). Lemma 2 As n, k → ∞, d(FRn , FSn ) converges to zero in probability. Proof: The proof relies on Bai’s formula (see [13] and [9]) which provides the following bound on the L´evy distance: 2 |A − B|2 (|A|2 + |B|2 ) (22) nk p for any n × k real matrices A, B, where |A| = Tr[AT A] denotes the Frobenius norm of A. 1/2 1/2 We now use equation (22) with A ← Γn A˜n and B ← √1 Γn An . Using (21) and introducing d4 (FAT A , FBT B ) ≤
n
∆n =
−1/2 (Pn
−
√1 In )2 , n
it is straightforward to show that:
d4 (FRn , FSn ) ≤ 1 n
2n 1 Tr[∆n Sn ] (Tr[Pn−1 Sn ] + Tr Sn ) . k n
(23)
ρ(Γn ) n2
Tr[ATn An ], where ρ(Γn ) denotes the spectral radius of Γn . Similarly, Tr Pn−1 Sn = Tr Rn ≤ ρ(Γn ) n1 Tr A˜Tn A˜n = ρ(Γn ) nk . Finally, Tr ∆n Sn ≤ ρ(Γn )ρ( n1 ATn An ) Tr ∆n .
Note that
Tr Sn ≤
Putting all pieces together, d4 (FRn , FSn ) ≤ κn Tr ∆n
(24)
where 2n κn = ρ(Γn )2 k
�
� � � k 1 1 T T + Tr An An ρ A An . n n2 n n 1 n2
Tr ATn An converges √ almost surely (a.s.) to c. From [14], ρ( n1 ATn An ) converges a.s. to (1 + c)2 . Therefore, κn √ converges a.s. to 4Mf2 c(1+(1+ c)2 ). In order to prove that d(FRn , FSn ) converges in probability
From [7], ρ(Γn ) converges to Mf = sup(f ). By the law of large numbers,
to zero, it is sufficient, by equation (24), to prove that Tr ∆n converges in probability to zero. We write Tr ∆n as follows: k
1X ξn,j Tr ∆n = n j=1 DRAFT
20
SUBMITTED TO IEEE TRANSACTIONS ON SIGNAL PROCESSING
where ξn,j =
�
1 n
Pn
n 2 i=1 (Aij )
ǫ > 0. By Markov inequality,
�−1/2
�2 − 1 . Note that for a fixed n, ξn,j are iid for all j. Let E
P (Tr ∆n > ǫ) ≤
�P
k j=1 ξn,j
nǫ
�
=
k E (ξn,1 ) . n ǫ
(25)
As ξn,1 converges a.s. to zero, we conclude that P (Tr ∆n > ǫ) tends to zero. This completes the proof of Lemma 2. Thanks to Lemma 2, it is sufficient to study the asymptotic behaviour of FSn . The latter is provided by [12], [10]. In order to introduce this result, we need to recall some definitions. For any distribution function F , the Stieltjes transform bF of F is given by: Z dF (t) bF (z) = t−z
for each z ∈ C+ , where C+ = {z ∈ C : ℑ(z) > 0} with ℑ(z) denoting the imaginary part
of z. Recall that, from the results of [7], the spectral distribution function FΓn of Γn converges weakly to Φ given by (10). By straightforward application of the results of [12], [10], we obtain that, with probability one, FSn converges weakly to a deterministic measure F whose Stieltjes transform b = b(z) is the unique solution in C+ of: Z 1 t z=− + dΦ(t) , b 1 + ctb
(26)
for each z ∈ C+ . The above result along with Lemma 2 implies that ∀ǫ > 0, P(d(FRn , F ) > ǫ) → 0 .
(27)
We are now in a position to study the limit of the LLR. We obtain immediately from (20): � � kzk2 k 1 − + βn + γn + δn (28) − LA˜n = n 2n k where βn γn δn
Z 1 1 −1 = Tr (Ik + Rn ) = dFRn (t) k 1+t Z 1 log det (Ik + Rn ) = log (1 + t) dFRn (t) = k 1 T = z (Ik + Rn )−1 z − βn . k
Using (27), βn and γn respectively converge in probability to the constants β and γ defined by: Z Z 1 dF (t) and γ = log (1 + t) dF (t) . β= 1+t DRAFT
BIANCHIET.AL.
21
Recalling that z ∼ N (0, Ik ) under H0 , the term k1 kzk2 in the rhs of (28) converges a.s. to one. Since z is independent of A˜n and since the spectral radius of (Rn + Ik )−1 is bounded, it is a.s.
straightforward to show that δn −−→ 0 (use for instance Lemma 2.7 in [15]). Finally, −(1/n) LA˜n converges in probability to: c Kα (A) = (−1 + β + γ) . 2
(29)
Constant β coincides with the Stieltjes transform of F at point −1, that is β = b(−1) where we defined for each x < 0, b(x) = limz∈C+ →x b(z). Constant β is thus the unique solution to (12). A closed form expression for γ can as well be obtained using (for instance) [11]. Using the fact that the limiting spectral measure associated with F has a bounded support, the dominated R convergence Theorem applies to the function x 7→ log(x + t)dF (t). One easily obtains after
some algebra:
γ=
Z
∞ 1
�
� 1 − b(−t) dt . t
Following [11], we conclude that γ = C(1) where C is the function defined for each x > 0 by: Z 1 C(x) = −1 + xb(−x) − log(xb(−x)) + log(1 + ctb(−x))dΦ(t) . c This statement can simply be proved by noting that C ′ (t) = 1t −b(−t) (where C ′ is the derivative of C) and C(∞) = 0. Plugging the above expression of γ into (29), we obtain the claimed error exponent Krnd .
B. Proof of Theorem 2 We start with some useful definitions and technical preliminaries. Let c ∈ (0, 1). Denote mf = inf(f ) Mf = sup(f ) so that, by definition of Φ in (10), Φ(t) = 0 for all t < mf and Φ(t) = 1 for all t ≥ Mf . We define the set Λc = {λ ∈ (mf , Mf ] : Φ(λ) ≥ (1 − c)} . By assumptions A1 and A2, Φ is continuously strictly increasing from [mf , Mf ] to [0, 1], we denote by Φ−1 its inverse continuous function defined from [0, 1] to [mf , Mf ]. Hence Λc = [Φ−1 (1 − c), Mf ]. Moreover, using again A2, we obtain that 1Λc is almost surely continuous with respect to Leb ◦ f −1 . By the uniform mapping theorem, this implies that, for any sequence DRAFT
22
SUBMITTED TO IEEE TRANSACTIONS ON SIGNAL PROCESSING
of probability measures (µn ) weakly converging to (2π)−1 Leb ◦ f −1 , we have, for all continuous function g : R → R, as n → ∞, Z Z Z 1 1 −1 g(λ)dµn (λ) → g(λ)d{Leb ◦ f }(λ) = g ◦ f (ω)dω 2π Λc 2π ∆c Λc
(30)
where the last equality follows from the definition of ∆c in (15) by setting λ = f (ω). 1) The PCS case: The outline of the proof is the following. Step 1. Assume that k = max{i ∈ {1, . . . , n} : Φ(λni ) ≥ 1 − c} ,
(31)
where (λni )1≤i≤n is given in Definition 1. Then k satisfies (7) and strategy V has error exponent Korth (c). Step 2. Strategy V with any sequence k satisfying (7) also has the error exponent Korth (c). Step 3. Under Condition (7) strategy V is optimal among all orthogonal strategies, that is, (17) holds for any A. P Step 1. Let µn = n1 ni=1 δλni denote the empirical spectral measure of Γn defined in (4). Szeg¨o’s Theorem states that µn converges weakly to Lemma 5 then gives
1 Leb 2π
n
1 1X 1Λc (λni ) = n i=1 2π
◦ f −1 ([7], p.64). Applying (30) and then
Z
dω = c . ∆c
That is, k defined by (31) satisfies (7). Recall that here Vn is given in Definition 1 with k given by P in (31). The empirical spectral measure of VnT Γn Vn + Ik is thus given by n1 ni=1 δ1+λni 1Λc (λni ). Hence we have as above that
Z 1 1 T log(1 + f (ω))dω , lim log det(Vn Γn Vn + Ik ) = n→∞ n 2π ∆c Z � T � 1 1 −1 lim Tr (Vn Γn Vn + Ik ) = dω . n→∞ 2π ∆c 1 + f (ω)
(32) (33)
The spectral radius ρ[(VnT Γn Vn + Ik )−1 ] is bounded by 1/(1 + Φ−1 (1 − c)). Using eqs (20),
P
(32)–(33), Lemma 3 and (16), we obtain that, under H0 , − n1 LVn −→ Korth (c). As a consequence of Lemma 1, we obtain the assertion of Step 1.
Step 2. Observe that the error exponent associated to a strategy V is increasing with k. Now let
k be a sequence satisfying (7). For any c′ and c′′ such that c′ < c < c′′ , define k ′ and k ′′ by (31)
with c replaced by c′ and c′′ respectively. Then, as seen in Step 1, k ′ and k ′′ also satisfy (7) with c replaced by c′ and c′′ respectively. Thus, eventually, k ′ ≤ k ≤ k ′′ , and, applying Step 1, the DRAFT
BIANCHIET.AL.
23
error exponent of V belongs to [Korth (c′ ), Korth (c′′ )]. This, with the continuity of Korth , yields the assertion of Step 2.
Step 3. Assume A = (An ) now denotes any orthogonal, that is An is a n × k orthogonal matrix for all n, where k satisfies (7). Let us prove that the bound (17) holds. By Lemma 1, for all real t, we have lim inf P0 n→∞
�
� 1 − LAn > t = 0 ⇒ K α (A) ≤ t . n
(34)
Let t > lim supn→∞ E0 [−LAn /n]. Using Markov inequality, we have for n large enough, � � � � Var0 n1 LAn 1 � . � P0 − L A n > t ≤ n (t + E0 n1 LAn )2
Using (20), we have � � � � � n→+∞ 1 1 Var0 LAn = Var0 z T Ik − (Ik + ATn Γn An )−1 z → 0 , n 4
where the convergence follows from Lemma 3 by noticing that Ik − (Ik + ATn Γn An ) has
eigenvalues in [0, 1] and, under H0 (recall that we set σ 2 = 1), z ∼ N (0, Ik ). The last two � � displays show that P0 − n1 LAn > t → 0 as n → ∞ for all t > lim supn→∞ E0 [−LAn /n]. With (34), we get that
K α (A) ≤ lim sup E0 [−LAn /n] . n→∞
To conclude the proof, it thus only remains to show that lim supn→∞ E0 [−LAn /n] ≤ Korth (c). We have, by (20), � E0 [−LAn ] = −k + log det(ATn Γn An + Ik ) + Tr (ATn Γn An + Ik )−1 . Since x 7→ log x + 1/x is nondecreasing on [1, +∞[, Lemma 4 thus implies that E0 [−LAn ] ≤ E0 [−LVn ]. We proved in Step 1 that E0 [−LVn /n] → Korth (c). Hence the proof is achieved. 2) The PFS case: We now prove that the PFS strategy also achieves the error exponent Korth (c) under the condition (7). Using the same argument as in Step 2 of the PCS case, we can in fact take k as defined by n k = max{i ∈ {1, . . . , n} : Φ ◦ f (2πji−1 ) ≥ 1 − c} ,
(35)
where (jin )0≤ix0 n→∞ n c>x0 x≤c n
and lim inf n→∞
1 1 log P1 (Tn ≤ ηn (α)) ≥ sup lim inf log P1 (n−1 Tn < c) ≥ sup sup −I1 (x) , n c 1/(2Mh ). Let ǫ > 0. Note that Jx (0) = 0 and for all x ≥ ǫ and y ≤ 0, Jx (y) ≤ yx + log(1 − 2yMh )/2 → −∞ as y → −∞. Thus there exists yǫ only depending on ǫ such that Jx (y) ≤ 0 for all x ≥ ǫ and y ≤ yǫ . From these facts, it follows that for all x ≥ ǫ, I(x) = supy∈[yǫ ,1/(2Mh )] |Jx (y)|. Finally we observe that
for all x, x′ ≥ ǫ, supy∈[yǫ ,1/(2Mh )] |Jx (y) − Jx′ (y)| ≤ (−yǫ ∨ 1/(2Mh )) |x − x′ | which now yields the result.
R EFERENCES [1] Y. Sung, L. Tong, and V. Poor, “Neyman-pearson detection of gauss-markov signals in noise: Closed-form error exponent and properties,” IEEE Trans. Information Theory, vol. 52, no. 4, pp. 1354–1365, 2006. [2] W. Hachem, E. Moulines, and F. Roueff, “Error exponents for neyman-pearson detection of a continuous-time gaussian markov process from noisy irregular samples,” submitted to IEEE Trans. on Inform. Theory, 2009. [3] R.S. Blum, S.A. Kassam, and H.V. Poor, “Distributed detection with multiple sensors ii. advanced topics,” Proc. of the IEEE, vol. 85, no. 1, pp. 64–79, 1997. [4] J.J. Xiao, Z.Q. Ribeiro, A.and ZQ Luo, and G.B. Giannakis, “Distributed compression-estimation using wireless sensor networks,” IEEE Sign. Process. Magaz., vol. 23, no. 4, pp. 27–41, 2006. [5] P.-N. Chen, “General Formulas For The Neyman-Pearson Type-II Error Exponent Subject To Fixed And Exponential Type-I Error Bounds,” IEEE Transactions on Information Theory, vol. 42, no. 1, pp. 316–323, 1996. [6] E.J. Candes and T. Tao, “Decoding by linear programming,” IEEE Trans. on Inform. Theory, vol. 51, no. 12, pp. 4203–4215, December 2005. [7] U. Grenander and G. Szeg¨o, Toeplitz Forms and Their Applications (2nd Ed.), Chelsea Publishing Co, 1984. [8] H Widom, Studies in Real and Complex Analysis, vol. 3 of MAA Studies in Mathematics, Prentice Hall, 1965. [9] W. Hachem, Ph. Loubaton, and J. Najim, “The empirical eigenvalue distribution of a gram matrix: From independence to stationarity,” Markov Process, Related Fields, vol. 11, pp. 629–648, 2005. [10] J. Silvertein, “Strong convergence of the empirical distribution of eigenvalues of large dimensional random matrices,” Journal of Multivariate Analysis, vol. 55, no. 2, pp. 175–192, 1995. [11] W. Hachem, Ph. Loubaton, and J. Najim, “Deterministic equivalents for certain functionals of large random matrices,” Ann. Appl. Prob., vol. 17, no. 3, pp. 875–930, 2007. [12] Y. Q. Yin, “Limiting spectral distribution for a class of random matrices,” J. Multivariate Anal., vol. 20, no. 1, pp. 50–68, 1986. [13] Z.D. Bai, “Convergence rate of expected spectral distributions of large random matrices part ii: Sample covariance matrices,” Ann. Prob., vol. 21, no. 2, pp. 649–672, 1993. [14] Y. Q. Yin, Z. D. Bai, and P. R. Krishnaiah, “On the limit of the largest eigenvalue of the large-dimensional sample covariance matrix,” Probab. Theory Related Fields, vol. 78, no. 4, pp. 509–521, 1988. [15] Z.D. Bai and J. Silverstein, “No eigenvalues outside the suppport of the limiting spectral distribution of large dimensional random matrices,” Ann. Prob., vol. 26, no. 1, pp. 316–345, 1998. DRAFT
BIANCHIET.AL.
29
[16] J. Guti´errez-Guti´errez and P. M. Crespo, “Asymptotically equivalent sequences of matrices and hermitian block toeplitz matrices with continuous symbols: Applications to mimo systems,” IEEE Transactions on Information Theory, vol. 54, no. 12, pp. 5671–5680, 2008. [17] R. M. Gray, Toeplitz And Circulant Matrices: A Review, Now Publishers, 2006. [18] B. Bercu, F. Gamboa, and A. Rouault, “Large deviations for quadratic forms of stationary Gaussian processes,” Stochastic Process. Appl., vol. 71, no. 1, pp. 75–90, 1997. [19] R. A. Horn and C. R. Johnson, Matrix Analysis, Cambridge University Press, 1990.
DRAFT