function of) parameters of the environment. There exist many adaptive network solutions (representations), which succeed in recovering the original signals ...
BLIND SOURCE RECOVERY USING AN ADAPTIVE GENERALIZED GAUSSIAN SCORE FUNCTION Khurram Waheed and Fathi M. Salam Circuits, Systems and Artificial Neural Networks Laboratory Michigan State University East Lansing, MI 48824-1226
Abstract The paper discusses Blind Source Recovery (BSR) of minimum phase and non-minimum phase mixtures of multiple source distributions using an adaptive score function. This proposed parametric score function is derived from the generalized gaussian distribution model. An adaptive algorithm to determine the tuning parameter for the proposed score function using the batch kurtosis of BSR output is also presented. The primary advantage of the proposed framework is that it renders the adaptive estimation of the demixing network to be completely blind. No a priori information about the distribution structure of the original sources is required. Simulation examples verifying the proposed framework are also presented.
1. Introduction Blind Source Recovery (BSR) is an interesting autonomous (or unsupervised) stochastic adaptation problem that includes wellknown adaptive signal processing problems of multi-channel Blind Source Separation (BSS), Deconvolution (BSD) and Equalization (BSE) with several potential applications [2,3,6]. The BSR problem denotes recovering original sources from environments that may include convolution, transients, and even possible nonlinearity. The performance of BSR algorithms strongly depends on the choice of an appropriate score function which appears as an element wise acting non-linearity on the output signals [2-6]. For a particular problem, the optimal score function depends on the distribution of the original source signals which are unknown in a blind scenario. In such cases, unless some assumptions about the distribution of the sources are made, any BSR algorithm will potentially be unable to deliver the desired performance. Therefore, adaptive estimation of appropriate score functions is very attractive from a practical implementation viewpoint. The proposed score function was applied to BSR in a state space framework. The state space notion provides a compact representation, capable of handling both time delayed and filtered versions of signals in an organized manner [2,3,6]. Unlike the transfer function models of standard dynamic filters, the use of the state-space can result in several generalized, equivalent and efficient internal descriptions of a system. This allows for recovery of original sources independent from (and even in the absence of) environment identifiability, i.e. determining the exact (or a specific function of) parameters of the environment. There exist many adaptive network solutions (representations), which succeed in recovering the original signals even in the absence of precise identifiability, termed as recoverability [3,6]. Existence and
constructions of a theoretical solution to the BSR problem can be easily derived using the state space, given a structure of the environment [1,3, and the references therein]. Most of the mixtures encountered in practical BSR problems are from sources with a variety of non-gaussian distributions. On the other hand, most noise phenomena or unidentified sources are assumed to possess gaussian distributions. This results in practical situations, where one has to cope with multiple source distribution mixtures including gaussian distributions. We describe the use of the proposed adaptive score function in the linear convolutive class of state space BSR
2. Generalized Gaussian Distribution Family The generalized gaussian distribution class was proposed by Miller et. al. [1] and used in the detection theory as a model for non-gaussian noise. This class has a symmetric unimodal density characteristic. Various classes of densities are generated by a parameterization of the exponential decay of this density function. The Generalized Gaussian Family has the following density relation
{
}
α β (σ ,α ) α f ( xi ,α i ,σ i ) = i i i i exp − ( βi (σ i ,α i ) xi ) i (2.1) 2Γ 1 αi where α i >0, is a positive parameter that controls the distribution’s exponential rate of decay
σ i2 is the variance of the distribution Γ(.) is the gamma function, given by ∞
Γ(a ) = ∫ τ a −1e− a dτ
(2.2)
0
βi (σ i ,α i ) is a scaling function of σ i and α i , defined as
Γ −1 βi (σ i ,α i ) � σ i Γ
1
3 2 αi 1 αi
(2.3)
This generalized gaussian family can encompass a wide variety of distributions, e.g., For α i =1, we get the laplacian probability density function β (σ ,1) f ( xi ,1,σ i ) = i i exp − ( βi (σ i ,1) xi 2
{
)}
(2.4)
For α i =2, we get the gaussian probability density function
{
β (σ ,1) 2 f ( xi ,2,σ i ) = i i exp − ( βi (σ i ,2) xi ) π
}
(2.5)
As α i tends to infinity, we get the uniform density function β (σ , ∞) −1 1 ; ≤ xi ≤ f ( xi , ∞,σ i ) = i i 2 βi βi
estimating the deformation of the distribution from normality. Kurtotic measures have been extensively used in signal processing for classification of data distributions, and as a distance measure from gaussianity. It is defined as K (ς , xi ) =
{ }
E xi
2ς
(2.6)
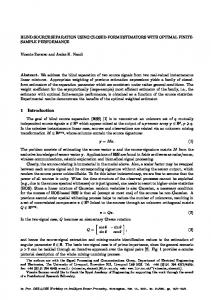
While as α i tends to zero, we get an impulse probability function As a function of α i and for σ i2 =1, some members of the family are presented in Fig. 1. 2
Some members of Generalized Gaussian Family, σ =1
{ }
E 2 xi
ς
(2.9)
For the generalized gaussian family, it can be simplified to 2ς + 1 1 Γ Γ α α K (ς , xi ) = i i ς +1 Γ2 αi
(2.10)
3 Gamma, α =0.5 i Laplacian, α =1 i Gaussian, α =2 i Uniform, α = ∞
2.5
2.3 Relationship between βi (σ σi ,α αi ) and αi
i
Imposing the statistical constraint of distribution integral on the generalized Gaussian distribution family, i.e., ∞
∫ f ( xi ,α i ,σ i ) dxi = 1
i
f(x ,α ,1)
2
i
1.5
we can find the relation between βi (σ i ,α i ) and α i to be
1
{ }
α βi (σ i ,α i )−αi = α i E xi i
0.5
0 -3
-2
-1
0
1
2
3
i
Figure 1. Some members of Generalized Gaussian Distribution Family
Based on the generalized gaussian density model in (2.1), we can characterize some of its statistical properties as follows
2.1 Generalized Moments The kth absolute moment for the generalized Gaussian distribution is given by ∞
{ }= ∫ k
xi
k
f ( xi ,α i ,σ i )dxi
(2.7)
−∞
where E {} . is the statistical expectation operator.
Due to the very parameterized nature of the generalized gaussian family and its ability to model a variety of source densities of interest to blind source recovery, we derive a generalized score function (nonlinearity) based on this family. This generalized score function inherits a nice parametric structure from its parameterized parent density. In an adaptive setting, the regulation parameter α i can be adapted during the adaptation for the source recovery algorithm. This very nature of the score function renders it useful for blind recovery type problems, where no a priori information about the characteristics of the source distribution may be available. The element-wise nonlinear score function required for the BSR problem has the definition [2,4,5,6] ϕ ( y) = −
Simplifying (2.7) using (2.1), we have k + 1 Γ α k E xi = βi (σ i ,α i )k i
{ }
(2.12)
2.4 Derivation of an Adaptive Score Function
x
E xi
(2.11)
−∞
∂ log p( y) T = [ϕ1( y1) ϕ2 ( y2 ) � ϕn ( yn )] ∂y
(2.13)
For the ith output with an exponential density function, the equation can be simplified to 1 Γ αi
(2.8)
∂pi ( yi ) ϕi ( yi ) = −
∂yi pi ( yi )
2.2 Generalized Kurtosis
where
The generalized kurtosis K (ς , xi ) is a statistical measure to describe the “tail weight” for a distribution, it does so by
yi – represents the ith output of the network
(2.14)
pi (yi) – represents the statistical probability density of the ith output
2.5 Choice of αi
Using the generalized gaussian family as the candidate density in the relation (2.14) for the score function, we have
In order to employ the proposed adaptive score function for the linear convolutive BSR, one needs to primarily focus on only three cases of α i such that a classification between supergaussian, sub- gaussian and gaussian distribution families can be made. Practically, a choice of α i for the computation of the score function, see (2.17), is made using the adapted value of kurtosis; see (2.18), by the following simple scheme.
∂ α i βi (σ i ,α i ) α exp − ( βi (σ i ,α i ) xi ) i ∂yi 2Γ 1 α i ϕi ( yi ) = − α α i βi (σ i ,α i ) exp − ( βi (σ i ,α i ) xi ) i 2Γ 1 αi by simple calculus we have α −1 ∂ ϕi ( yi ) = α i βi (σ i ,α i )αi yi i yi ∂yi
{
{
}
}
(2.15)
if κ i (.) ≥ ψ , α i ≤ 1 ; where ψ > 0 is a constant threshold (for super-gaussian source distributions) elseif κ i (.) ≤ −ξ , α i ≥ 3 ; where ξ > 0 a constant threshold (for sub-gaussian source distributions) else α i = 2 (for gaussian distribution)
(2.16)
Using (2.12) and the definition yi = yisign( yi ) , we have α −1 yi i sign( yi )
ϕi ( yi ) =
3. Simulation Results
{ }
(2.17)
κ i (n + 1) = γ iκ i (n) + (1 − γ i ) Ki ( yi (n))
(2.18)
α E yi i
where an appropriate choice of α i makes the nonlinearity suitable to a particular source distribution. This adaptive characterization of the source distribution can be done using the adaptation of the generalized kurtosis, see (2.9), on the batch-output of the BSR network. An efficient method to adaptively determine the output kurtosis is by using a forgetting factor, i.e., where κ i (.) - represents the adaptively determined normalized kurtosis for the ith output. By normalized kurtosis we imply that the computed kurtosis has been adjusted so that a perfect gaussian source will have zero kurtosis. A leptokurtic distribution (normalized kurtosis > 0) represents the super-gaussian family of distributions, while a platykurtic (normalized kurtosis < 0) distribution represents the family of sub-gaussian distributions. γ i - represents the forget factor for adaptive kurtosis determination
We present simulation results with a 3 × 3 IIR mixing environment. The demixing system is formulated as a state-space network [3,4,6]. For both simulations involving feedforward and feedback networks respectively, the structure for matrices A and B is kept fixed [5], whereas elements of matrices C and D are adapted. For an in depth discussion on the BSR algorithms see [3,5,6]. In all presented simulations, the source signals are chosen to possess different distributions, i.e., super-gaussian, gaussian and sub-gaussian respectively; the score function is adapted online along with the BSR algorithm. The convergence performance of the algorithm is measured using the multi-channel intersymbol interference (MISI) benchmark. MISI is a measure of the global transfer function diagonalization and permutation as achieved by the demixing network and is defined as ISI k =
Generalized Gaussian Score Function scaled to a Unit Square
0
-10 -1
-0.5
0
0.5
0
-0.5
0
0.5
α =4
α =5 -0.5
0
0.5
1
0.5
1
H ( z ) = [ Ae , Be , Ce , De ] –Transfer Function of Environment,
This environment model is assumed to be a 3 × 3 IIR filter m −1
n −1
∑ A m( k − i ) = ∑ B s ( k − i ) + v ( k ) i
-0.5
0
0.5
1
i =0
where A0
-0.5
0
0.5
=
1
B0
Figure 2. Scaled Generalized Gaussian Score Function for different values of parameter α
(3.2)
i
j =0
0
-1 -1
max p ,i G pij
G ( z ) = H ( z ) * H ( z ) - Global Transfer Function,
1
0
-1 -1
0
0
-1 -1
1
1
j =1
3.1 Environment Model -0.5
1
α =3
α =2
1
-1 -1
0
-1 -1
1
∑ i ∑ p G pij − max p ,i G pij
H ( z ) = [ A, B, C , D] –Transfer Function of Network.
1
α =1
α = 0.5
10
+
(3.1)
N
∑
th
− max p , j G pij
max p , j G pij
i =1
of the ith output; 0 ≤ γ i ≤ 1 K i ( yi (n)) -represents the generalized kurtosis measure for the n batch of the ith output
∑ j ∑ p G pij
N
∑
=
1 1 1 1 0.3 0.6
0.5 , A = 0.8 1 1 −0.1
,A 2 0.4
1
−1
0.8
−0.7
−1
1
0.3
−0.2
−1 0.6 1 −0.8
1
0.8
0.1 , B1 =
−0.5
0.5 −0.3 −0.2
0.06 0.16 −0.3
,B 2 0.6
0.5
0.6
0.2
−0.3
−0.43
=
=
0.3
0.4
−0.5
−0.1
−0.4
−0.06
.125 −0.1 0.08
0.3
0.06
0.2
0
0.4
−0.13
Theoretical Environment Inverse
Mixing Environment (impulse)
5
10
15
1
1
0.5
0.5
0
0 -0.2
0
5
10 Taps - n
15
20
5
10
15
-0.5
0
0
5
10 Taps - n
15
-0.5
20
-0.5 -1
0 1 2 3 4 5 6 7 8 91011121314
0.2
0.6
0
0.4
-0.2
5
10 Taps - n
15
20
0 1 2 3 4 5 6 7 8 91011121314 Taps - n
-0.2
0.5
0
0 -0.5
0 1 2 3 4 5 6 7 8 91011121314 Taps - n
-1
13
23
0
w 0
-0.5
-1
0 1 2 3 4 5 6 7 8 9101112
-1
0 1 2 3 4 5 6 7 8 9101112
0.6
1.5
0.4
1
0.2
-0.5
0 1 2 3 4 5 6 7 8 91011121314 Taps - n
w
12
w
1 0.5
0
-0.6
0
-0.4
0 1 2 3 4 5 6 7 8 9101112
0.5
0
0
-0.2
0 1 2 3 4 5 6 7 8 9101112 Taps - n
0 1 2 3 4 5 6 7 8 9101112
1 0.5
1
-0.2
0 1 2 3 4 5 6 7 8 91011121314
0 1 2 3 4 5 6 7 8 9101112
2
w
0
-0.4
0 1 2 3 4 5 6 7 8 9101112
0
-2
22
0.2 21
0.4
0.2
-0.2 0 1 2 3 4 5 6 7 8 91011121314
0.2
-0.4
0
0 1 2 3 4 5 6 7 8 91011121314
0.4
w
0
w11
w13
12
w
0
-0.2
20
0 1 2 3 4 5 6 7 8 91011121314
0.5
-0.1 0
h
32
0.2
-0.4
20
0 1 2 3 4 5 6 7 8 91011121314
-2
-1
33
-0.2
0
h
31
0.4
0.1
33
0.6
0.2
2
w
-1
20
20
-1
32
15
15
0
w
10
10
2
0
31
5
5
0.2 0
h
h
h
0
0
0.4
w23
20
-0.4
w33
15
-0.5
22
10
-0.5
-1
w11
13
5
23
0
22
0
21
0.5
4
1
1
0 -0.2
w
20
-0.2
32
15
0
w
10
0
-1
2
0.2
0
w31
5
0.5
-0.5
h
h
12
h
11
h
0
-0.2
Estimated Demixing Network by BSR 0.4
0.5 0.2
-0.5
0
-0.5
1
0.4 0
0.2
0
0.6
0.5
0.4
w
0.6
w21
1 0.5
-0.5
0 1 2 3 4 5 6 7 8 9101112 Taps - n
0 1 2 3 4 5 6 7 8 9101112 Taps - n
(a) (b) (c) Figure 3. (a) Mixing Environment Transfer Function (b) Theoretical Environment Inverse (c) Estimated Demixing Network Transfer Function Blind Source Recovery - using GGN
Convergence of Output Signal Kurtosis
Global Transfer Function after BSD stage
4
G(z)12
1
0
1
0
0
1
2 0
G(z)11
4
1
2
G(z)13
3
6
κ4 for y1
ISI for s1
8
0
0.5
1
1.5 number of iterations
2
2.5
0
3 x 10
0
0.5
1
1.5
2
2.5
4
-1
3
0
10
20
-1
30
0
10
20
30
-1
40
0
10
20
30
40
0
10
20
30
40
0
10
20
30
40
4
x 10
2
0
1 G(z)23
0
1 G(z)22
4
1
1
G(z)21
6
κ4 for y3
ISI for s2
8
0
0
2 0
0
0.5
1
1.5 number of iterations
2
2.5
-1
3 x 10
0
0.5
1
1.5
2
2.5
4
-1
3
0
10
20
30
-1
40
0
10
20
30
-1
40
4
x 10
2
0
1 G(z)33
0
1 G(z)32
4
1
1
G(z)31
6
κ4 for y2
ISI for s3
8
0
0
2 0
0
0.5
1
1.5 number of iterations
2
2.5
3 x 10
-1
0
0.5
1
1.5
2
2.5
4
-1
3
0
10
20
30
-1
40
0
10
20
30
40
-1
4
x 10
(a) (b) (c) Figure 4. Feedforward BSR Network (a) Convergence of MISI Index (b) Convergence of batch Kurtosis (c) Final Global Transfer Function 2
1
1
1
-1
2.5
3 x 10
0
0.5
1
1.5
2
2.5
4
x 10
2
κ4 for y3
4 2
3
-2
-2
-2
0
10
20
30
40
1.5 number of iterations
2
2.5
0
x 10
0
0.5
1
1.5
2
2.5
4
2
0.5
1
1.5 number of iterations
2
2.5
3 x 10
40
3
3
2
2
1
1
0
10
20
30
40
0
0 -1
0
10
20
30
-2
40
0
10
20
30
40
0
10
20
30
40
0 -1
0
10
20
30
-2
40
4
3
3
3
2
2
2
1 0 -1
0
30
1
1 0 -1
0
20
2
-2
3 x 10
2
4
κ4 for y2
ISI for s3
6
-1
3
10
3
G(z)32
1
0
1
31
0.5
0 -1
4
G(z)
0
1
-1
-1 0
2
-1
G(z)23
2
3
0
0
0.5
1
4
1.5
2
2.5
3 x 10
4
-2
1
G(z)33
1.5 number of iterations
0
G(z)22
1
21
0.5
G(z)
0
G(z)12
3
2 11
3
2
0
6 ISI for s2
3
G(z)
κ4 for y1
ISI for s1
2
0
Final Global Transfer Function
Convergence of Output Signal Kurtosis
4
G(z)13
Multichannel Feedback Blind Source Recovery 6
0 -1
0
10
20
30
-2
1 0 -1
0
10
20
30
40
-2
(a) (b) (c) Figure 5. Feedback BSR Network (a) Convergence of MISI Index (b) Convergence of batch Kurtosis (c) Final Global Transfer Function
and v(k ) - represents additive gaussian noise
3.2 Demixing Network Structure The theoretical inverse of this IIR mixing environment will be a 3 × 3 IIR matrix filter with each element having both numerator and denominator polynomials of degree 18. For both the feedforward and the feedback demixing cases, matrix C can be initialized with very small random numbers or all zero elements, while the matrix D is chosen to be an identity matrix. The number of taps per filter was chosen to be 21. Note for these equivariant minimum phase setups, any over-determination in the number of taps does not affect the performance of the algorithm.
4.
Conclusions
We have proposed an adaptive score function for BSR algorithms based on the generalized gaussian density model. Further we presented a method to adapt this score function online. This adaptive scheme for determination of a score function suited to an unknown source model has been extensively tested for both minimum phase and non-minimum phase, instantaneous as well as convolutive mixing. A couple of simulation examples have also been presented and it is observed that the proposed framework can recover sources from a complex convolutive mixture efficiently even when all the sources have different probability structure.
5. References [1] Miller J. H. & Thomas J. B.: “Detectors for Discrete-Time Signals in Non-Gaussian noise” in IEEE Transactions on Information Theory, Vol IT-18, no. 2, March 1972. Page(s) 241-250 [2] Zhang L. and Cichocki A.: “Blind deconvolution of dynamical systems: A state space approach”, Journal of Signal Processing, Vol. 4, No. 2, Mar. 2000, pp. 111-130. [3] Salam F. M., Erten G. and Waheed K.: “Blind Source Recovery: Algorithms for Static and Dynamic Environments”; Int’l Joint Conf. on Neural Networks, July 14-19, 2001Washington, D.C.; Vol. 2, Page(s) 902-907 [4] Waheed K. and Salam F. M.: “Blind Source Recovery: Some Implementation and Performance Issues”; 44th IEEE Midwest Symp. On Circuits and Systems; August 14-17 2001- Dayton Ohio. Vol. 2, Page(s) 580-583 [5] Waheed K. and Salam F. M.: “State Space Blind Source Recovery For Mixtures Of Multiple Source Distributions”; in Proc. of Intl Symposium on Circuits and Systems ISCAS-2002, May 26-29, 2002 – Phoenix, Az; Vol I, Page(s) 197-200. [6] Salam F. M. and Waheed K.: “State Space Feedforward and Feedback Structures for Blind Source Recovery”, in 3rd Int’l Conf. on ICA and BSS, December 9-12, 2001 - San Diego, CA; Page(s) 248-253