NIH Public Access Author Manuscript Nat Genet. Author manuscript; available in PMC 2012 June 18.
NIH-PA Author Manuscript
Published in final edited form as: Nat Genet. ; 43(11): 1119–1126. doi:10.1038/ng.950.
Exon capture analysis of G protein-coupled receptors identifies activating mutations in GRM3 in melanoma Todd D Prickett1,11, Xiaomu Wei1,11, Isabel Cardenas-Navia1,11, Jamie K Teer2,3, Jimmy C Lin4, Vijay Walia1, Jared Gartner1, Jiji Jiang1, Praveen F Cherukuri2, Alfredo Molinolo5, Michael A Davies6,7, Jeffrey E Gershenwald8,9, Katherine Stemke-Hale7, Steven A Rosenberg10, Elliott H Margulies2, and Yardena Samuels1 1Cancer Genetics Branch, National Human Genome Research Institute, US National Institutes of Health (NIH), Bethesda, Maryland, USA 2Genome
Technology Branch, National Human Genome Research Institute, NIH, Bethesda, Maryland, USA
NIH-PA Author Manuscript
3Genetic
Disease Research Branch, National Human Genome Research Institute, NIH, Bethesda, Maryland, USA 4Ludwig
Center for Cancer Genetics and Therapeutics, and Howard Hughes Medical Institute at the Johns Hopkins Kimmel Cancer Center, Baltimore, Maryland, USA 5Oral
and Pharyngeal Cancer Branch, National Institute of Dental and Craniofacial Research, NIH, Bethesda, Maryland, USA 6Department
of Melanoma Medical Oncology, University of Texas MD Anderson Cancer Center, Houston, Texas, USA 7Department
of Systems Biology, University of Texas MD Anderson Cancer Center, Houston,
Texas, USA 8Department
of Surgical Oncology, University of Texas MD Anderson Cancer Center, Houston,
Texas, USA 9Department
of Cancer Biology, University of Texas MD Anderson Cancer Center, Houston,
Texas, USA 10The
Surgery Branch, National Cancer Institute, NIH, Bethesda, Maryland, USA
NIH-PA Author Manuscript
© 2011 Nature America, Inc. All rights reserved. Correspondence should be addressed to Y.S. (
[email protected]). 11These authors contributed equally to this work. Accession codes. Accession codes: GRM3, CCDS5600.1; CHRM3, CCDS1616.1; LPHN2, CCDS1616.1; RXFP1, CCDS43276.1; GRM8, CCDS5794.1; CNR1, CCDS5015.1; OR1J2, CCDS35121.1; OR8B8, CCDS8446.1; OPN5, CCDS4923.1; OR8K1, CCDS31528.1; GPR98, CCDS47246.1; MEK, CCDS10216.1; NRAS, CCDS877.1; BRAF, CCDS5863.1; ERK, CCDS10672.1. Somatic variants are listed in Supplementary Table 2 and are deposited to the SRA (see URLs) with accession number SRA024490 and study number SRP003752. Note: Supplementary information is available on the Nature Genetics website. AUTHOR CONTRIBUTIONS T.D.P., I.C.-N., X.W., E.H.M. and Y.S. designed the study. K.S.-H., M.A.D., J.E.G. and S.A.R. collected and analyzed the melanoma samples. X.W., I.C.-N., J.K.T., J.G., P.F.C. and J.C.L. analyzed the genetic data. T.D.P., A.M., J.J. and V.W. produced and analyzed the functional data. All authors contributed to the final version of the paper. COMPETING FINANCIAL INTERESTS The authors declare no competing financial interests. Reprints and permissions information is available online at http://www.nature.com/reprints/index.html.
Prickett et al.
Page 2
Abstract NIH-PA Author Manuscript
G protein-coupled receptors (GPCRs), the largest human gene family, are important regulators of signaling pathways. However, knowledge of their genetic alterations is limited. In this study, we used exon capture and massively parallel sequencing methods to analyze the mutational status of 734 GPCRs in melanoma. This investigation revealed that one family member, GRM3, was frequently mutated and that one of its mutations clustered within one position. Biochemical analysis of GRM3 alterations revealed that mutant GRM3 selectively regulated the phosphorylation of MEK, leading to increased anchorage-independent growth and migration. Melanoma cells expressing mutant GRM3 had reduced cell growth and cellular migration after short hairpin RNA–mediated knockdown of GRM3 or treatment with a selective MEK inhibitor, AZD-6244, which is currently being used in phase 2 clinical trials. Our study yields the most comprehensive map of genetic alterations in the GPCR gene family.
NIH-PA Author Manuscript
Melanoma is a common form of skin cancer and, despite years of research, metastatic disease is often fatal1. Although some targeted treatment has been effective2, the results of these treatments are not long lasting, showing a need for new clinically relevant targets. GPCRs, which are activated by ligands, are integral in regulating various signaling pathways3,4. The importance these molecules play in human diseases is evident by the fact that 50–60% of the US Food and Drug Administration–approved therapeutics target GPCRs5. As GPCRs regulate pathways that affect cell growth, their genetic analysis in cancer is warranted. To identify somatic mutations in GPCRs, we performed a GPCR-targeted mutational analysis in tumor DNA derived from 11 melanoma samples. For each sample, we performed DNA capture using molecular inversion probes of 7,059 regions corresponding to 2,400 GPCR exons encoding 734 GPCR genes6. We then analyzed DNA samples enriched for GPCR exons by massively parallel sequencing using the Illumina GAII platform. We identified 755 potential non-synonymous mutations when comparing the molecular inversion probe results to the known HapMap sequence. To determine which alterations were somatic, we examined the genomic DNA derived from matched normal tissue. From these alterations, we confirmed 106 to be somatic in 94 different genes (Supplementary Table 1). Eleven of these genes harbored at least two somatic mutations (Supplementary Table 2). The coding sequence of these 11 genes was analyzed for somatic mutations in a total of 80 melanoma samples, as described previously7. Supplementary Figure 1 depicts the stages described above.
NIH-PA Author Manuscript
From the ~3.4 Mb of sequencing information obtained, we identified 115 non-synonymous, somatic mutations in 42 of the 80 tumors (Table 1). The number of C>T mutations was significantly greater than the number of other substitutions, resulting in a high prevalence of C:G>T:A transitions (P < 1 × 10⁻⁶) (Supplementary Fig. 2), consistent with melanoma mutation signatures8. We found a total of seven nonsense mutations and two splice site alterations, potentially resulting in aberrant or truncated proteins for five of the genes. We identified recurring alterations in CHRM3, RXFP1, OR8B8 and OR1J2, which harbored p.Pro421Leu/p.Pro421Ser, p.Ser269Phe, p.Ser74Phe and p.Asp109Asn, respectively, in two individuals. Using SIFT (sorting intolerant from tolerant)9, we determined a computational estimation of the effects of the mutations (Supplementary Table 3). A description of these genes and the likely nature of their mutations is given in the Supplementary Note.
GRM3 and GPR98 were the most frequently mutated genes in our screen. GRM3 had a 16.3% mutation rate, with 18 non-synonymous mutations in 13 of 80 tumors. GPR98 had a total of 42 non-synonymous mutations in 22 of 80 tumors (27.5%). As GRM3 belongs to the metabotropic family and was previously shown to be linked to tumorigenesis10, it was
Nat Genet. Author manuscript; available in PMC 2012 June 18.
Prickett et al.
Page 3
NIH-PA Author Manuscript
evaluated genetically in an additional panel consisting of 57 melanoma specimens11. In this screen, we discovered 11 non-synonymous alterations in nine tumors affecting 15.7% of the individuals analyzed and yielding a non-synonymous to synonymous ratio of 29:7, which is significantly higher than the non-synonymous to synonymous ratio of 2:1 predicted for nonselected passenger mutations (P < 0.05). This investigation allowed the identification of a mutational hotspot in GRM3; we found p.Glu870Lys in four different individuals with melanoma (one individual from the original panel and three from the second panel) (Supplementary Table 4 and Supplementary Fig. 3). The likelihood for the occurrence of four identical mutations is approximately 1.8 × 10⁻¹², suggesting that the GRM3 hotspot mutation is functionally important. Clinical information for all tumors harboring GPCR mutations is given in Supplementary Table 5. We focused on GRM3 (the group II metabotropic glutamate receptor-3 gene, or mGluR3), as two genetic observations suggested that the mutations in this gene may be functionally important for melanoma tumori-genesis: (i) GRM3 was one of the most highly mutated genes in the screen, and (ii) it contained a mini-hotspot (p.Glu870Lys).
NIH-PA Author Manuscript
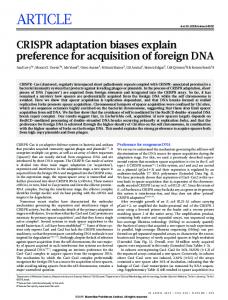
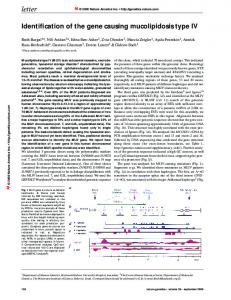
We functionally characterized four somatic mutations (resulting in p.Gly561Glu, p.Ser610Leu, p.Glu767Lys and p.Glu870Lys) discovered in GRM3 based on sequence conservation and their location within particular functional domains. To examine the biological effects of GRM3 mutations, we established stable pooled clones expressing either a vector control or wild-type or mutant (p.Gly561Glu, p.Ser610Leu, p.Glu767Lys or p.Glu870Lys) GRM3. We selected the melanoma cell lines A375 or Mel-STR, as they express wild-type GRM3. We saw similar levels of expression of GRM3 protein in both the A375 and Mel-STR stable clone cell lines, except for in the p.Glu767Lys and p.Glu870Lys mutants, which had reduced protein expression (Supplementary Fig. 4a,b). To examine the effects of GRM3 mutations on cell growth, we investigated growth rate on plastic (Fig. 1a). In the presence of media containing 10% serum, all clones grew similarly (Supplementary Fig. 5a,b). However, if we reduced the serum concentration, wild-type clones grew at a lower rate than mutant clones, except for the clone expressing the p.Glu870Lys alteration (Fig. 1a and Supplementary Fig. 5c). We also observed this difference in cell growth when we assessed the cells for anchorage independence, where cells expressing mutant GRM3 formed a significantly higher number of colonies compared to wild type or empty vector (Fig. 1b; P < 0.05 t-test).
NIH-PA Author Manuscript
The C-terminal region of GPCR proteins is important for binding signaling molecules involved in pathways such as the RAS-RAF-MEK pathway3,4. Mutations in or near this region of GRM3 may therefore affect signal transduction leading to increased cell proliferation, thus providing the biochemical basis for the growth differences described above. As group 2 metabotropic glutamate receptors can be activated by agonists such as DCG-IV12–14, we tested the biochemical effects of GRM3 alterations in the presence and absence of DCG–IV. We saw striking differences in MEK1/2 phosphorylation. When we stimulated Mel-STR clones with DCG-IV, there was a sevenfold to tenfold increased phosphorylation of MEK1/2 compared to wild-type-GRM3–expressing cells (Fig. 1c). We observed similar results in the A375 clones (Fig. 1d). Notably, Mel-STR cells harbor mutant RAS and A375 cells harbor mutant BRAF, both of which are known to activate MEK15, and so mutant GRM3 thus allowed further activation of the MEK pathway. Previous studies reported that activation of the MEK pathway increases cell migration16,17. As GRM3 variants activate the MEK pathway, we determined whether these variants also affect migration. To test this, we seeded A375 or Mel-STR pooled clones in serum-free medium in the presence or absence of DCG-IV and looked for migration (Fig. 2a,b). Mutant
Nat Genet. Author manuscript; available in PMC 2012 June 18.
Prickett et al.
Page 4
NIH-PA Author Manuscript
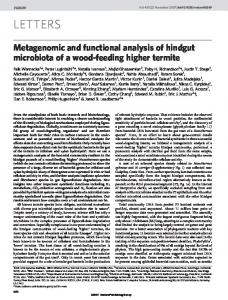
GRM3 expression increased migration compared to wild-type GRM3 or an empty vector containing cells in the absence of agonist (Fig. 2a,b; P < 0.05 t-test). Upon stimulation with DCG-IV, vector and wild-type–expressing cells migrated similarly to mutant-GRM3– expressing cells in the absence of stimuli (Fig. 2a,b). Our results suggest that expression of mutant GRM3 increases migration in the absence of growth factors or receptor agonists. To determine whether these phenotypes occur in vivo, A375 pooled clones expressing vector, wild-type or mutant GRM3 were administered to NOD/SCID mice by tail vein injection. Nine weeks after injection, macroscopic assessment of lung colonization showed that the groups injected with cells expressing vector, wild-type or mutant p.Gly561Glu had two to three mice with gross lung tumors. In contrast, most of the mice injected with cells expressing the p.Ser610Leu, p.Glu767Lys or p.Glu870Lys GRM3 alterations had pulmonary macrometastases (Fig. 2c). Microscopic examination allowed for the detection of micrometastases, with no significant difference being seen in their number or size (Supplementary Fig. 6a,b). Thus, expression of mutant forms of GRM3 in melanoma cells affects growth in vivo once the lung is colonized.
NIH-PA Author Manuscript NIH-PA Author Manuscript
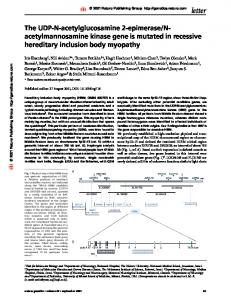
To assess if melanoma cells with endogenous GRM3 mutations are dependent on GRM3 signaling for proliferation and migration, we used short hairpin RNA (shRNA) to stably knock down GRM3 protein levels in melanoma cells that harbor either wild-type GRM3 or endogenous mutant GRM3. We confirmed specific targeting of GRM3 by transient transfection in HEK293T cells and immunoblotting, as well as by quantitative RT-PCR analysis (Fig. 3a–c). The shRNA had little effect on cells harboring wild-type GRM3 but significantly reduced the growth of cells harboring mutant forms of GRM3 (Fig. 3d–h and Supplementary Fig. 7a,b; P < 0.005, P < 0.008 and P < 0.004 for Fig. 3f,g,h, respectively). Depletion of GRM3 by shRNA in mutant-GRM3–expressing cells reduced their ability to migrate significantly compared to wild-type GRM3 cells targeted with GRM3 shRNA (Fig. 3i–m and Supplementary Fig. 7c,d). To determine whether similar results occur in vivo, melanoma cells harboring either wild-type or mutant GRM3 targeted with GRM3 or control shRNA were administered into Nu/Nu mice by subcutaneous injection. Nineteen days after injection, depletion of GRM3 had little effect on in vivo growth of cells harboring wild-type GRM3. In contrast, GRM3 knockdown significantly reduced the tumor growth induced by cells harboring mutant GRM3 (Fig. 3n–q; P < 0.0005 and P < 0.02 for Fig. 3o,q, respectively). As the shRNA-mediated phenotypes could be caused by specific or nonspecific effects, we engineered an exogenous, non-targetable wild-type GRM3 construct that harbors silent mutations in the region of GRM3 targeted by shRNA #3 to rescue the effects of knockdown of endogenous GRM3. Melanoma cells harboring the p.Glu573Lys alterations stably expressing either control or GRM3 shRNA #3 construct were transduced either with the lentiviral non-targetable GRM3 construct or with the empty vector as a control. To show that the non-targetable GRM3 is not knocked down in the presence of GRM3 shRNA #3, we transiently transfected HEK293T cells and immunoblotted for FLAG-GRM3 and GAPDH as a loading control (Supplementary Fig. 8a). Importantly, nontargetable GRM3-reconstituted cells showed significantly more migration than cells infected with the control vector (Supplementary Fig. 8b). These results suggest that certain GRM3 mutations are essential for cellular proliferation as well as for cell migration in melanoma cells. To evaluate whether inhibition of GRM3 signaling would result in a similar phenotype to depletion of endogenous GRM3, we exposed melanoma cells harboring either wild-type GRM3 or mutant GRM3 to AZD-6244 (Selumetinib, ARRY-142886), which is a selective, non-ATP–competitive small molecule inhibitor of MEK1/2 that is being tested in phase 2 clinical trials (see URLs). Exposure of melanoma cells to AZD-6244 inhibited MEK in mutant as well as in wild-type cells (Fig. 4a). However, the relative degree of inhibition was
Nat Genet. Author manuscript; available in PMC 2012 June 18.
Prickett et al.
Page 5
NIH-PA Author Manuscript
concentration dependent, resulting in greater inhibition of the mutant cells compared to wild-type cells. This suggested that mutant cells would be more sensitive to growth inhibition by AZD-6244 than wild-type cells. Indeed, exposure of most melanoma cells expressing mutant forms of GRM3 were 2–200-fold more sensitive to AZD-6244 compared to wild-type GRM3 cells (Fig. 4b and Table 2). The GRM3 mutations may be dependent on MEK signaling via BRAF, as evidenced by the genotypes of the investigated cells (Supplementary Table 6). To further investigate the relevance of mutant GRM3 to AZD-6244 sensitivity, we tested whether the sensitivity to MEK inhibition can be altered by modulating GRM3. To do this, we established a stable cell line overexpressing wild-type GRM3 in a mutant GRM3 background (Supplementary Fig. 9a). Exposure of these stable pools to AZD-6244 resulted in reduced cell proliferation, with a fourfold increased resistance in cells overexpressing wild-type GRM3 compared to control infected cells (Supplementary Fig. 9b,c). These results further suggest that AZD-6244 preferentially inhibits the signaling of cells expressing mutant GRM3.
NIH-PA Author Manuscript
The decreased growth of the mutant cells in the presence of AZD-6244 could have arisen either through alteration of the cell cycle or through increased cell death. To distinguish between these two possibilities, we performed FACS analysis and found that cells harboring mutant GRM3 showed a substantial increase in the levels of subG1-population cells (apoptotic cells) compared to wild-type cells (Fig. 4c). We observed similar results when we performed the experiment on a larger panel of mutant GRM3 cell lines (Fig. 4d; P < 0.05 ttest). We confirmed the apoptotic events by protein blot analysis of the cell lysates analyzed by FACS, which showed increased levels of cleaved PARP in mutant cells compared to wild-type cells (Fig. 4e). Thus, melanoma cell lines harboring mutant GRM3 are markedly more sensitive to MEK1/2 inhibition by AZD-6244, leading to increased cell death. In this study, we used a systematic approach combining exon capture and massively parallel sequencing to genetically characterize the GPCR gene family, allowing for the identification of GRM3 somatic mutations in melanoma. The high frequency of mutations found in GRM3, the finding of a mutational hotspot, as well as the functional assays, suggest GRM3 to be a driver in melanoma.
NIH-PA Author Manuscript
Taken together, our data highlight a model for melanoma pathogenesis in which activation of MEK by GRM3 alterations promotes the proliferation and migration of melanoma cells. Although further investigation into the mechanism of GRM3 activation of the MEK pathway is required, our study suggests that the presence of GRM3 mutations is expected to indicate subpopulations of individuals whose tumors are dependent on MEK signaling. The prior failure of MEK inhibitors to obtain significant tumor responses in many BRAF p.Val600Glu melanomas18,19 may have resulted at least in part from the absence of additional mutations that activate the MEK pathway, such as those in GRM3. Therefore, targeting MEK signaling in the presence of GRM3 mutations may have a role in the treatment of melanoma.
ONLINE METHODS Tumor tissues Tissue and melanoma cell lines used for the discovery and first validation in this study were described previously20.
URLs. Short Read Archive (SRA), http://trace.ncbi.nlm.nih.gov/Traces/sra/; phase 2 clinical trials, http://clinicaltrials.gov/; Consed, http://www.phrap.org/consed/consed.html; R, http://www.r-project.org/; ImageJ, http://rsbweb.nih.gov/ij/.
Nat Genet. Author manuscript; available in PMC 2012 June 18.
Prickett et al.
Page 6
NIH-PA Author Manuscript
For the validation set of melanomas, optimum cutting temperature– embedded frozen clinical specimens were obtained from the University of Texas MD Anderson Cancer Center under institutional review board–approved protocols. Hematoxylin and eosin–guided dissection and isolation of DNA from the tumor-enriched isolates has been described previously11. GPCR exon capture and analysis See the Supplementary Note and Supplementary Table 7. PCR, sequencing and mutational analysis of melanoma samples PCR and sequencing was done as previously described7,20,21. The primers used for PCR amplification are listed in Supplementary Table 8. The primary phase mutation screen was analyzed using Consed (see URLs). Variants were called using Polyphred 6.11 and DIPDetector (N. Hansen, unpublished data), an indel detector for improved sensitivity in finding insertions and deletions. Sequence traces of the secondary screen were analyzed using the Mutation Surveyor software package (SoftGenetics). Construction of wild-type, mutant and non-targetable GRM3 expression vectors
NIH-PA Author Manuscript
Human GRM3 (NM_000840) was cloned by PCR into pCDF1 or pcDNA3.1 as previously described7,20 using a clone (cat # MHS1010-9203778) purchased from Open Biosystems and with the primers listed in Supplementary Table 8. The p.Gly561Glu, p.Ser610Leu, p.Glu767Lys and p.Glu870Lys point mutants were made using Phusion PCR for sitedirected mutagenesis. Amplification of a non-targetable insert using the primers listed in Supplementary Table 9 was done as previously described7,20 and cloned into pCDF1 vector. Cell culture and transient expression Metastatic melanoma tumor, HEK 293T, A375, Mel-STR cell lines were maintained as previously described7,20. HEK 293T cells were transfected with Lipfectamine2000 reagent (Invitrogen) at a 6:1 ratio with DNA (μl:μg) using 3–5 μg of plasmid DNA. Immunoprecipitation and protein blotting Transfected cells or stable pooled clone cell extracts were analyzed by immunoprecipitation or protein blot analysis as previously described7,22. Pooled stable expression
NIH-PA Author Manuscript
Production of GRM3 lentivirus was done as previously described7. A375 and Mel-STR cells were seeded at 1.5 × 10⁶ per T75 flask 24 h before infection. Lentivirus for GRM3 (wild type, p.Gly561Glu, p.Ser610Leu, p.Glu767Lys and p.Glu870Lys) or empty vector control were used to infect cells as previously described7. A375 or Mel-STR pooled clones were selected in the presence of 3 μg/ml puromycin or 300 μg/ml G418 for several days, respectively. Stable expression of GRM3 proteins (wild type and mutants) was determined by SDS-PAGE analysis followed by immunoblotting with anti-FLAG and anti–α-tubulin to show equivalent expression among the pools. Signaling pathway stimulation A375 or Mel-STR pooled GRM3 clones were seeded in 6-well plates at 1–2 × 10⁵ cells per well the day before transfection. Cells were serum starved for 16 h before stimulation with 2.5 μM DCG-IV (Tocris Biosciences-Ellisville) for 10 min. Cell lysates were generated by direct lysis into 2× SDS sample buffer and then subsequently analyzed by protein blotting using anti–phopho-MEK1/2 (cat # 9154), anti-MEK1/2 (cat # 9126), anti-GAPDH (cat # CB
Nat Genet. Author manuscript; available in PMC 2012 June 18.
Prickett et al.
Page 7
1001) (Millipore-Billerica) or anti–α-tubulin (cat # CP06) (EMD-Calbiochem-Gibbstown) as a loading control.
NIH-PA Author Manuscript
Proliferation assays To examine growth potential, pooled A375 and Mel-STR GRM3 clones were seeded into 96-well plates at 250 cells per well in either 1%, 2.5% or 10% serum-containing medium and incubated for 13–17 days. Samples were analyzed as previously described7. Soft agar assay Mel-STR pooled GRM3 clones were plated in triplicate at 1,000 cells per well and in top plugs consisting of sterile 0.33% Bacto-Agar (Becton, Dickinson and Company) and 10% FBS (HyClone) in a 24-well plate. The lower plug contained sterile 0.5% Bacto-Agar and 10% FBS. After two weeks, the colonies were photographed and quantitated using ImageJ (NIH software). Migration assays Mel-STR or A375 pooled clones were seeded at 30,000 cells per well in serum-free medium or serum-free medium plus 2.5 μM DCG-IV and incubated for 16–18 h before harvesting. Inserts were analyzed as previously described20.
NIH-PA Author Manuscript
Lentiviral shRNA
NIH-PA Author Manuscript
Constructs for stable depletion of GRM3 (cat # RHS4533-NM_000840) were obtained from Open Biosystems and were confirmed to efficiently knockdown GRM3 at the protein level. Lentiviral stocks were prepared as previously described20. Melanoma cell lines (31T, 34T, 36T, 63T and 76T) were infected with shRNA lentiviruses for each condition (vector and two different GRM3-specific shRNAs). Selection of stable pooled clones was done in the presence of 3 μg/ml puromycin containing normal medium for 3–5 days before determining knockdown efficiency. Stably infected pooled clones were tested in functional assays. For the shRNA, inducible system constructs for stable depletion of GRM3 (cat # RHS4740NM_000840) were obtained from Open Biosystems and were confirmed to efficiently knockdown GRM3 at the message level. Lentiviral stocks were prepared as previously described20. Melanoma cell lines (31T or 36T) were infected with shRNA lentiviruses for each condition (vector and two different GRM3-specific shRNAs). Selection and growth were done as described above. Stably infected pooled clones were tested in functional assays. Sequences of stable shRNA knockdown plasmids for GRM3 are listed in Supplementary Table 10. Doxycycline-inducible shRNA knockdown clones were grown in the presence of 0.2 μg/ml of doxy-cycline for 7 days before any functional assays. The clones were kept in the presence of 0.2 μg/ml doxycycline throughout the experiment. To rescue shRNA-mediated knockdown of GRM3 in melanoma cell lines, the nontargetable GRM3-expressing lentivirus was made as described above and used to infect the melanoma cell line 63T. After infection, cells were given 96–120 h to recover from infection before being tested in functional assays. Quantitative real-time PCR Total RNA was extracted from pooled clones of melanoma cells 36T and 34T stably knocked down for endogenous GRM3 or from the doxycycline-induced clones 31T and 63T targeting GRM3 (in the presence of 0.2 μg/ml doxycyline for 7 days) following the manufacturer’s protocol for the RNeasy Mini Kit (QIAGEN #74101). Total RNA was eluted in 30 μl diethylpyrocarbonate (DEPC)-treated distilled H2O. A total of 1 μg of total RNA was used for single-strand complementary DNA (cDNA) synthesis using a SuperScript III
Nat Genet. Author manuscript; available in PMC 2012 June 18.
Prickett et al.
Page 8
NIH-PA Author Manuscript
First Strand kit (Invitrogen #18080-051). cDNA was amplified using the olido dT20 primer supplied in the kit. To test for loss of GRM3 message, we used 2 μl of cDNA in the PCR with either GRM3 primers or GAPDH primers (Supplementary Table 11) mixed with 2× Fast SYBR Green PCR mix at a final volume of 20 μl in triplicate (Applied Biosystems cat # 4355612). qRT-PCR analysis was done using the ABI 7900HT Fast Real-Time PCR system (with a standard program of stage 1: 50 °C for 2 min; stage 2: 95 °C for 10 min; stage 3: 40 cycles of 95 °C for 15 s and 60 °C for 1 min). Results were analyzed using Microsoft Excel. Tail-vein injection studies in mice NOD/SCID mice were purchased from Jackson Labs. All mice were housed in a pathogenfree facility and were given autoclaved food and water. A375 pooled clones with empty vector or wild-type GRM3 or mutant GRM3 were grown in T-175 flasks to 70–80% confluency. We resuspended 1 × 10⁶ cells in 100 μl of sterile PBS and injected them intravenously (in the tail) into 7–10-week-old NOD/SCID mice. Mice were monitored biweekly, and lungs were examined and quantified for tumor formation by excision from mice killed at day 60 (9 weeks) after injection. Subcutaneous injection studies in mice
NIH-PA Author Manuscript
Nu/Nu mice were purchased from Charles River Labs. All mice were housed in a pathogenfree facility and were given autoclaved food and water. 31T (pLKO.1, shRNA #1 or shRNA #3) or 36T (pLKO.1, shRNA #1 or shRNA #3) cell lines were grown in 4–6 T-175 flasks, each to 90% confluency. We resuspended 2.5 × 10⁶ cells in 200 μl of sterile 1× PBS and matrigel solution (1:1 v/v) (BD Biosciences #354234) and injected them subcutaneously into 6–8-week-old female Nu/Nu mice. Mice were monitored biweekly, and tumor diameters were measured using precision calipers for 17–20 days. For the shRNA inducible system, all mice were given sterile doxycycline food (5 g/mouse/day) and water. 31T (TRIPz-NC, sh639 or sh742) or 63T (TRIPz-NC, sh639 or sh742) cell lines were grown in 4–6 T-175 flasks, each to 90% confluency. We resuspended 2.5 × 10⁶ cells in 200 μl of sterile 1× PBS and matrigel solution (1:1 v/v) (BD Biosciences #354234) and injected subcutaneously into 6–8-week-old female Nu/Nu mice. Mice were monitored biweekly, and tumor diameters were measured using precision calipers for 17–20 days. Growth inhibition analysis
NIH-PA Author Manuscript
To test AZD-6244 (cat # S1008) (Selleck Chemicals LLC) inhibition on melanoma cell lines, we seeded 96-well plates at 2,000–5,000 cells per well and incubated them for 24 h before addition of inhibitor at concentrations from 2 nM to 30 μM. Once the inhibitor was added, cells were incubated for 72 h at 37 °C. Cells were then analyzed using CellTiter-Glo according to the manufacturer’s protocol (cat# G7571) (Promega). Plates were read on a Luminoskan Ascent (Thermo Scientific) plate reader and analyzed using Microsoft Excel and GraphPad Prism v5. Flow cytometry analysis Melanoma cells were seeded into T-25 flasks at densities of 3 × 10⁵ cells per flask in normal complete medium and incubated at 37 °C for 24 h before addition of AZD-6244. AZD-6244 or DMSO was added for 72 h at a concentration of 2 μM. Cells were then analyzed by FACS as previously described7. Statistical analysis Statistical analyses were performed using the R statistical package (see URLs) and Microsoft Excel. Nat Genet. Author manuscript; available in PMC 2012 June 18.
Prickett et al.
Page 9
Supplementary Material Refer to Web version on PubMed Central for supplementary material.
NIH-PA Author Manuscript
Acknowledgments We thank S. Gutkind, J. Cronin, H. Abaan, P. Cruz, J. Mullikin, N. Hansen and members of the US National Institutes of Health Intramural Sequencing Center Comparative Sequencing Program for generating the sequence data analyzed here. We thank S. Hoogstraten-Miller and I. Ginty for assistance with the mouse experiments and S. Anderson for assistance with FACS analysis. This work was supported by the Intramural Research Programs of the National Human Genome Research Institute and National Cancer Institute, US National Institutes of Health, USA. Grant support was also provided by the University of Texas MD Anderson Cancer Center Melanoma Informatics, Tissue Resource and Pathology Core and the Melanoma Specialized Programs of Research Excellence (P50 CA93459). M.A.D. is supported by funding from the Melanoma Research Alliance, the American Society of Clinical Oncology and the MD Anderson Physician-Scientist Program. A.M. is supported by the Intramural Research program of the National Institute of Dental and Craniofacial Research, NIH.
References
NIH-PA Author Manuscript NIH-PA Author Manuscript
1. Jemal A, et al. Cancer statistics, 2009. CA Cancer J Clin. 2009; 59:225–249. [PubMed: 19474385] 2. Flaherty KT, et al. Inhibition of mutated, activated BRAF in metastatic melanoma. N Engl J Med. 2010; 363:809–819. [PubMed: 20818844] 3. Dorsam RT, Gutkind JS. G-protein-coupled receptors and cancer. Nat Rev Cancer. 2007; 7:79–94. [PubMed: 17251915] 4. Lee HJ, Wall B, Chen S. G-protein-coupled receptors and melanoma. Pigment Cell Melanoma Res. 2008; 21:415–428. [PubMed: 18582227] 5. Flower DR. Modelling G-protein-coupled receptors for drug design. Biochim Biophys Acta. 1999; 1422:207–234. [PubMed: 10548717] 6. Porreca GJ, et al. Multiplex amplification of large sets of human exons. Nat Methods. 2007; 4:931– 936. [PubMed: 17934468] 7. Prickett TD, et al. Analysis of the tyrosine kinome in melanoma reveals recurrent mutations in ERBB4. Nat Genet. 2009; 41:1127–1132. [PubMed: 19718025] 8. Greenman C, et al. Patterns of somatic mutation in human cancer genomes. Nature. 2007; 446:153– 158. [PubMed: 17344846] 9. Ng PC, Henikoff S. SIFT: predicting amino acid changes that affect protein function. Nucleic Acids Res. 2003; 31:3812–3814. [PubMed: 12824425] 10. Pollock PM, et al. Melanoma mouse model implicates metabotropic glutamate signaling in melanocytic neoplasia. Nat Genet. 2003; 34:108–112. [PubMed: 12704387] 11. Davies MA, et al. Integrated molecular and clinical analysis of AKT activation in metastatic melanoma. Clin Cancer Res. 2009; 15:7538–7546. [PubMed: 19996208] 12. Aronica E, et al. Expression and functional role of mGluR3 and mGluR5 in human astrocytes and glioma cells: opposite regulation of glutamate transporter proteins. Eur J Neurosci. 2003; 17:2106– 2118. [PubMed: 12786977] 13. Brabet I, et al. Comparative effect of L–CCG-I, DCG-IV and γ-carboxy-L-glutamate on all cloned metabotropic glutamate receptor subtypes. Neuropharmacology. 1998; 37:1043–1051. [PubMed: 9833633] 14. Nishi N, Odagaki Y, Koyama T. Pharmacological characterization of metabotropic glutamate receptor-mediated high-affinity GTPase activity in rat cerebral cortical membranes. Br J Pharmacol. 2000; 130:1664–1670. [PubMed: 10928972] 15. Solit DB, et al. BRAF mutation predicts sensitivity to MEK inhibition. Nature. 2006; 439:358– 362. [PubMed: 16273091] 16. Bian D, et al. Lysophosphatidic acid stimulates ovarian cancer cell migration via a Ras-MEK kinase 1 pathway. Cancer Res. 2004; 64:4209–4217. [PubMed: 15205333] 17. Yu JJ, et al. Estrogen promotes the survival and pulmonary metastasis of tuberin-null cells. Proc Natl Acad Sci USA. 2009; 106:2635–2640. [PubMed: 19202070]
Nat Genet. Author manuscript; available in PMC 2012 June 18.
Prickett et al.
Page 10
NIH-PA Author Manuscript
18. McDermott DF, et al. Double-blind randomized phase 2 study of the combination of sorafenib and dacarbazine in patients with advanced melanoma: a report from the 11715 Study Group. J Clin Oncol. 2008; 26:2178–2185. [PubMed: 18445842] 19. Rinehart J, et al. Multicenter phase II study of the oral MEK inhibitor, CI-1040, in patients with advanced non-small-cell lung, breast, colon, and pancreatic cancer. J Clin Oncol. 2004; 22:4456– 4462. [PubMed: 15483017] 20. Palavalli LH, et al. Analysis of the matrix metalloproteinase family reveals that MMP8 is often mutated in melanoma. Nat Genet. 2009; 41:518–520. [PubMed: 19330028] 21. Viloria CG, et al. Genetic inactivation of ADAMTS15 metalloprotease in human colorectal cancer. Cancer Res. 2009; 69:4926–4934. [PubMed: 19458070] 22. Wei X, et al. Mutational and functional analysis reveals ADAMTS18 metalloproteinase as a novel driver in melanoma. Mol Cancer Res. 2010; 8:1513–1525. [PubMed: 21047771]
NIH-PA Author Manuscript NIH-PA Author Manuscript Nat Genet. Author manuscript; available in PMC 2012 June 18.
Prickett et al.
Page 11
NIH-PA Author Manuscript Figure 1.
NIH-PA Author Manuscript
Effects of GRM3 alterations on cell growth and MEK phosphorylation. (a) Somatic alterations in GRM3 cause increased proliferation in reduced serum. We seeded A375 pooled GRM3 clones expressing wild-type, p.Gly561Glu, p.Ser610Leu, p.Glu767Lys, p.Glu870Lys or vector alone in 96-well plates in the presence of reduced serum (1% FBS). We harvested the plates and analyzed them by SYBR Green I on a BMG Labtech FluorOptima. Error bars, standard deviation (s.d.). (b) Mutant GRM3 shows anchorageindependent growth. We seeded Mel-STR cells in a top plug of agar and allowed them to incubate for 2 weeks before analysis by light microscopy and counting using US National Institutes of Health (NIH) ImageJ software (see URLs). Error bars, s.d. n = 3. Students ttests in all instances showed a *P < 0.05, except for in the test of vector versus wild type. (c) Mutant GRM3 activates MEK1/2 upon DCG-IV stimulation in Mel-STR and A375 cells. We serum starved Mel-STR pooled GRM3 clones seeded in 6-well dishes for 4 h before the addition of either 2.5 μM DCG-IV or vehicle for 10 min. After lysis of the cells, we analyzed the lysates on sodium dodecyl sulfate polyacrylamide gel electrophoresis (SDSPAGE) gels and immunoblotted them with corresponding antibodies. We generated the ratios shown by ImageJ and Microsoft Excel analysis of phosphorylated protein to total protein blots. (d) Mutant GRM3 activates MEK1/2 upon DCG-IV stimulation in A375 cells. We analyzed A375 pooled GRM3 clones as described in c.
NIH-PA Author Manuscript Nat Genet. Author manuscript; available in PMC 2012 June 18.
Prickett et al.
Page 12
NIH-PA Author Manuscript NIH-PA Author Manuscript
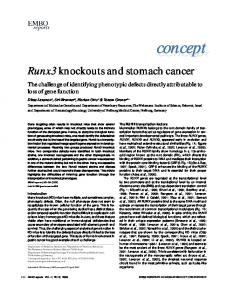
Figure 2. GRM3 mutations increase migration in vitro and in vivo
(a) A375 pooled GRM3 clones in the absence of stimulus migrate as well as those stimulated with the group 2 metabotropic agonist DCG-IV. We seeded A375 clones in Boyden chambers in either the absence of stimulus of, or in the presence of, 2.5 μM DCGIV and assessed them for their ability to migrate 16 h later. Error bars, s.d. (b) We analyzed Mel-STR pooled GRM3 clones for migration as described in a. We analyzed stained wells using a Zeiss microscope 10× lens and counted them with NIH ImageJ software. Error bars, s.d. n = 3. (c) We intravenously injected NOD/SCID mice with A375 pooled GRM3 clones expressing the wild-type, p.Gly561Glu, p.Ser610Leu, p.Glu767Lys, p.Glu870Lys or vector alone and examined them after nine weeks. The graph indicates the number of mice that had lung macrometastases (n = 10; P < 0.05, Fisher’s exact test). Shown are representative images of lungs from mice injected with the vector, wild type or mutant-expressing A375 clones.
NIH-PA Author Manuscript Nat Genet. Author manuscript; available in PMC 2012 June 18.
Prickett et al.
Page 13
NIH-PA Author Manuscript NIH-PA Author Manuscript Figure 3.
NIH-PA Author Manuscript
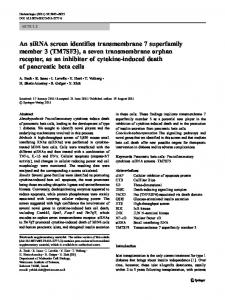
Expression of mutant GRM3 provides cell proliferation and survival signals in melanoma. (a) Our protein blot analysis shows that expressing GRM3 shRNA decreases endogenous GRM3 levels. We analyzed HEK 293T cells co-transfected with shRNA targeting GRM3 and FLAG-GRM3 by immunoblot. We analyzed the lysates in parallel using anti-GAPDH. (b,c) Our quantitative RT-PCR (qRT-PCR) analysis shows that GRM3 shRNA decreases endogenous levels of GRM3. Error bars, s.d. n = 3. qRT-PCR analysis of the wild-type GRM3 cell line (34T) (b) and the mutant (p.Gly561Glu) GRM3 cell line (36T) (c) using GRM3- or GAPDH-specific primers. (d–h) Growth curves of representative melanoma cell lines transduced with shRNA. Error bars, s.d. n = 4. (i–m) Stable knockdown of GRM3 in mutant-GRM3–expressing cells causes decreased migration compared to wild-type– expressing cells. We seeded wild-type GRM3 melanoma cell lines stably transduced (i,j) or mutant GRM3 melanoma cell lines stably transduced (k–m) with either empty vector, shRNA #1 or shRNA #3 (GRM3) in Boyden chamber wells in triplicate and incubated them for 16–72 h before analysis. We quantitated the results using a Student’s t-test. Error bars, s.d. n = 3. (n,o) We subcutaneously injected Nu/Nu mice with either 31T or 36T GRM3 clones stably infected with pLKO.1, shRNA #1 or shRNA #3 against endogeneous GRM3 or 31T (wild-type GRM3) or 63T (p.Glu573Lys) GRM3 clones stably infected with the doxycycline-inducible TRIPz NC, sh639 or sh742 shRNA against endogenous GRM3. Nat Genet. Author manuscript; available in PMC 2012 June 18.
Prickett et al.
Page 14
NIH-PA Author Manuscript
Graphs show volumetric measurements of 31T (n), 36T GRM3 (constitutive knockdown clones) (o), 31T (doxycycline-inducible clones) (p) or 63T GRM3 (doxycycline-inducible clones) (q) tumor-bearing mice. We performed all in vivo studies from n = 6 mice. Error bars, s.d.
NIH-PA Author Manuscript NIH-PA Author Manuscript Nat Genet. Author manuscript; available in PMC 2012 June 18.
Prickett et al.
Page 15
NIH-PA Author Manuscript NIH-PA Author Manuscript
Figure 4.
NIH-PA Author Manuscript
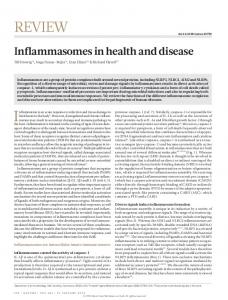
Melanoma cell lines expressing GRM3 mutants show increased sensitivity to inhibition of MEK by AZD-6244. (a) Immunoblot analysis of representative melanoma cell lines harboring either wild-type or mutant GRM3. We treated the cells with the indicated concentration of AZD-6244 and analyzed them for ERK1/2 activation. We treated cells for 1 h with AZD-6244 or vehicle alone as a control. We subjected the lysates to protein blot analysis with anti-ERK1/2 (α-ERK1/2), anti– P-ERK1/2 (α-P-ERK1/2) and anti-GAPDH as a loading controls. (b) Representative dose-response curves showing the efficacy of AZD-6244 against GRM3 mutant lines compared to wild-type GRM3 lines. The relative cell numbers after we treated the cells for 72 h with increasing concentrations (0.002–30 μM) of AZD-6244, as estimated by CellTiter-Glo and plotted as percent survival, as compared to vehicle-treated control, versus log [AZD-6244] concentration in nM (where 1 is 10 nM AZD-6244). We generated fitted lines using four-parameter nonlinear regression. Error bars, s.d. n = 3. (c) FACS analysis of wild-type (2T) and p.Ser154Phe, p.Asp280Asn, p.Arg352Trp or p.Glu870Lys mutant (68T) cells showing the cell-cycle distribution (propidium iodide staining; x axis) versus cell count (y axis). Shown are representative plots. (d) Quantification of FACS-sorted AZD-6244–treated cells. We determined the percentage of apoptotic cells based on the subG1 population for vehicle-treated cells or AZD-6244– treated cells. Error bars, s.d. (e) Immunoblot analysis of representative melanoma lines expressing wild-type or mutant GRM3 after AZD-6244 treatment using the indicated antibodies to assess PARP cleavage.
Nat Genet. Author manuscript; available in PMC 2012 June 18.
NIH-PA Author Manuscript
NIH-PA Author Manuscript
Nat Genet. Author manuscript; available in PMC 2012 June 18.
CIRL2
LPHN2
CL2
HM3
CHRM3
689.1
1616.1
NM_012302
NM_000740
10 (8.8)
8 (10.0)
c.1324-13T>C c.1402G>T
2 2 3 3 3 3 3 3 3 3 3 4 5
68T 29T 6T 98T 39T 7T 36T 63T 76T 32T 22T 68T
1 1 1 1 1
91T 12T 100T 19T
48T
4
4
1
7T 21T
85T
c.599G>A
1
39T
c.563C>T
c.529C>T
c.1741T>A
c.1330A>C
c.1282C>T
c.1262C>T
c.1261C>T
c.94G>A
1
34T
c.74C>T
c.2608G>A
c.2543G>A
c.2299G>A
c.1829C>T
c.1717G>A
c.1682G>A
c.1642G>A
c.1549G>A
c.1531G>A
c.1054C>T
c.838G>A
2
c.575C>T
c.461C>T
c.263G>A
c.176G>A
c.53G>A
Nucleotidec
68T
1
1
1
1
Exon
85T
68T
85T
76T
18 (16.3)
Tumor
mGlu3
NM_000840
No. of mutations (% tumors affected)b
MGLUR3
5600.1
RefSeq accessiona
21T
GLUR3
GRM3
CCDS accessiona
GPRC1C
Other names
Gene
Somatic mutations identified in recurrently mutated GPCRs
p.Ser188Phe
p.Pro177Ser
p.Phe581Ile
p.Asn444His
p.Pro428Ser
p.Pro421Leu
p.Pro421Ser
p.Trp200X
p.Gly32Arg
p.Ser25Phe
p.Glu870Lys
p.Gly848Glu
p.Glu767Lys
p.Ser610Leu
p.Glu573Lys
p.Gly561Glu
p.Asp548Asn
p.Glu517Lys
p.Asp511Asn
p.Val468Leu
Splice site
p.Arg352Trp
p.Asp280Asn
p.Pro192Leu
p.Ser154Phe
p.Gly88Glu
p.Arg59Gln
p.Gly18Glu
Amino Acidc
OLF
OLF
N/A
7TM_1
7TM_1
7TM_1
7TM_1
7TM_1
N/A
N/A
N/A
N/A
7TM_3
7TM_3
N/A
N/A
NCD3G
NCD3G
NCD3G
PBP1_mGluRgroupII
PBP1_mGluRgroupII
PBP1_mGluRgroupII
PBP1_mGluRgroupII
PBP1_mGluRgroupII
PBP1_mGluRgroupII
PBP1_mGluRgroupII
PBP1_mGluRgroupII
N/A
Functional domain
NIH-PA Author Manuscript
Table 1 Prickett et al. Page 16
NIH-PA Author Manuscript
Nat Genet. Author manuscript; available in PMC 2012 June 18.
CNR1
GRM8
RXFP1
10
17T 76T 85T
mGlu8
71T 76T 64T 64T
CB-R
CB1
CB1A
CB1K5
CB1R
19T
CANN6
104T
8
29T
MGLUR8
RP1-23D17.1
8
95T
MGC126724
1
1
1
1
1
1
7
7
3
34T
1
55T
GPRC1H
1
16
16
10
GLUR8
6 (6.3)
85T
NM_016083
13T
RXFPR1
5015.1
17
55T
MGC142177
76T
55T
FLJ41058
16
104T
4 10
MGC138347
8 (8.8)
63T
LGR7.2
NM_000845
19
76T
7T
5794.1
19
13T
4
18
63T
104T
16
76T
76T
8 (7.5)
13
39T
LGR7.10
NM_021634
7 10
76T
4
Exon
LGR7.1
LGR7 43276.1
Tumor
LPHH1
No. of mutations (% tumors affected)b 80T
RefSeq accessiona
LEC1
CCDS accessiona
NIH-PA Author Manuscript
Other names
c.919C>T
c.905A>C
c.765G>A
c.659G>A
c.145C>T
c.28G>C
c.2681C>T
c.2318T>A
c.1946C>T
c.1394G>A
c.1387G>A
c.776C>T
c.143T>A
c.-11C>T
c.1837G>A
c.1636C>T
c.1525G>A
c.1405C>T
c.806C>T
c.806C>T
c.368C>T
c.365C>T
c.3992G>A
c.3618G>A
c.3422C>T
c.3116C>T
c.2896G>A
c.2225C>T
c.1609G>A
c.1057T>C
Nucleotidec
p.Arg307Cys (LOH)
p.His302Pro (LOH)
p.Trp255X
p.Arg220Lys
p.Pro49Ser
p.Asp10His
p.Ser894Phe
p.Val773Asp (LOH)
p.Ser649Phe
p.Gly465Glu
p.Glu463Lys
p.Pro259Leu
p.Leu48X
Splice site
p.Ala613Thr (LOH)
p.Pro546Ser
p.Glu509Lys
p.Arg469Cys
p.Ser269Phe
p.Ser269Phe
p.Ser123Leu
p.Pro122Leu
p.Ser1331Asn
p.Met1206Ile
p.Ser1141Leu
p.Ser1039Phe
p.Glu966Lys (LOH)
p.Ser742Leu
p.Glu537Lys
p.Tyr353His (LOH)
Amino Acidc
7TM_1
7TM_1
7TM_1
7TM_1
N/A
N/A
N/A
7TM_3
7TM_3
ANF_R
ANF_R
ANF_R
N/A
N/A
7TM_1
7TM_1
7TM_1
7TM_1
N/A
N/A
N/A
N/A
Latrophilin
Latrophilin
Latrophilin
7TM_2
7TM_2
N/A
N/A
OLF
Functional domain
NIH-PA Author Manuscript
Gene
Prickett et al. Page 17
NIH-PA Author Manuscript
GPR98
OR8K1
1
1T
Nat Genet. Author manuscript; available in PMC 2012 June 18. 31 31 33 34
77T 92T 39T 58T
VLGR1b
28
28
1T 55T
26
24
VLGR1
76T
USH2B
20
14
7
1
1
6
4
USH2C
37T
MASS1
85T
13T
76T
43 (27.5)
104T
NM_032119
36T
KIAA0686
47246.1
2 (2.5)
1
1T
3
1
76T
90T
1
74T
FEB4
DKFZp761P0710
OR8N1P
NM_001002907
3 (3.8)
1
64T
OR11-182 31528.1
NM_181744
1
76T
1
1
1
1
Exon
55T
TMEM13
4923.1
6 (5.0)
85T
NEUROPSIN
OPN5
NM_012378
PGR12
TPCR85
OST044
OR9-19
OR1J5
8446.1
23T
OR1J3
72T
85T
HSA5
4 (5.0)
Tumor
HG152
NM_054107
No. of mutations (% tumors affected)b
36T
35121.1
RefSeq accessiona
FLJ16828
RP11-542K23.4
OR8B8
OR1J2
CNR
CCDS accessiona
NIH-PA Author Manuscript
Other names
c.8093A>T
c.7330C>T
c.6905C>T
c.6901C>T
c.6229G>A
c.5815G>A
c.5515C>T
c.5282C>T
c.3925C>T
c.2570G>A
c.853C>T
c.770T>C
c.409C>A
c.1007C>T
c.545C>T
c.278C>A
c.G925T
c.885G>T
c.412C>T
c.361G>A
c.221C>T
c.221C>T
c.730C>T
c.467C>T
c.325G>A
c.325G>A
Nucleotidec
p.Asn2698Ile
p.Leu2444Phe (LOH)
p.Thr2302Ile
p.Gln2301X
p.Glu2077Lys
p.Glu1939Lys
p.His1839Tyr
p.Ser1761Phe
p.Pro1309Ser
p.Trp857X
p.Arg285Cys
p.Phe257Leu
p.Leu137Met
p.Thr336Ile
p.Ser182Leu
p.Ser93Tyr
p.Ala309Ser
p.Lys295Asn
p.Pro138Ser
p.Asp121Asn
p.Ser74Phe (LOH)
p.Ser74Phe (LOH)
p.His244Tyr (LOH)
p.Ser156Phe
p.Asp109Asn
p.Asp109Asn (LOH)
Amino Acidc
N/A
N/A
N/A
N/A
Calx-beta
Calx-beta
N/A
Calx-beta
N/A
N/A
N/A
7TM_1
7TM_1
N/A
7TM_1
7TM_1
N/A
N/A
7TM_1
7TM_1
7TM_1
7TM_1
7TM_1
7TM_1
7TM_1
7TM_1
Functional domain
NIH-PA Author Manuscript
Gene
Prickett et al. Page 18
NIH-PA Author Manuscript CCDS accessiona
RefSeq accessiona
No. of mutations (% tumors affected)b
NIH-PA Author Manuscript
Other names
c.9049C>T c.9109C>T
42 42 44 45 46 50 52 52 52 53 53 55 57 61 62 65 69 73 73 74 74 74 74 74 74 74 79 78
76T 4T 21T 81T 17T 63T 76T 85T 85T 55T 17T 18T 37T 44T 17T 1T 55T 71T 44T 76T
Nat Genet. Author manuscript; available in PMC 2012 June 18. 21T 76T 76T 34T 76T 33T 76T 74T
c.16825G>A
c.17041C>T
c.15832G>A
c.15688G>A
c.15644C>T
c.15407C>T
c.15398T>A
c.15376G>A
c.15106G>A
c.14846C>T
c.14837G>A
c.14032G>A
c.13151C>T
c.12595G>A
c.12425G>A
c.11869G>A
c.11563G>A
c.11107C>T
c.11087G>A
c.10888G>A
c.10852G>A
c.10789G>A
c.10472C>T
c.9826G>A
c.9679C>T
c.9524C>T
c.8461G>A
37
76T
c.8201G>A
Nucleotidec
35
Exon
45T
Tumor
p.Asp5609Asn
p.Gln5681X
p.Gly5278Ser
p.Glu5230Lys
p.Ser5215Phe
p.Ser5136Phe
p.Met5133Lys
p.Asp5126Asn
p.Asp5036Asn (LOH)
p.Ser4949Leu
p.Gly4946Glu
p.Gly4678Arg
p.Ser4384Phe
p.Gly4199Arg
p.Arg4142Gln
p.Ala3957Thr
p.Glu3855Lys
p.Pro3703Ser
p.Gly3696Glu
p.Gly3630Arg
p.Glu3618Lys
p.Glu3597Lys
p.Ser3491Phe
p.Glu3276Lys
N/A
N/A
N/A
N/A
N/A
N/A
N/A
N/A
N/A
N/A
N/A
N/A
N/A
N/A
N/A
N/A
N/A
N/A
N/A
N/A
Calx-beta
Calx-beta
N/A
N/A
N/A
(LOH)
N/A
p.Arg3227d
N/A
Calx-beta
N/A
N/A
Functional domain
p.Thr3175Ile
p.Pro3037Ser
p.His3017Tyr
p.Glu2821Lys
p.Gly2734Glu
Amino Acidc
NIH-PA Author Manuscript
Gene
Prickett et al. Page 19
RefSeq accessiona 21T
Tumor 84
Exon c.17965C>T
Nucleotidec p.Leu5989Phe
Amino Acidc 7TM_2
Functional domain
Nucleotide and amino acid changes resulting from mutation. ‘LOH’ refers to cases wherein the wild-type allele was lost and only the mutant allele remained. ‘Splice site’ refers to a case wherein the alteration affected fifteen bases spanning the exon. 7TM_1, 7 transmembrane receptor; 7TM_2, 7 transmembrane receptor (secretin family); 7TM_3, 7 transmembrane sweet-taste receptor of 3 GPCR; PBP1_mGluR_groupII, receptor family ligand binding region; latrophilin cytoplasmic, C-terminal region; NCD3G, 9 cysteines domain of family 3 GPCR; OLF, olfactomedin-like domain; calx-beta, calxbeta domain; N/A, not available.
c
No. of mutations (% tumors affected)b
Number of non-synonymous and splice site mutations observed and percent of tumors affected for each of the 11 genes in the panel of 80 melanoma cancers.
Accession numbers for mutated GPCR in the UCSC and GenBank datasets.
b
a
NIH-PA Author Manuscript CCDS accessiona
NIH-PA Author Manuscript
Other names
NIH-PA Author Manuscript
Gene
Prickett et al. Page 20
Nat Genet. Author manuscript; available in PMC 2012 June 18.
Prickett et al.
Page 21
Table 2
NIH-PA Author Manuscript
EC50 growth inhibition EC50 (nM)a
s.e.m.
68T (p.Ser154Phe, p.Asp280Asn, p.Arg352Trp or p.Glu870Lys)
128
131
63T (p.Glu573Lys)
179
95
Tumor line
29T (splice site)
226
100
1075
145
55T (wild type)
13,357
156
76T (p.Gly88Glu or p.Ser610Leu)
15219
205
39T (p.Glu517Lys)
>30,000
>500
71T (wild type)
>30,000
478
49T (wild type)
>30,001
>500
13T (wild type)
>30,000
>500
36T (p.Gly561Glu)
a
EC50 (half maximal effective concentration) values for cell growth inhibition by AZD-6244 of melanoma cell lines harboring wild-type or mutant
GRM3.
NIH-PA Author Manuscript NIH-PA Author Manuscript Nat Genet. Author manuscript; available in PMC 2012 June 18.