PHYTOCHEMICAL ANALYSIS Phytochem. Anal. 15, NMR 345–354 (2004) ASSIGNMENTS OF CANNABINOIDS AND CANNABIFLAVONOIDS Published online in Wiley InterScience (www.interscience.wiley.com). DOI: 10.1002.pca.787
345
NMR Assignments of the Major Cannabinoids and Cannabiflavonoids Isolated from Flowers of Cannabis sativa Young Hae Choi,1 Arno Hazekamp,1 Anja M. G. Peltenburg-Looman,1 Michel Frédérich,1,2 Cornelis Erkelens,3 Alfons W. M. Lefeber3 and Robert Verpoorte1,* 1
Division of Pharmacognosy, Section Metabolomics, Institute of Biology, Leiden University, PO Box 9502, 2300 RA Leiden, The Netherlands Laboratory of Pharmacognosy, Natural and Synthetic Drug Research Center, University of Liège, Liège, Belgium Division of NMR, Leiden Institute of Chemistry, Gorlaeus Laboratories, Leiden University, PO Box 9502, 2300 RA Leiden, The Netherlands
2 3
The complete 1H- and 13C-NMR assignments of the major Cannabis constituents, ∆9-tetrahydrocannabinol, tetrahydrocannabinolic acid, ∆8-tetrahydrocannabinol, cannabigerol, cannabinol, cannabidiol, cannabidiolic acid, cannflavin A and cannflavin B have been determined on the basis of one- and two-dimensional NMR spectra including 1H- and 13C-NMR, 1H-1H-COSY, HMQC and HMBC. The substitution of carboxylic acid on the cannabinoid nucleus (as in tetrahydrocannabinolic acid and cannabidiolic acid) has a large effect on the chemical shift of H-1″″ of the C5 side chain and 2′′-OH. It was also observed that carboxylic acid substitution reduces intermolecular hydrogen bonding resulting in a sharpening of the H-5′′ signal in cannabinolic acid in deuterated chloroform. The additional aromaticity of cannabinol causes the two angular methyl groups (H-8 and H-9) to show identical 1H-NMR shifts, which indicates that the two aromatic rings are in one plane in contrast to the other cannabinoids. For the cannabiflavonoids, the unambiguous assignments of C-3′′ and C-4′′ of cannflavin A and B were determined by HMBC spectra. Copyright © 2004 John Wiley & Sons, Ltd. Keywords: NMR assignment; cannabinoids; cannabiflavonoids; Cannabis sativa.
INTRODUCTION Cannabis preparations, derived from Cannabis sativa L., are considered to be amongst the most dangerous of illicit drugs because of their narcotic and addictive properties. Nevertheless, their promising therapeutic potential has driven researchers to consider in detail their clinical uses (Formukong et al., 1989), for example in the treatment of menstrual cramps and convulsions, inflamed tonsils, migraine and headaches (Russo, 1998), glaucoma (Helper and Frank, 1971) and asthma (Abdoud and Sanders, 1976), and in pain relief (Iversen and Chapman, 2000). The active constituents belong to a group of compounds classified as cannabinoids, including ∆9-tetrahydrocannabinol, ∆8-tetrahydrocannabinol, cannabigerol and cannabinol. In addition to these major cannabinoids, approximately 60 further cannabinoids including metabolites have been isolated so far (Mechoulam et al., 1976; Turner et al., 1981). However, the skeletons of the cannabinoids do not differ greatly one from another, and modification of the structures are limited to changes in the C5 side chain, substitution of a carboxylic acid and a hydroxyl group, or an additional cyclisation. For the easy identification of the minor cannabinoids and metabolites, complete assignments of the 1H- and 13C-NMR spectra of the * Correspondence to: R. Verpoorte, Division of Pharmacognosy, Section Metabolomics, Institute of Biology, Leiden University, PO Box 9502, 2300 RA Leiden, The Netherlands. Email:
[email protected] Contract/grant sponsor: van Leersumfonds (KNAW).
Copyright © 2004 John Wiley & Sons, Ltd. Copyright © 2004 John Wiley & Sons, Ltd.
major cannabinoids are necessary. However, most of the previous work has been performed mostly using low field NMR, which resulted in ambiguous assignments of the cannabinoids. In a continuation of our investigation on the metabolomic profiling of the constituents of C. sativa, we here report the isolation and identification, together with NMR assignment, of the major cannabinoids, including ∆9-tetrahydrocannabinol (1), tetrahydrocannabinolic acid (2), ∆8-tetrahydrocannabinol (3), cannabigerol (4), cannabinol (5), cannabidiol (6) and cannabidiolic acid (7), and of the major flavonoids, namely cannflavin B (8), and cannflavin A (9), using one- and two-dimensional NMR spectra, such as 1H- and 13C-NMR, 1H-1H-COSY, HMQC and HMBC, and mass spectrometry.
EXPERIMENTAL Spectroscopic analyses. 1H-NMR (400 MHz) and 13CNMR (100 MHz) spectra were recorded on a Bruker model AV-400 FT-NMR spectrometer (Karlsruhe, Germany) with reference to TMS as standard. EI-MS spectra were obtained using a Finnigan MAT 700 instrument (San Jose, CA, USA). Plant material. Flowers of Cannabis sativa L. (cultivar SIMM 04 and Kompolti) harvested in October 2002 were obtained from Stichting Institute for Medicinal Marijuana (SIMM; Rotterdam, The Netherlands). Plant materials were air-dried in the dark at ambient temperature for 2 weeks. Received 8 August 2003 Phytochem. Anal. 15: 345–354 (2004) Revised 10 October 2003 Accepted 10 October 2003
346
Y. H. CHOI ET AL.
Extraction and isolation. Air-dried flowers (200 g) of C. sativa (cultivar SIMM 04) were extracted with chloroform:methanol (1:1) which, on removal of solvent in vacuo, afforded the initial extract (47.0 g). A suspension of this extract in 90% methanol was partitioned with n-hexane (30.3 g), leaving a residual 90% methanol extract (15.5 g). The n-hexane extract was dissolved in ethanol and subjected to CC over HP-20 resin (213 g; Mitsubishi Chemicals, Tokyo, Japan) using a stepwise gradient of 90% ethanol, 100% ethanol, 70% ethanol in acetone and 30% ethanol in acetone. A total of 22 fractions (500 mL) were collected. Fractions showing similar TLC profiles (silica gel 60F254 layers) using CHCl3-MeOH (19:1) were pooled to afford five combined fractions. Fraction 2 was separated by CC over silica gel eluted with a gradient of chloroform:methanol from 100:1 to 10:1, and the third fraction of the 18 fractions collected was further purified over Sephadex LH20 (40 g) with dichloromethane:methanol (1:1). The first Copyright © 2004 John Wiley & Sons, Ltd.
fraction of the five fractions obtained from the Sephadex LH-20 column was purified by CC over silica gel (30 g) eluted with a gradient of n-hexane:diethyl ether from 10:1 to 1:1. From this separation, compounds 1 (36 mg), 2 (64 mg), and 4 (132 mg) were isolated. Fraction 4 from the first CC over silica gel was further purified by CC Sephadex LH-20 using methanol as eluent and afforded 30 fractions from which 5 (5.0 mg) and 6 (4.3 mg) were obtained from the 28th and 29th, respectively: cannabiflavonoids 8 (12.8 mg) and 9 (3.8 mg) were isolated from the 18th fraction by further CC over Sephadex LH-20 (30 g) using methanol as mobile phase. Cannabidiolic acid (7) had been previously isolated from the n-hexane (1.5 L × 2) extracts of fibre (100 g) of C. sativa (cultivar Kompoli; unpublished data). The n-hexane extracts were filtered over a glass filter, evaporated under reduced pressure and then subjected to centrifugal partition chromatography using a Sanki (Kyoto, Japan) model LLB-M instrument. A two-phase Phytochem. Anal. 15: 345–354 (2004)
NMR ASSIGNMENTS OF CANNABINOIDS AND CANNABIFLAVONOIDS
system composed of n-hexane:methanol:water (5:3:2) acidified with 25 mm formic acid was employed, in which the upper phase was the stationary phase and the lower phase the mobile phase. The flow rate, rotational speed and fraction size were 3.5 mL/min, 500 rpm, and 11.5 mL, respectively. ∆8-Tetrahydrocannabinol (3) was purchased from Sigma (St Louis, MO, USA).
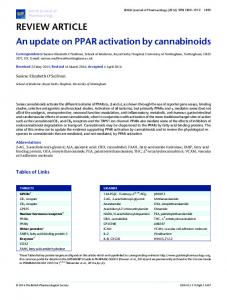
RESULTS AND DISCUSSION The EI-MS spectrum of ∆9-tetrahydrocannabinol (1) exhibited peaks due to [M]+, [M-CH3]+ and [M-C3H7]+ at m/z values of 314, 299 and 271, respectively. The 1HNMR spectrum was in accordance with that of a cannabinoid and showed signals due to two angular methyl groups [3H each, s at δ 1.41, C8-methyl (β) and δ 1.09, C9-methyl (α)], one tertiary methyl group (3H, t, J = 7.0 Hz at δ 0.87, H-5″), and three aromatic and olefinic protons (1H, q, J = 1.6 Hz, at δ 6.31, H-2; 1H, d, J = 1.6 Hz at δ 6.27, H-5′; 1H, d, J = 1.6 Hz at δ 6.14, H-3′). The H-2 signal was a quintet because it was coupled not only to the adjacent H-1 but also long-range coupled to H-4 and H-6, which was confirmed by the 1H-1H-COSY spectrum. Compound 1 from C. sativa was reported to have a trans configuration for H-1 and H-6, in contrast to the synthetic compound (Crombie et al., 1988; Evans et al., 1997; Razdan et al., 1974). The coupling constant of H-1, 10.9 Hz [Fig. 1(A)], indicated that 1 had a trans configuration for H-1 and H-6 by comparison with the J values calculated through dihedral angle and Karplus equation, which were 11.9 and 3.9 Hz for the trans and cis configurations, respectively (Karplus, 1959). The 13C-
347
NMR spectrum of the compound was compared with that previously reported (Archer and Johnson, 1977). All 1 H- and 13C-NMR assignments of 1 are shown in Table 1 and the HMBC correlations in Fig. 2. Tetrahydrocannabinolic acid (2) did not show an [M]+ peak by virtue of easy decarboxylation at C-3′. In the 1HNMR a significant difference was observed for H-2 and H-1″ compared with the spectrum of 1. The splitting pattern of H-2 was found to be a broad singlet, which was different from that for 1, in which H-2 occured as a quintet (J = 1.6 Hz). This may be because the carboxyl group changes the stereochemistry between H-2 and the adjacent protons (H-1 and H-4). While the two protons H-1″ of 1 were detected at δ 2.42, apparently as a triplet through coupling with the two H-2″, those of 2 were separate at δ 2.94 (1H, m) and 2.78 (1H, m) as shown in Fig. 1(B); the carboxylic acid group at C-3′ affected the protons differently. Moreover, the signal of 2′-OH in 1 was observed at δ 4.87 (1H, s) whilst that of 2 was at δ 12.19 (1H, s). This assignment was based on the correlation with H-2. The shift was probably occasioned by intra-molecular hydrogen bonding between the OH and the ortho-COOH. In the 13C-NMR spectrum, an upfield shift of 5.0 ppm was found for C-3′, but the other aromatic carbons, C-1′, C-2′, C-4′, C-5′, and C-6′, showed downfield shifts of 1.1, 10.0, 4.1, 2.5 and 5.6 ppm, respectively. The chemical shifts of C-1″, C-2″ and C-3″ of the side chain were also shifted downfield by 0.5–1.0 ppm when compared with those of 1. The complete 1H- and 13 C-NMR assignments are shown in Table 1 and HMBC correlations in Fig. 2. They are in accordance with a previous report (Fellemeier et al., 2001). The EI-MS spectrum of ∆8-tetrahydrocannabinol (3) was similar to that of 1 and showed peaks due to [M]+,
Figure 1. 1H-NMR spectra in the range δ 3.3–2.3 of ∆9tetrahydrocannabinol (A) and tetrahydrocannabinolic acid (B) measured in deuterochloroform. Copyright © 2004 John Wiley & Sons, Ltd.
Phytochem. Anal. 15: 345–354 (2004)
348
Copyright © 2004 John Wiley & Sons, Ltd.
Table 1. 1H- and 13C-NMR assignments for ∆9-tetrahydrocannabinol (1) ∆9-tetrahydrocannabinolic acid (2) and ∆8-tetrahydrocannabinol (3) measured in deuterochloroform ∆9-Tetrahydrocannabinol (1) Position
Phytochem. Anal. 15: 345–354 (2004)
a
H-NMRa,b
3.20 (1H, dm, 10.9 Hz) 6.31 (1H, q, 1.6 Hz) 1.68 (3H, s) 2.16 (2H, m) 1.90 (1H, m), 1.40 (m) 1.69 (m) 1.41 (3H, s) 1.09 (3H, s)
6.14 (1H, d, 1.6 Hz) 6.27 (1H, d, 1.6 Hz) 2.42 (2H, td, 7.3 Hz, 1.6 Hz) 1.55 (2H, q, 7.8 Hz) 1.29 (m)d 1.29 (m)d 0.87 (3H, t, 7.0 Hz) 4.87 (1H, s)
13
C-NMRa,c 33.6 123.7 134.3 23.4 31.2 25.0 45.8 76.7 27.6 19.3 110.8 154.7 107.5 142.8 110.1 154.2 35.5 30.6 31.5 22.5 14.0
Chemical shifts (in ppm) were determined with reference to TMS. Spectra determined at 400 MHz. Spectra determined at 100 MHz. d–g Chemical shifts bearing the same symbol overlap. b
c
1
H-NMRa,b
3.23 (1H, dm, 7.0 Hz) 6.39 (1H, brs) 1.68 (3H, s) 2.17 (2H, m) 1.92 (1H, m), 1.35 (m) 1.67 (m) 1.44 (3H, s) 1.11 (3H, s)
6.26 (1H, s) 2.94 (1H, m), 2.78 (1H, m) 1.57 (2H, m) 1.35 (m)e 1.35 (m)e 0.90 (3H, t, 6.9 Hz) 12.19 (1H, s)
∆8-Tetrahydrocannabinol (3)
13
C-NMRa,c 33.5 123.6 133.8 23.3 31.2 25.0 45.6 78.8 27.4 19.6 109.9 164.7 102.3 146.9 112.6 159.8 36.5 31.3 32.0 22.5 14.1 176.2
H-NMRa,b
1
2.70 (1H, td, 10.8 Hz, 4.8 Hz) 3.24 (2H, dd, 16.5 Hz, 3.7 Hz), 1.80 (m)f 1.70 (3H, s) 5.43 (1H, brd, 4.8 Hz) 2.13 (1H, m), 1.64 (1H, s) 1.80 (m)f 1.38 (3H, s) 1.10 (3H, s)
6.11 (1H, d, 1.6 Hz) 6.27 (1H, d, 1.5 Hz) 2.44 (2H, td, 8.3 Hz, 2.1 Hz) 1.56 (2H, q, 7.6 Hz) 1.32 (m)g 1.32 (m)g 0.88 (3H, t, 7.1 Hz) 4.82 (1H, s)
13
C-NMRa,c 31.6 36.0 134.7 23.5 119.3 27.9 44.8 76.7 27.6 18.5 110.5 154.8 107.6 142.7 110.1 154.8 35.4 30.6 31.1 22.5 14.0
Y. H. CHOI ET AL.
1 2 3 3-Me 4 5 6 7 8 9 1′ 2′ 3′ 4′ 5′ 6′ 1″ 2″ 3″ 4″ 5″ 2′-OH COOH
1
∆9-Tetrahydrocannabinolic acid (2)
NMR ASSIGNMENTS OF CANNABINOIDS AND CANNABIFLAVONOIDS
349
Figure 2. HMBC correlations in ∆9-tetrahydrocannabinol (1), tetrahydrocannabinolic acid (2), ∆8tetrahydrocannabinol (3), cannabigerol (4), cannabinol (5), cannabidiol (6) and cannabidiolic acid (7).
[M-CH3]+ and [M-C3H7]+ at m/z values of 314, 299 and 271, respectively, together with further fragments at m/z 258, 243 and 231. The intensity of each peak, however, was quite different from that of the corresponding peak in 1, for example the intensity of the fragment ion at m/z 299 was found to be 100% for 1 but only 9.3% (with respect to the base peak) for 3. This was due to the different position of the vinyl group which affects the elimination of the methyl group in MS fragmentation; possible fragmentation is shown in Fig. 3. The 1H- and 13 C-NMR spectrum of 3 indicated a cannabinoid structure similar to 1. The H-4 vinyl proton was moved upfield to δ 5.43 (dm, J = 4.84 Hz) compared with δ 6.31 (1H, tm, 1.60 Hz) for 1 because the OH group had no deshielding effect on this proton. The coupling constant of H-1 in 3 was 10.8 Hz, indicating a trans configuration Copyright © 2004 John Wiley & Sons, Ltd.
of H-1 and H-6, the same as in 1. The assignments of the 1 H- and 13C-NMR spectra of 3 were made on the basis of two-dimensional NMR spectra and are shown in Table 1 whilst the correlations in HMBC are shown in Fig. 2. The assignments of the 13C-NMR spectrum as reported by Archer and Johnson (1977) are confirmed. Cannabigerol (4) exhibited EI-MS peaks due to [M]+, [M-C6H13]+ and [M-C9H15]+ at m/z values of 316, 231 and 193, respectively. In the 1H-NMR spectrum, the four methyl peaks at δ 1.82 (3H, s, H-3′), δ 1.69 (3H, s, H-9′), δ 1.60 (3H, s, H-8′) and δ 0.90 (3H, t, J = 6.9 Hz, H-3′) confirmed that 4 possessed a cannabinoid structure. A sharp singlet at δ 6.26 (2H) was ascribed to the two identical aromatic protons (H-4 and H-6) of 4. The EI-MS spectrum of cannabinol (5) exhibited peaks due to [M]+ and [M-CH3]+ at m/z values of 310 and Phytochem. Anal. 15: 345–354 (2004)
350
Y. H. CHOI ET AL.
Figure 3. EI-MS fragmentations of ∆9-tetrahydrocannabinol (A), ∆8-tetrahydrocannabinol (B) and cannabidiol (C).
295 (base peak), respectively. In the 1H-NMR spectrum of 5, the extra aromatic moiety resulted in additional peaks due to aromatic protons at δ 8.16 (1H, s, H-2), δ 7.07 (1H, d, J = 7.9 Hz, H-4), and δ 7.14 (1H, d, J = 7.9 Hz, H-5), and a methyl attached to a benzene ring at Copyright © 2004 John Wiley & Sons, Ltd.
δ 2.38 (3H, s, C-3 methyl). The chemical shifts of the two methyls at C-7 of 1 and of 3 were different because of different orientations of those groups, however, the methyls of 5 had identical chemical shifts (δ 1.60) since the additional aromatic ring results in a flat molecule in Phytochem. Anal. 15: 345–354 (2004)
NMR ASSIGNMENTS OF CANNABINOIDS AND CANNABIFLAVONOIDS
351
Table 2. 1H- and 13C-NMR assignments for cannabigerol (4) and cannabinol (5) measured in deuterochloroform Cannabigerol (4) Position 1 2 3 4 5 6 1′ 2′ 3′ 3′-Me 4′ 5′ 6′ 7′ 8′ 9′ 1″ 2″ 3″ 4″ 5″ OH
1
H-NMRa,b
6.26 (2H, s)d — 6. (2H, s)d 3.41 (2H, d, 7.0 Hz) 5.29 (1H, m) 1.82 (3H, s) 2.09 (4H, m)e 2.09 (4H, m)e 5.07 (1H, m) 1.60 (3H, s) 1.69 (3H, s) 2.45 (2H, t, 7.5 Hz) 1.56 (2H, q, 7.8 Hz) 1.33 (4H, m) 1.33 (4H, m) 0.90 (3H, t, 6.9 Hz) 5.36 (2H, s)
13
C-NMRa,c 154.8 110.7 154.8 108.4 142.7 108.4 22.5 121.8 138.0 16.1 39.7 26.4 123.8 132.0 17.6 25.6 35.5 30.8 31.5 22.2 14.0
Cannabinol (5) Position 1 2 3 3-Me 4 5 6 7 8 9 1′ 2′ 3′ 4′ 5′ 6′ 1″ 2″ 3″ 4″ 5″ 2′-OH
1
H-NMRa,b
13
C-NMRa,c
8.16 (1H, s) 2.38 (3H, s) 7.07 (1H, d, 7.9 Hz) 7.14 (1H, d, 7.9 Hz) 1.60 (6H, s)f 1.60 (6H, s) f 6.29 (1H, d, 1.1 Hz) 6.44 (1H, d, 1.1 Hz) 2.50 (2H, t, 7.5 Hz) 1.63 (m) 1.32 (m)g 1.32 (m)g 0.89 (3H, t, 6.8 Hz) 5.13 (1H, s)
108.7 126.3 136.9 21.5 127.6 122.6 136.9 77.5 27.1 27.1 110.8 154.7 109.8 144.5 110.8 153.0 35.6 30.4 31.5 22.5 14.0
a
Chemical shifts (in ppm) were determined with reference to TMS. Spectra determined at 400 MHz. Spectra determined at 100 MHz. d–g Chemical shifts bearing the same symbol overlap. b c
which the two methyl groups have similar positions above and below the plane of the aromatic moiety. The assignments of 1H- and 13C-NMR spectra of 4 and 5 are shown in Table 2 and the HMBC correlations are depicted in Fig. 2. The EI-MS spectrum of cannabidiol (6) exhibited peaks due to [M]+ and [M-C6H11]+ at m/z values of 314 and 231 (base peak), respectively. These peaks are compatible with a cannabinoid structure (Fig. 3). In the 1HNMR spectrum of 6 measured in deuterochloroform, broad peaks were observed. These signals were not affected by the addition of deuterium oxide, which reveals that these are aromatic hydrogens rather than hydroxyl groups [Fig. 4(A)]. Previously, it was shown that the shifts of these aromatic protons are temperaturedependent and the broadening is likely to be due to restricted rotation (Mechoulam et al., 1976). This broadening hampered the assignments of the signals; for example, there were no correlations observed in the HMQC and HMBC for these signals. The problem could be solved using a protic solvent such as deuteromethanol [Fig. 4(B)]; such a solvent breaks up the inter-molecular hydrogen bonding and allows the terpenoid moiety in 5 to rotate freely resulting in sharp singlets for the aromatic protons. Further, this solvent-dependent conformation change was confirmed by the shift of the signal of H-6. This proton was at δ 2.40 in deuterochlorofom and overlapped with H-1′ but was well separated from H-1′ at δ 2.89 (1H, td, 15.1 Hz, 5.05 Hz) in deuteromethanol. The free rotation of the terpenoid group in protic solvent allowed H-6 and OH to be closer when compared with the conformations in deuterochloroform solution. A Figure 4. 1H-NMR spectra of cannabidiol (6) in deuterochloroform (A) and deuteromethanol (B), and of cannabidiolic acid (7) in deuterochloroform (C) and deuteromethanol (D). Copyright © 2004 John Wiley & Sons, Ltd.
Phytochem. Anal. 15: 345–354 (2004)
352
Copyright © 2004 John Wiley & Sons, Ltd.
Table 3. 1H- and 13C-NMR assignments for cannabidiol (6) and cannabidiolic acid (7) measured in deuterochloroform and deuteromethanol Cannabidiol (6) Position
Phytochem. Anal. 15: 345–354 (2004)
10 1′ 2′ 3′ 4′ 5′ 6′ 1″ 2″ 3″ 4″ 5″ 2′-OH 6′-OH COOH a
H-NMRa,b in CDCl3
1
H-NMRa,b in CD3OD
3.90 (1H, dm, 11.8 Hz) 5.57 (1H, s)
3.93 (1H, dm, 11.1 Hz) 5.28 (1H, s)
2.21 (1H, m), 2.09 (1H, m) 1.84 (m) 2.40 (m) 1.79 (3H, s)
2.18 (1H, m), 1.99 (1H, m) 1.74 (2H, m) 2.89 (1H, td, 15.1 Hz, 5.05 Hz) 1.67 (3H, s) — 4.46 (trans, 1H, m), 4.42 (cis, 1H, m) 1.63 (3H, s) — — 6.07 (2H, s)e — 6.07 (2H, s)e — 2.37 (2H, t, 7.46 Hz) 1.53 (2H, q, 7.34 Hz) 1.29 (4H, m)f 1.29 (4H, m)f 0.89 (3H, t, 7.13 Hz)
4.64 (trans, 1H, m), 4.54 (cis, 1H, m) 1.66 (3H, s)
6.26 (1H, brs) 6.16 (1H, brs) 2.43 (2H, t, 7.5 Hz) 1.55 (2H, q, 7.6 Hz) 1.29 (m)d 1.29 (m)d 0.88 (3H, t, 6.8 Hz) 5.99 (1H, s) 5.02 (1H, s)
Chemical shifts (in ppm) were determined with reference to TMS. Spectra determined at 400 MHz. c Spectra determined at 100 MHz. d–k Chemical shifts bearing the same symbol overlap. b
13
C-NMRa,c in CD3OD 37.5 127.3 134.2 30.7 31.7 46.4 23.7 150.3g 110.5 19.5 115.9 157.5 108.3h 142.7 108.3h 150.3g 36.6 32.0 32.6 23.6 14.4
1
H-NMRa,b in CDCl3
1
H-NMRa,b in CD3OD
4.09 (1H, m) 5.56 (1H, s)
3.97 (1H, dm, 8.9 Hz) 5.28 (1H, s)
2.20 (1H, m), 2.10 (1H, m) 1.86 (m) 2.40 (1H, m) 1.80 (3H, s)
2.18 (1H, m), 1.98 (1H, m) 1.79 (2H, m) 3.02 (1H, m) 1.65 (3H, s)
4.55 (trans, 1H, m), 4.40 (cis, 1H, m) 1.72 (3H, s)
4.45 (trans, 1H, m), 4.42 (cis, 1H, m) 1.62 (3H, s)
6.26 (1H, s)
6.13 (1H, s)
2.92 (1H, m), 2.82 (1H, m) 1.57 (2H, m) 1.33 (4H, m)i 1.33 (4H, m)i 0.89 (3H, t, 6.9 Hz) 11.93 (1H, s) 6.63 (1H, s)
2.81 (2H, t, 7.5 Hz) 1.57 (2H, m) 1.31 (4H, m)i 1.31 (4H, m)i 0.89 (3H, t, 7.2 Hz)
13
C-NMRa,c in CD3OD 37.3 126.9 133.0 31.7 30.8 45.7 23.6 150.4k 110.5 19.3 116.5 161.8 104.2 147.0 111.3 150.4k 37.6 32.8 33.2 23.5 14.4
175.6
Y. H. CHOI ET AL.
1 2 3 4 5 6 7 8 9
1
Cannabidiolic acid (7)
NMR ASSIGNMENTS OF CANNABINOIDS AND CANNABIFLAVONOIDS
353
Table 4. 1H- and 13C-NMR assignments for cannflavin B (6) and cannflavin A (7) measured in deuteroacetone Cannflavin B (6) Position 2 3 4 5 6 7 8 9 10 1′ 2′ 3′ 4′ 5′ 6′ 1″ 2″ 3″ 4″ 5″ 6″ 7″ 8″ 9″ 10″ OMe 5-OH a b c
1
H-NMRa,b
— 6.68 (1H, s) — — — — 6.63 (1H, s) — — — 7.60 (1H, d, 1.88 Hz) — — 7.00 (1H, d, 8.28 Hz) 7.58 (1H, dd, 8.24 Hz, 1.90 Hz) 3.36 (2H, d, 7.12 Hz) 5.29 (1H, tt, 7.24 Hz, 1.52 Hz) — 1.80 (3H, s) 1.65 (3H, s) — — — — — 3.99 (3H, s) 13.30 (1H, s)
Cannflavin A (7) 13
C-NMRa,c 164.7 104.4 183.1 162.5 112.3 160.1 94.2 156.6 105.1 123.7 110.4 148.8 151.3 116.3 121.2 22.0 123.2 131.6 25.8 17.9 — — — — — 56.7 —
1
H-NMRa,b
— 6.69 (1H, s) — — — — 6.63 (1H, s) — — — 7.61 (1H, d, 1.88 Hz) — — 7.02 (1H, d, 8.28 Hz) 7.58 (1H, dd, 8.24 Hz, 1.90 Hz) 3.36 (2H, d, 7.20 Hz) 5.28 (1H, tt, 7.24 Hz, 1.52 Hz) — 1.93 (2H, t, 10.0 Hz) 2.03 (2H, t, 7.21 Hz) 5.04 (1H, t, 7.08 Hz) — 1.54 (3H, s) 1.78 (3H, s) 1.65 (3H, s) 3.99 (3H, s) 13.3 (1H, s)
13
C-NMRa,c 164.7 104.4 183.1 162.4 112.4 160.2 94.1 156.6 105.2 123.7 110.5 148.8 151.3 116.3 121.2 22.0 123.2 131.6 40.5 27.4 125.2 131.6 16.3 25.8 17.7 56.6 —
Chemical shifts (in ppm) were determined with reference to TMS. Spectra determined at 400 MHz. Spectra determined at 100 MHz.
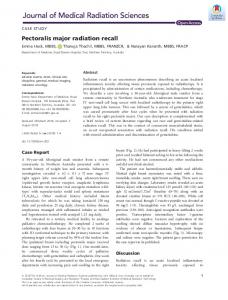
large coupling constant of H-6 (15.1 Hz) also indicated that it had a trans conformation. The 1H- and 13CNMR assignments deduced from two-dimensional NMR spectra such as 1H-1H-COSY, HMQC, and HMBC are shown in Table 3 and HMBC correlations are shown in Fig. 2. In contrast to the above, the broad signals in the 1HNMR measured in deuterochloroform were not detected in cannabidiolic acid (7) because of intra-hydrogen bonding between the carboxylic acid at C-3′ and the hydroxyl group at C-2′, which permits the terpenoid moiety to rotate freely [Fig. 4(C)]. The two protons at C-1″, similar to those in 2, were affected differently by the carboxylic acid at C-3′ and were observed at δ 2.20 (1H, m) and 2.10 (1H, m), respectively. The hydroxyl group at C-2′ was shifted to δ 11.9 by the hydrogen bonding of the hydroxyl and the carboxyl acid groups. In the 13CNMR spectrum of 7, the signals of C-1′, C-2′, C-4′, C-5′ and C-6′ showed downfield shifts of 0.5–5 ppm. The 1Hand 13C-NMR assignments are shown in Table 3 and the HMBC correlations in Fig. 2. In addition to cannabinoids, prenylated flavonoids having a prenyl group on C-6, for example cannflavin B and A (8 and 9, respectively), have been reported as constituents of C. sativa (Barrett et al., 1986). The 1H-NMR spectrum confirmed that 8 was a methoxyflavonoid showing signals due to five aromatic protons at δ 7.60 (1H, d, 1.9 Hz, H-2′), δ 7.58 (1H, dd, 8.2 Hz, 1.9 Hz, H-6′), δ 7.00 (1H, d, 8.2 Hz, H-5′), δ 6.85 (1H, s, H-3), Copyright © 2004 John Wiley & Sons, Ltd.
δ 6.63 (1H, s, H-8) and methoxy peaks at δ 3.99 (3H, s). The additional prenyl peaks, including δ 3.36 (2H, d, 7.12 Hz, H-1″), δ 5.29 (1H, tt, 7.24 Hz, 1.52 Hz, H-2″), δ 1.80 (3H, s, H-4′) and δ 1.65 (3H, s, H-5′), indicated that this compound has a prenyl moiety, the position of which was confirmed to be C-6 by HMBC. The position of the methoxy group could be assigned to be C-3′ from the NOESY spectrum in which H-2′ correlated with the methoxy group. The assignments of C-3′ and C-4′ were obtained using HMQC and HMBC data: H-6′ was not correlated with C-3′ but with C-4′ in the HMBC spectrum (Fig. 5). The assignment given here is different from that previously reported (Agrawal, 1989). The 1H-NMR spectrum of cannflavin A (9) showed additional signals, including δ 1.93 (2H, t, 10.0 Hz, H-4″), δ 2.03 (2H, t, 7.21 Hz, H-5″), δ 5.04 (1H, t, 7.08 Hz, H-6″) and δ 1.54 (3H, s, H-8″) when compared to those of 8. The 1H- and 13C-NMR assignments of the flavonoids are shown in Table 4. Acknowledgements The Post-doctoral Fellowship Program of Korea Science and Engineering Foundation (KOSEF) is gratefully acknowledged for the support of Y. H. Choi. The authors also thank Professor J. De Graeve and Mr. J.-C. van Heugen at the University of Liège, Liège, Belgium for the measurements of ESI-MS spectra. Financial support of the van Leersumfonds (KNAW) is gratefully acknowledged. Phytochem. Anal. 15: 345–354 (2004)
354
Y. H. CHOI ET AL.
Figure 5. HMBC spectrum of cannflavin B (8) in deuteroacetone.
REFERENCES
Abdoud RT, Sanders HD. 1976. Effect of oral administration of ∆9-THC on airways mechanics in normal and asthmatic subjects. Chest 70: 480–485. Agrawal PK. 1989. Carbon 13-NMR of Flavonoids. Elsevier: Amsterdam; 136. Archer RA, Johnson DW. 1977. Carbon-13 nuclear magnetic resonance spectroscopy of naturally occurring substances. 47. Cannabinoid compounds. J Org Chem 42: 490–495. Barrett ML, Scutt AM, Evans FJ. 1986. Cannflavin A and B, prenylated flavones from Cannabis sativa L. Experientia 42: 452–453. Crombie L, Crombie WM, Jamieson SV, Palmer CJ. 1988. Acid-catalysed terpenylations of olivetol in the synthesis of cannabinoids. J Chem Soc Perkin Trans I 1243–1250. Evans DA, Shaughnessy EA, Barnes DM. 1997. Cationic bis(oxazoline)Cu(II) Lewis acid catalysts. Application to the asymmetric synthesis of ent-∆1-tetrahydrocannabinol. Tetrahedron Lett 38: 3193–3194. Fellermeier M, Eisenreich W, Bacher A, Zenk MH.2001. Biosynthesis of cannabinoids. Eur J Biochem 268: 1596– 1604.
Copyright © 2004 John Wiley & Sons, Ltd.
Formukong EA, Evans AT, Evans FJ. 1989. The medical uses of cannabis and its constituents. Phytother Res 3: 219– 235. Helper RS, Frank IM. 1971. Marijuana smoking and intraocular pressure. JAMA 217: 1392. Iversen L, Chapman V. 2002. Cannabinoids: a real prospect for pain relief. Curr Opin Pharmac 2: 50–55. Karplus M. 1959. Contact electron-spin coupling of nuclear magnetic moments. J Chem Phys 30: 11–15. Mechoulam R, McCallum K, Burstein S. 1976. Recent advances in the chemistry and biochemistry of cannabis. Chem Rev 76: 75–112. Razdan RK, Dalzell HC, Handrick GR. 1974. Hashish. A simple one-step synthesis of (−)-D1-tetrahydrocannabinol (THC) from p-mentha-2,8-dien-1-ol and olivetol. J Am Chem Soc 96: 5860–5865. Russo E. 1998. Cannabis for migraine treatment: the once and future prescription? An historical and scientific review. Pain 76: 3–8. Turner CE, Elsohly MA, Boeren G. 1980. Constituents of Cannabis sativa L. XVII. A review of the natural constituents. J Nat Prod 43: 169–234.
Phytochem. Anal. 15: 345–354 (2004)