School of Computer Science, University of Windsor, Windsor, Ontario, Canada. {li11112c, angom}@uwindsor.ca. AbstractâNon-negative information can ...
2010 IEEE International Conference on Bioinformatics and Biomedicine
Non-negative Matrix and Tensor Factorization Based Classification of Clinical Microarray Gene Expression Data Yifeng Li, Alioune Ngom School of Computer Science, University of Windsor, Windsor, Ontario, Canada {li11112c, angom}@uwindsor.ca
these problems, among many other problems, substantially affect the effectiveness and efficiency of analysis algorithms devised for GST data. For sample classification, it is necessary to reduce the dimension of the data in order to avoid the problems arising from the curse of dimensionality. Linear dimensionality reduction (LDR) is a widely used linear algebraic technique mainly including Linear dimension analysis (LDA), principal component analysis (PCA), singular value decomposition (SVD), independent component analysis (ICA) and non-negative matrix factorization (NMF). NMF has attractions of simple implementation, good interpretation, sparsity, and using non-negative information, for its applications in microarray data analysis. The gene expression intensities and ratios are naturally non-negative. NMF becomes popular after [4]. Given a gene-sample dataset 𝑿 with 𝑚 genes and 𝑛 samples. Matrix 𝑿 can be factorized into two nonnegative factors, as follows
Abstract—Non-negative information can benefit the analysis of microarray data. This paper investigates the classification performance of non-negative matrix factorization (NMF) over gene-sample data. We also extends it to higher-order version for classification of clinical time-series data represented by tensor. Experiments show that NMF and the higher-order NMF can achieve at least comparable prediction performance. Keywords-tensor decomposition; NMF; HONMF; GST data
I. I NTRODUCTION DNA microarray technique can monitor thousands of genes in parallel, dramatically accelerate molecular biology experiments and provide a huge amount of data to find coregulated genes, functions of genes, genetic networks, for instance. There are two types of microarray data: genesample data sets, which compile the expression levels of various genes over a set of biological samples; and genetime data sets, which record the expression levels of various genes over a series of time-points. Both types of data are represented by a two-dimensional (2D) gene expression matrix. However, noise, curse of dimensionality, and other problems substantially affect the performance of analysis algorithms devised for microarray data. Within the last few years in medical research, the expression levels of genes with respect to biological samples have been monitored synchronically over a series of timepoints [1]. This corresponds to a three-dimensional (3D) data set, termed gene-sample-time (GST) microarray data [2]; which can be viewed as a collection of gene-sample data over a series of time-points, or a collection of gene-time data across some samples. GST data can be used to develop models for diagnosing diseases much more precisely than with static microarray data, or to monitor dose or drug treatment responses of patients over time in pharmacogenomics studies [3], or to determine genes or samples patterns, or to find regulatory pathways [2]. There are many problems associated with the analysis of GST data, such as missing values, noise, small number of sample and time points. Furthermore, unlike in two-dimensional microarrays, a gene or sample in a GST array is a matrix rather than a vector, and therefore GST require special methods for its analysis. Computational analysis of GST data are therefore much more difficult than their two-dimensional counterparts. All
978-1-4244-8305-1/10/$26.00 ©2010 IEEE
𝑿 𝑚×𝑛 ≈ 𝑨𝑚×𝑟 𝒀 𝑟×𝑛
𝑿, 𝑨, 𝒀 ≥ 0,
(1)
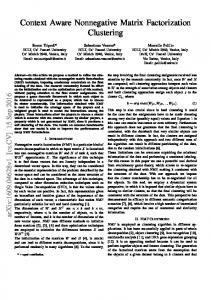
where 𝑟 ≤ min(𝑚, 𝑛), 𝐴 and 𝑌 are the basis matrix and the coefficient matrix, respectively. Multiplicative update rules [5] are widely used algorithms and are simple to implement. Other algorithms, for example alternating least squares (ALS), are reviewed in [5]. In multilinear algebra, a tensor of order 𝑑 [6] is a 𝑑dimensional array, and tensor algebra is the extension of vector and matrix algebra to order 𝑑 tensors. Since a GST microarray data is naturally an order 3 tensor (see Fig. 1), therefore, known theories from tensor algebra can be used to analyze such data rather than performing matrix operations on a matricized representation of the GST data. Tensor decomposition is an extension of matrix factorization to tensor data and attempt to find a smaller representation describing the initial tensor data. Matrix factorizations, such as SVD, ICA, and NMF, have been extended to higherorder SVD (HOSVD) [7], multilinear ICA (MICA) [8], and higher-order NMF (HONMF) [9], respectively, for tensor data. Tensor decomposition is investigated in the context of sample classification. Since the original GST data are nonnegative, our approach is to perform unsupervised HONMF based multilinear dimension reduction (MLDR) method in order to extract a small sets of discriminative and non-
438
differ in how the core basis tensors are obtained (i.e., either from each class separately, or from the whole data) and in how the class of a test sample is predicted (i.e, either by regression or by projection). [8] generalized ICA to MICA, and use it for extracting features to be used in face recognition. [21] also applied MICA decomposition to classify integrated tumor gene expression data from different studies. Their working order-3 tensor is a combination of three genesample tumors datasets. Two core basis tensors are obtained via MICA decomposition, separately over training samples and test samples. A SVM classifier is then trained on the matricized version of the core tensor obtained from the training sample and validated using the core tensor generated from the test data.
�������� �������� �������� �������� ������ ������ ������ ������ � � � � �
Figure 1.
An Example of a GST Dataset.
negative features, and then perform sample classification in the reduced space. As far as we know, this paper is the first attempt at using tensor methods for classifying GST data, (see the next section for their applications on other types of microarray data). In this paper, the performance of three NMF based classification methods are investigated over gene-sample microarray data. We also devise a HONMF method for the analysis of GST data.
III. M ETHODS A. Notation Hereafter, we use the following notations unless otherwise noted. A matrix is denoted by a bold capital letter, e.g. 𝑨. A (column) vector is denoted by a bold lowercase letter, e.g. 𝒂. A bold lowercase letter with a subscript 𝒂𝑖 denotes the 𝑖-th column vector in matrix 𝑨. The italic lowercase letter with two subscripts 𝑎𝑖𝑗 is the (𝑖, 𝑗)-th scalar element of matrix 𝑨. A boldface Euler script, e.g. 𝓧, denotes an order 3 tensor. That is 𝓧 ∈ ℝ𝐼×𝐽×𝐾 . 𝑿 (1)𝑝 denotes the 𝑝-th frontal slice of 𝓧, of size 𝐼 ×𝐽. 𝑿 (1) denotes the matrix of size 𝐼 ×𝐽𝐾, unfolded in mode 1 of 𝓧. The (𝑖, 𝑗, 𝑘)-th scalar element of 𝓧 is denoted by 𝑥𝑖𝑗𝑘 .
II. R ELATED W ORKS NMF has been used to cluster samples or genes [10] [11]. It has also been used in classification problems such as, musical instrument classification [5], face recognition [5], and microarray data classification. [12] used correlation coefficient to decide which class the extracted features (by ICA and NMF) characterize. [13] proposed discriminative mix models to classify non-negative microarray gene expression data. The samples reduced by a sparse NMF are the input of the mix models. [14] used NMF or a sparse NMF to extract features, and employed SVM classifier in the feature space. [15] proposed a ranking method based on a sparse NMF in order to improve the prediction accuracy. [1] proposed an integrated Bayesian inference system (IBIS) to select triplets of genes for classifying INF𝛽 samples (a GST microarray data) but using only the first time point, and thus did not benefit from (nor consider) the full GST data. [3] used support vector machines based on dynamical systems kernels to classify INF𝛽 samples. A kernel is define such that the similarity between two sample matrices can be computed. [16] devised generative hidden markov models (GenHMMs) and discriminative HMMs (DiscHMMs) approaches for classifying INF𝛽 samples. [17] proposed a robust constrained mixture estimation approach to classify the INF𝛽 data. [18] applied HOSVD on an order 5 tensor data for face recognition. [19] used HOSVD to analyze the integration of DNA microarray data from different studies. [20] devised two different approaches based on HOSVD decomposition to classify a dataset of handwritten digits represented as a tensor data of order 3. HOSVD is used to extract small feature sets that explained the original data but the methods
B. NMF based Feature Extraction Features must not been extracted from the overall data 𝑋, because it would result in overfitting problem. There must be two steps – training on training set to generate new features and feature space, and testing on test set to project the test samples from the original space into the feature space. Given a 2-dimensional gene-sample dataset 𝑿 of size 𝑚 × 𝑛, with samples in columns, it should be split into independent training set 𝑿 train 𝑚×𝑝 with 𝑝 samples and with 𝑛 − 𝑝 samples. First, the training test set 𝑿 test 𝑚×(𝑛−𝑝) set 𝑋 train is decomposed as follows: train train 𝑿 train 𝑚×𝑝 ≈ 𝑨𝑚×𝑟 𝒀 𝑟×𝑝 ,
𝑿 train , 𝑨train , 𝒀 train ≥ 0,
(2)
where 𝑟 ≤ min(𝑚, 𝑝). Multiplicative update rule based algorithm in [10] is employed in this paper. The reason why NMF can be used in feature extraction is that a sample 𝒙𝑖 can be approximately represented by a linear combination of the columns of 𝑨train with coefficients in the 𝑖th row of 𝒀 train . 𝑨train is basis matrix and will be used in the test step. Each column of 𝑨train is the extracted features, called metagene [10]. All the metagenes span the feature space, called NMF space. 𝒀 train is coefficients matrix. Its column 𝒚 𝑖 is the representation of 𝑖−th sample in the NMF space.
439
∑𝐼𝑛 as 𝓧 ×𝑛 𝑨, is: 𝓧 ×𝑛 𝑨 = 𝑖𝑛 =1 𝑥𝑖1 𝑖2 ⋅⋅⋅𝑖𝑁 𝑎𝑗𝑖𝑛 , where 𝓧 ∈ ℝ𝐼1 ×𝐼2 ×⋅⋅⋅×𝐼𝑁 and 𝑨 ∈ ℝ𝐽×𝐼𝑛 . This results in a tensor 𝓨 ∈ ℝ𝐼1 ×⋅⋅⋅𝐼𝑛−1 ×𝐽×𝐼𝑛+1 ⋅⋅⋅×𝐼𝑁 . 𝓧 can be matricized into matrices in different modes. For example, 𝑿 (1) = [𝑿 (1)1 , 𝑿 (1)2 , ⋅ ⋅ ⋅ , 𝑿 (1)𝐾 ] is matricized in the first mode. Tensor decomposition mainly includes PARAFAC and Tucker decompositions [6]. HONMF is a tucker3 decomposition with non-negativity constraints. HONMF factorizes a tensor 𝓧 into a non-negative core tensor 𝓒 and 3 nonnegative mode matrices (factors) 𝑮, 𝑻 , and 𝑺. as follows:
After that, the test samples should be projected into the NMF space to obtain these presentations in this space, as follows: train test test , 𝑨train , 𝒀 test ≥ 0 (3) 𝑿 test 𝑚×(𝑛−𝑝) ≈ 𝑨𝑚×𝑟 𝒀 𝑟×(𝑛−𝑝) , 𝑿
It should be noted that this is a non-negativity constrained least squares (NLS) problem. Three projection algorithms are introduced, as follows, to solve this problem. We can use a multiplicative updating based projection method [5]. In this method, 𝒀 test is iteratively updated by the multiplicative update rule while keeping 𝑨train intact. The second projection method is pseudo-inverse based method [15]. The test samples is projected by a transformation matrix 𝑨, as follows: 𝒀 test = 𝑨train † 𝑿 test , However, the drawback of this method is that the non-negative constraint of 𝒀 test is violated. The improved version of this method is to enforce the negative values in 𝑌 test to zeros, while holding the nonnegative values [5]. This method is simple and fast, but has large fitting error. The third projection method is to use an active set method to solve Eq.(3) [22]. After the dimension of the samples is reduced and discriminative information is captured, the last step is to learn and test in the NMF space. 𝒀 train is used to train a classifier, and 𝒀 test is used to test the prediction performance. In this paper, due to efficiency, simplicity, and availability for multiclass problems, 𝑘-NN is employed to classify samples in NMF space. With respect to different projection methods in the test stage, we have three unsupervised feature extraction and classification approaches, named uNMFmu, uNMFpi, uNMFnls, respectively. NMF can also be used to select discriminative genes while filtering out redundant genes. [15] proposes a gene ranking method as follows. Elements of 𝐴train less than a fixed threshold are set to 1, and the number of ones in each row is the score of the corresponding gene. Genes are then sorted in decreasing order and the top 𝑡 genes are selected. In order to investigate the biological pathways, [11] also proposes a gene ranking method in which a gene is scored as follows 𝑟 ∑ 1 𝑝(𝑖, 𝑗) log2 𝑝(𝑖, 𝑗), (4) 𝐺𝑒𝑛𝑒 𝑠𝑐𝑜𝑟𝑒(𝑖) = 1 + log2 (𝑟) 𝑗=1
𝓧 ≈ 𝓒 ×1 𝑮 ×2 𝑻 ×3 𝑺
𝒳, 𝒞, 𝑮, 𝑻 , 𝑺 ≥ 0.
(5)
Algorithm based on multiplicative update rules can converge to local optimum [9]. Next, we describe our unsupervised dimension reduction approaches based on HONMF. Let 𝓧 be a training set, from a GST dataset, with 𝐼 genes, 𝐽 time points, and 𝐾 samples. Through Eq.(5), we can obtain 𝓧 ≈ 𝓑×3 𝑺, where 𝓑 = 𝓒 ×1 𝑮 ×2 𝑻 is a non-negative tensor. Making use of multilinear operations, we have 𝑿 (1) ≈ 𝑰 𝐺 𝑩 (1) (𝑆 ⊗ 𝑰 𝑇 )𝑇 ⎡ 𝒔11 𝑰 𝑇 ⎢ = [𝑩 1 , 𝑩 2 , ⋅ ⋅ ⋅ , 𝑩 𝑅 ] ⎣ ...
⋅⋅⋅ .. .
⎤ 𝒔𝑘1 𝑰 𝑇 .. ⎥ , . ⎦
𝒔1𝑅 𝑰 𝑇
⋅⋅⋅
𝒔𝑘𝑅 𝑰 𝑇
(6)
where 𝑰 𝐺 and 𝑰 𝑇 are identity matrices of sizes 𝐼 × 𝐼 and 𝐽 × 𝐽, respectively. Thus the 𝑘-th frontal slice of 𝓧, that is, the 𝑘-th sample, can be fitted by the additive summation of the frontal slices of 𝓑: 𝑅 ∑ 𝑩 𝑟 𝒔𝑘𝑟 , (7) 𝑿 (1)𝑘 ≈ 𝑖=1
where the coefficients are in the 𝑘-th row of 𝑺. Thus, 𝓑 is the basis matrix for the samples and 𝑺 is the encoding matrix. We can define the matrix space spanned by 𝓑 as the HONMF feature space, and 𝒔𝑘 as the non-negative representation of the 𝑘-th sample in the feature space. These non-negative matrix slices of 𝓑 are the HONMF features. This reduces the original sample slice to a vector 𝒔𝑘 in the feature space. In the test phase, each test sample 𝒀 𝑙 is projected into the HONMF feature space. 𝒀 𝑙 should also be an additive linear combination of the basis matrices in 𝓑: 𝑅 ∑ 𝑩 𝑟 𝛼𝑟 , (8) 𝒀𝑙=
where 𝑝(𝑖, 𝑞) = ∑𝑟𝐴 𝑨[𝑖,𝑞] train [𝑖,𝑗] . The classification perfor𝑗=1 mance of this measure is still not clear. For simplicity, we call the first criterion ZH , and the second IE. In both of the criteria, 𝑨train is generated by a sparse NMF [11]. train
𝑟=1
C. HONMF for Feature Extraction
where 𝓑 is obtained in the training step and 𝜶 = [𝛼1 , 𝛼2 , ⋅ ⋅ ⋅ , 𝛼𝑅 ]𝑇 is the representation of 𝒀 𝑙 in the feature space. Finding 𝛼 is equivalent to solve the following generalized least squares problem:
We extended the above NMF based approach into higherorder version for GST data. Prior to describing our HONMF based approach, it is necessary to introduce some multilinear algebraic operations. 𝑨 ⊗ 𝑩 denotes the Kronecker tensor product [6] of matrices 𝑨 and 𝑩. The mode 𝑛 product of a tensor 𝓧 and a matrix 𝑨, written
min ∥𝒀 𝑙 − 𝜶
440
𝑅 ∑ 𝑟=1
𝑩 𝑟 𝛼𝑟 ∥2𝐹 ,
𝜶 ≥ 0,
(9)
where ∥ ∙ ∥𝐹 is Frobenius norm of a matrix. The general [20], where solution to this problem is 𝛼𝑟 = < ∙, ∙ > is the inner product of two matrices. For different test samples, we put 𝜶’s in the corresponding rows of a non-negative coefficient matrix 𝑨. Alternatively, given the test samples 𝓨, we can fix 𝓒, 𝑮, and 𝑻 to calculate the coefficient matrix 𝑨 of 𝓨. We need to find 𝑨 that satisfies 𝓨 ≈ 𝓒 ×1 𝑮 ×2 𝑻 ×3 𝑨.
applied in this part. PCA is used as a benchmark method. The Euclidean distance based 3-NN is used. 7-fold crossvalidation (CV) is employed to partition a dataset into training sets and test sets. The optimal number of metagenes 𝑟 is searched through line search according to the classification performance. The mean performances of 20 runs are shown in Table II. Specificity, sensitivity, and accuracy are defined 𝑁 𝑇𝑃 𝑇 𝑁 +𝑇 𝑃 by 𝑇 𝑁𝑇+𝐹 𝑃 , 𝑇 𝑃 +𝐹 𝑁 , and 𝑇 𝑁 +𝑇 𝑃 +𝐹 𝑁 +𝐹 𝑃 , respectively, where 𝑇 𝑁 , 𝑇 𝑃 , 𝐹 𝑁 , 𝐹 𝑃 are the numbers of true negative, true positive, false negative, and false positive samples, respectively. It can be seen that the NMF based approaches obtains better accuracies in general. Also, the NMF based approaches tend to extract a small number of features.
(10)
Higher-order orthogonal iterations (HOOI) is an ALS tucker3 decomposition algorithm which restricts orthogonality on factors [6]. For HOSVD and HOOI, the mode matrices are orthogonal and 𝑨 is the 𝑅 leading left singular vectors of 𝒁 (3) . 𝒁 (3) is matricized from 𝓩 which is calculated by the following equation: 𝓩 = 𝓨 ×1 𝑮 𝑇 ×2 𝑻 𝑇 .
Table I G ENE -S AMPLE DATASETS Dataset Binary-class Leukemia [10] Medulloblastoma [10] Colon [23] Multi-class Leukemia [10] SRBCT [24]
(11)
But, for HONMF, the constraint on the mode matrices is non-negativity rather than orthogonality. Instead of deriving an equation similar to Eq.(11), we can just update 𝑨 iteratively using its multiplicative update rule in [9], while keeping 𝓒, 𝑮, and 𝑻 constant. These feature extraction methods are termed MLDR, extended from LDR in linear algebra. Once 𝑨 is obtained, There is no need to learn on the training samples and classify the matrix-presented test samples. Instead, any classifier can be trained on 𝑺 and classify the rows of 𝑨. The same scheme is also implemented using HOSVD and HOOI on the purpose of comparison. With respect to different projection methods in the test phase, these tensor based classification methods are denoted by uHONMFgls, uHOSVDgls, uHOOIgls, and uHONMFmu, uHOSVDtf, uHOOItf. The unsupervised MLDR techniques above can be modified in a supervised manner. Let 𝑚 be the number of classes in the data. The idea is to first partition the training set into 𝑚 subsets 𝓧1 , ⋅ ⋅ ⋅ , 𝓧𝑚 , where each subset 𝓧𝑖 contains only samples of class 𝑖. Next, 𝑚 core tensors 𝓑1 , ⋅ ⋅ ⋅ , 𝓑𝑚 are obtained.The resulting basis matrices are then normalized using the Frobenius norm. A normalized test sample can be fitted by these basis tensors, respectively, through Eq.(9). This sample is assigned to the class where the minimal fitting residual is obtained. For simplicity, we denote the supervised version of HONMF, HOSVD, and HOOI based classification methods by sHONMF, sHOSVD, and sHOOI. This supervised decomposition approach is described in [20] for hand written recognition using HOSVD.
#Classes 2 2 2 3 4
#Genes 5000 5893 2000 5000 2308
#Samples 27+11=38 39+21=60 40+22=62 19+8+11=38 23+8+12+20=63
Table II P ERFORMANCE OF VARIOUS NMF S AND PCA. Methods Optimal 𝑟SpecificitySensitivityAccuracy uNMFmu 3 0.993 0.925 0.977 Binary Class uNMFpi 2 0.980 0.907 0.959 uNMFnls 2 0.980 0.907 0.959 Leukemia PCA 4 0.989 0.879 0.957 uNMFmu 6 0.933 0.793 0.895 uNMFpi 6 0.912 0.661 0.839 Medulloblastoma uNMFnls 6 0.910 0.668 0.839 PCA 5 0.985 0.418 0.837 uNMFmu 5 0.788 0.897 0.858 uNMFpi 6 0.814 0.917 0.881 Colon uNMFnls 6 0.810 0.909 0.874 PCA 10 0.706 0.950 0.863 uNMFmu 3 0.973 Multi-class uNMFpi 3 0.950 uNMFnls 3 0.953 Leukemia PCA 4 0.935 uNMFmu 6 0.954 uNMFpi 12 0.942 SRBCT uNMFnls 10 0.942 PCA 19 0.958 Data
We also compared the performance of the gene selection criterion IE with ZH. The classification performance is shown in Table III. Here, IE (or ZH) indicates gene selection criterion IE (or ZH) is used and then 3-NN classification is performed. IE+NMF (or ZH+NMF) means gene selection criterion IE (or ZH) is employed prior to uNMFmu. We can find that, in general, gene selection criterion IE is much effective than ZH. With hundreds of selected genes by criterion IE, the accuracies do not decrease dramatically on some datasets, while the accuracies are increased on some datasets, comparing to these in Table II.
IV. E XPERIMENTS A. Experiment of NMF We test the performance of the NMF based methods over three binary-class and two multi-class gene-sample datasets as summarized in Table I. Gene selection is not
441
Table III C OMPARISON OF T WO NMF BASED G ENE S ELECTION M ETHODS Data
Methods
100 ZH 0.780 Binary Class ZH+NMF0.718 IE 0.912 Leukemia IE+NMF 0.925 ZH 0.547 MedulloZH+NMF0.604 IE 0.668 blastoma IE+NMF 0.673 ZH 0.799 ZH+NMF0.831 Colon IE 0.827 IE+NMF 0.832 ZH 0.501 Multi-class ZH+NMF0.468 IE 0.907 Leukemia IE+NMF 0.921 ZH 0.968 ZH+NMF0.951 SRBCT IE 0.982 IE+NMF 0.980
Number of Selected 200 300 400 0.775 0.771 0.786 0.746 0.745 0.732 0.929 0.930 0.939 0.939 0.939 0.956 0.562 0.583 0.634 0.554 0.598 0.591 0.692 0.691 0.691 0.713 0.722 0.702 0.791 0.797 0.803 0.821 0.834 0.836 0.848 0.857 0.875 0.851 0.860 0.870 0.579 0.585 0.589 0.483 0.486 0.455 0.927 0.942 0.943 0.925 0.912 0.951 0.976 0.980 0.979 0.972 0.976 0.975 0.979 0.977 0.977 0.980 0.978 0.974
Genes 500 0.782 0.765 0.949 0.975 0.668 0.585 0.704 0.716 0.811 0.844 0.868 0.874 0.600 0.447 0.956 0.959 0.980 0.977 0.982 0.977
means gene selection is not used. The parameter of the tensor decomposition based approaches is rank-(𝑃, 𝑄, 𝑅) and grid search is performed to find the values that give the best prediction accuracy.
600 0.767 0.793 0.939 0.961 0.678 0.612 0.719 0.743 0.826 0.854 0.864 0.870 0.627 0.450 0.933 0.968 0.979 0.977 0.981 0.971
Table IV ACCURACY ON C OMPLETE INF-B ETA DATA Methods Param. GenHMMs DiscHMMs GenHMMs 7 DiscHMMs 7 uHOSVDgls 7,3,3 uHOOIgls 4,3,10 uHONMFgls 3,5,3 uHOSVDtf 4,2,3 uHOOItf 3,7,3 uHONMFmu 3,5,3 sHOSVD 4,3,8 sHOOI 3,4,4 sHONMF 3,4,6
Specificity 0.861±0.036 0.861±0.036 0.861±0.063 0.861±0.063 0.839±0.039 0.900±0.031 0.897±0.079 0.764±0.053 0.811±0.048 0.789±0.029 0.831±0.054 0.761±0.045 0.958±0.110
Sensitivity 0.556±0.000 0.556±0.000 0.561±0.008 0.561±0.008 0.594±0.020 0.500±0.012 0.306±0.034 0.550±0.041 0.661±0.055 0.867±0.154 0.633±0.012 0.667±0.000 0.006±0.069
Accuracy 0.759±0.044 0.759±0.044 0.761±0.047 0.761±0.047 0.757±0.050 0.767±0.035 0.700±0.052 0.693±0.046 0.761±0.050 0.815±0.040 0.765±0.044 0.730±0.039 0.641±0.075
As shown in Table IV, uHONMFmu obtains the highest mean prediction accuracy (0.8148). This is significantly better than GenHMMs and DiscHMMs. uHONMFmu also outperforms uHOSVDgls, uHOOIgls, and uHOOItf. The reasons why uHONMFls and uHOOItf do not performed well needs further investigation. The supervised sHOSVD, sHOOI and sHONMF did not achieve good results. The small parameters of the tensor methods indicate that only few genes pathways and biological stages respond to the INF𝛽 treatment. The MLDR techniques are able to dramatically reduce the dimension of the original dataset and transform the sample matrices into new ”equivalent” short vectors which are used for classification. In uHONMFmu, a 53 by 7 test sample can be represented by a vector of size 1 by 3 in feature space; thus reducing the data by 99.19% while preserving discriminative information. The execution times (in seconds) were recorded for each method. Tab.V shows the results. The tensor decomposition based approaches use the same parameter (3, 5, 3). The number of selected genes is 7. It can be seen that HONMF based approaches are faster than the HMMs based methods while giving at least comparable classification results, though slower than HOSVD and HOOI methods.
B. Experiment of HONMF We used our HONMF approaches to predict good or bad responders to Interferon beta (INF𝛽) treatments. INF𝛽 is a protein used for treating patients afflicted with multiplesclerosis (MS). Some MS patients after INF𝛽 therapy do not respond well to the drug and the reasons are still not clear [1]. Baranzini et al. [1], among others researchers, applied Bayesian learning method on a clinical time-series dataset to determine pairs or triplets of genes that can discriminate between bad and good INF𝛽 responders. The initial dataset is a GST data sampled from 53 MS patients who were initially treated with equal dose of INF𝛽 over a time period. This initial dataset contains the expression measurements for 76 genes at 7 time points for each patient, with 31 patients responding well and the remaining 22 responding bad to the treatment. This dataset contains genes with missing expression measurements at some time points. Those genes and corresponding samples were removed from our analysis, and hence, the resulting ”complete” data contains 53 genes and 27 samples (18 good responders and 9 bad responders). Our proposed HONMF based methods were applied to this INF𝛽 data. They were compared with GenHMMs and DiscHMMs approaches [16]. Matlab codes for HONMF and HOOI from [9] and [25], respectively, are used. We used 3-NN with Euclidean distance in the classification phase. Due to the small number of samples, 9-fold CV is employed. All our methods are performed for 20 runs, and the mean performances and standard deviations are reported in Table IV. Specificity is the prediction accuracy of the good responders, while sensitivity is for the bad responders. The parameter for GenHMMs and DiscHMMs is the number of selected genes; absence of such parameter
Table V C OMPUTATION T IME ON C OMPLETE INF-B ETA DATA Methods Time (s.)
DiscHMMs 2.117 × 10³
uHOSVDgls 1.321
uHOOIgls 1.057
uHONMFtf 1.662 × 10³
V. C ONCLUSIONS Non-negative information can help in analysis of microarray gene expression data. This paper investigated the performance of NMF based classification scheme for binary and multi-class microarray datasets, and extended it for
442
GST data, which is our main contribution. Methods devised specifically for the analysis of GST data will be very useful in the near future, as many recent clinical data are given in the form of tensor data of order 3 or more. In this regards, we have implemented a HONMF-based scheme for classifying sample GST data from INF𝛽 data. We have shown that our approach are faster and still comparable in classification performances to two recent methods developed for analyzing the same dataset. More research need to be done, however, to improve the classification performances of the tensor-based methods (for instance, SVM classifiers will be investigated deeply), and in particular to devise methods that can deal with missing values. Beside classification, bi-clustering and tri-clustering approaches for GST data will be studied for determining pattern of genes or samples given certain doses (in dose-response GST data) or time intervals (in drugresponse GST data).
[10] J.P. Brunet, et al., “Metagenes and molecular pattern discovery using matrix factorization,” PNAS, vol. 101, no. 12, pp. 4164-4169, 2004. [11] H. Kim and H. Park, “Sparse non-negatice matrix factorization via alternating non-negative-constrained least squares for microarray data analysis,” Bioinformatics, vol. 23, no. 12, pp. 1495-1502, 2007. [12] R. Schachtner, et al., “Exploring matrix factorization techniques for classification of gene expression profiles,” in WISP, Alcala de Henares, 2007, pp. 1-6. [13] W. Liu, K. Yuan, and Z. Xie, “Sparse nonnegative matrix factorization for classification of gene expression data,” in Proc. BIBE-ICBBE, Wuhan, 2007, pp. 180-183. [14] P. Zhang, et al., “Tumor classification using non-negative matrix factorization,” ICIC 2008, CCIS 15, pp. 236C243, 2008. [15] C. Zheng, et al., “Gene expression data classification based on non-negative matrix factorization,” in Proc. IJCNN, Atlanta, 2009, pp. 3542-3547.
ACKNOWLEDGMENT The authors would like to thank Dr. Rasmus Bro and Dr. Morten Mørup. This research has been partially funded by IEEE CIS Walter Karplus Summer Research Grant 2010, Canadian NSERC Grants #RGPIN228117-2006, and CFI grant #9263.
[16] T. Lin, N. Kaminski, and Z. Bar-Joseph, “Alignment and classification of time series gene expression in clinical studies,” Bioinformatics, vol. 24 ISMB 2008, pp. i147-i155, 2008. [17] I.G. Costa, et al., “Constrained mixture estimation for analysis and robust classification of clinical time series,” Bioinformatics, vol. 25 ISMB 2009, pp. i6-i14, 2009.
R EFERENCES [1] S.E. Baranzini, et al., “Transcription-based prediction of response to INF𝛽 using supervised computational methods,” PLOS Biology, vol. 3, no. 1, pp. e2, 2005.
[18] M.A.O. Vasilescu and D. Terzopoulos, “Multilinear image analysis for facial recognition,” in Proc. ICPR, Quebec, 2002, vol. 3, pp. 511-514.
[2] A. Zhang, Advanced Analysis of Gene Expression Microarray Data, World Scientific, Singapore, 2009.
[19] L. Omberg, G.H. Golub, and O. Alter, “A tensor higher-order sigular value decomposition for integrative analysis of DNA microarray from different studies,” PNAS, vol. 104, no. 47, pp. 18371-18376, 2007.
[3] K.M. Borgwardt, S.V.N., Vishwanathan, and H.P. Kriegel, “Class prediction from time series gene expression profiles using dynamical systems kernels,” Proc. PSB, HI, 2006, pp. 547-558.
[20] B. Savas and L. Eld´en, “Handwritten digit classification using higher order singular value decomposition,” Pattern Recongtion, vol. 40, pp. 993-1003, 2007.
[4] D.D. Lee, S. Seung, “Learning the parts of objects by nonnegative matrix factorization,” Science vol. 401, pp. 788-791, 1999.
[21] M. Du, S. Zhang, and H. Wang, “Tumor classification using higher-order gene expression profiles based on multilinear ICA,” Advances in Bioinformatics, vol. 2009, doi:10.1115/2009/926450, 2009.
[5] A. Cichocki, , et al., Nonnegative Matrix and Tensor Factorizations: Applications to Exploratory Multi-way Data Analysis and Blind Source Separation, Wiley, West Sussex, 2009.
[22] M.H. van Benthem and M.R. Keenan, “Fast algorithm for the solution of large-scale non-negative-constrained least squares problems,” J. Chemometrics, vol. 18, pp. 441-450, 2004.
[6] T.G. Kolda and B.W. Bader, “Tensor decompositions and applications,” SIAM Review, vol. 51, no. 3, pp. 455-500, 2009.
[23] U. Alon, et al., “Broad patterns of gene expression revealed by clustering of tumor and normal colon tissues probed by oligonucleotide arrays,” PNAS, vol. 96, no. 12, pp. 6745-6750, 1999.
[7] L.D. Lathauwer, B.D. Moor, and J. Vandewalle, “A multilinear singular value decomposition,” SIAM J. Matrix Anal. Appl., vol. 21, no. 4, pp. 1253-1278, 2000. [8] M.A.O. Vasilescu and D. Terzopoulos, “Mulitlinear independent component analysis,” Proc. CVPR, San Diego, 2005, vol. 1, pp. 547-553.
[24] J. Khan, et al., “Classification and diagnostic prediction of cancers using gene expression profiling and artificial neural networks,” Nature Medicine, vol. 7, no. 6, pp. 673-679, 2001.
[9] M. Mørup, L.K. Hansen, and S.M. Arnfred, “Algorithms for sparse nonnegative tucker decompositions,” Neural Computation, vol. 20, no. 8, pp. 2112-2131, 2008.
[25] C.A. Andersson and R. Bro, “The n-way toolbox for MATLAB,” Chemometr. Intell. Lab. Syst., vol. 52, pp. 1–4, 2000.
443