constant amount of arterial blood and other constant tissue optical factors such as skin pigmentation and hemoglobin. [7]. Fig 1: Normal PPG Waveform [1].
International Journal of Computer Applications (0975 – 8887) Volume 86 – No 17, January 2014
Novel Notch Detection Algorithm for Detection of Dicrotic Notch in PPG Signals Sanjeev Nara
Manvinder Kaur
Kundan Lal Verma
Department of Biomedical Engineering Deenbandhu Chhotu Ram University of Science and Technology, Murthal
Department of Biomedical Engineering Deenbandhu Chhotu Ram University of Science and Technology, Murthal
Department of Electronics Deen Dayal Upadhyay Gorakhpur University, Gorakhpur
ABSTRACT Photoplethysmography (PPG) is a non-invasive optical technique that measures relative blood volume changes in the blood vessels and is widely used for research and physiological studies. Dicrotic notch represent the closure of the aortic semi-lunar valve and subsequent receding blood flow when ventricles relax. Their location is used to calculate systolic time intervals and monitor cardiac function. They play a significant role in early evaluation of various diseases such as sclerosis, occlusion, arterial spasm etc. This paper proposes a novel Notch Detection Algorithm (NDA) for detection of dicrotic notches from PPG signal that are measured by non-invasive photoplethysmography sensors. The proposed algorithm is implemented with the help of self developed Graphical User Interface (GUI) in MATLAB.
due to venous blood and DC component that describes the constant amount of arterial blood and other constant tissue optical factors such as skin pigmentation and hemoglobin [7].
Keywords Photoplethysmography, Dicrotic Notch, Notch Detection Algorithm, Graphical User Interface
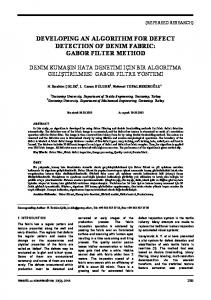
1. INTRODUCTION Photoplethysmography (PPG) is a non invasive optical measurement technique that can be used to detect changes in skin blood pulsation. Light traveling through tissue is reflected, backscattered and partially absorbed by skin pigmentation, and hemoglobin. The intensity of either transmitted or backscattered light could be measured by a convenient contact probes placed at different body locations such as fingertip or earlobe. The variations of blood volume and the changes of the red blood cell orientation during pulsatile blood flow have been suggested as important factors in the origin of PPG signals [4]. The PPG waveform was first introduced in the 1930s. With the introduction of pulse oximeter in 1980s its importance in clinical medicine was greatly increased. Pulse wave analysis helps to study diabetes & arthritis. It is unique for each individual so it would also give unique identification as biometric identification. Pulse wave analysis also helps to study large artery damage & an abnormality in the cardiovascular disease that is one of the common causes of high mortality rate. PPG analysis emphasizes the importance of early evaluation of the diseases. Generally, photoplethysmography wave is composed of alternating part (AC component) and non-pulsatile component (DC component. The AC component describes total absorbance due to the pulsations of the arterial blood and absorbance
Fig 1: Normal PPG Waveform [1] As shown in Figure-1 above, the first wave in conventional PPG wave form is forward traveling called systolic peak and the second one is diastolic peak which is the reflected wave that returns from the periphery. Aortic notch or Dicrotic notch is a small downward deflection in the arterial pulse that separates systolic and diastolic phase. It is observed in the aortic pressure signal as a consequence of closing of aortic valve [5].
2. METHODLOGY The experiment is performed with 20 subjects, with age group between 20-25 years. A four channel, portable BIOPAC MP 100 equipment is used for recording the PPG signals which works on Acqknowledge 4.2 software. The sampling rate used for raw PPG signal recording is 1024 samples/second. The sampling rate is kept on the high side to avoid the aliasing effects.
Fig 2: Block Diagram of Methodology Followed
36
International Journal of Computer Applications (0975 – 8887) Volume 86 – No 17, January 2014
Fig 3: GUI for Dicrotic Notch Detection The basic methodology followed is shown in Figure-2. PPG signals were acquired from the index finger of the subjects. After PPG acquisition, the PPG data was first filtered and then can be analyzed using Notch Detection Algorithm with the help of self developed Graphical User Interface (GUI) in MATLAB.
3. GRAPHICAL USER INTERFACE Dicrotic Notch in PPG signal offers us useful and valuable information after it is quantified. Various signal-processing techniques are applied on raw PPG to achieve the accurate and actual notch from the PPG signal. The GUI that we designed is shown in the Figure-3. The methodology followed is that the raw signal is passed first through notch filter to remove electrical noise present in the signal and then through wavelet transform. The constant PPG-baseline shift may occur if any change within the application site was done or if the subject did not relax at measurement. This problem is solved by using Wavelet Transform, which is considered as an efficient tool for local analysis for non stationary signals. Wavelet Transform is implemented using mother wavelet Daubechies ‘db4’ as signal reconstruction is much more accurate through this wavelet [13]. The proposed algorithm is then applied on the filtered signal.
3.1 Notch Detection Algorithm First derivative of the filtered PPG signals is taken to locate pulse peaks and sharp upward slope at the beginning of cardiac event separately. Valleys of the pulse peaks are then determined by setting a minimum threshold value. If the valley exceeds the threshold during the first step of
analysis, it is classified as minima. The threshold level is updated after each valley is detected. When all the valleys of signal are classified then by setting the maximum threshold value using the same technique, peak between two alternate valleys is detected. The peak between two alternate valleys corresponds to the dicrotic notch. These peaks position are stored and are then finally located on to the original PPG signal.
4. RESULT To evaluate the accuracy and efficacy of our method, we implemented a number of various published algorithms on the same data and compared the results with the proposed NDA algorithm. At first, we have taken the result of a method where the dicrotic notch is detected by first performing the high pass filtering on the signal and then detecting the alternate valleys in the HPF signal of the same subject which corresponds to dicrotic notch [8]. Figure-4(a) below shows the comparison of notch detection through first and NDA algorithm. The dicrotic notches pointed on green PPG signal are detected through NDA and dicrotic notches pointed on blue signal are the ones detected through algorithm described above. In same way we used a second algorithm in which wavelet decomposition was used to determine the diastolic peaks to detect dicrotic notch in the signal [9]. Figure-4(b) below shows the result of comparison. The Dicrotic notch pointed on green PPG signal are through NDA and dicrotic notches pointed on blue signal are the ones detected through second algorithm described. NDA has same result as that of this algorithm.
37
International Journal of Computer Applications (0975 – 8887) Volume 86 – No 17, January 2014
a) Comparison of Dicrotic notch detected through NDA (pointed on green PPG signal) and First Algorithm (pointed on blue PPG signal)
b) Comparison of Dicrotic Notches detected through NDA (pointed on green PPG signal) and Second Algorithm (pointed on orange PPG signal) Fig 4: Comparison of Proposed Algorithm with published algorithms
The tabulation below (Table-1) describe the position values of dicrotic notch in PPG of same subject whose dicrotic notches are detected through two different algorithms and are then compared with the proposed NDA algorithm. Table1. Comparison through position values of Dicrotic Notch
First Algorithm 51 107 163 219 274 330
Second Algorithm 51 108 163 217 274 332 385
Proposed Algorithm 51 108 163 217 274 332 385
Based on the comparisons performed using different published algorithms it is depicted that the proposed Notch Detection Algorithm is simple, reliable and effective method to detect the accurate dicrotic notches in PPG signals.
5. CONCLUSION The objective of this paper was to devise a method that can accurately and consistently extract the dicrotic notch from the PPG signal for various heart rates and arrhythmias. The proposed Notch Detection Algorithm effectively analyzes the signal and results in correctly pointing the notch. The
non invasive direct monitoring of these dicrotic notches can provide useful diagnostic information about hemodynamic parameters. These are important for clinicians for analyzing the dynamic blood volume changes that depends on the features of the heart function, size and elasticity of the blood vessels, and specific neural processes [13]. In future study, experiments will be conducted using Notch detection algorithm proposed in this paper to examine the variations in parameters that can be extracted from PPG signal.
6. ACKNOWLEDGMENT Our special thanks to the student volunteers for their help by giving precious time for data acquisition and showing patience in the same.
7. REFERENCES [1] http://jeffreymlevinemd.com/wpcontent/uploads/2010/ 02/Arterial-Pulsation-Wave-Form_WEB2.jpg [2] Joydeep Bhattacharya, Partha Pratim Kanjilal and V.Muralidhar, “Analysis and Characterization of Photo-Plethysmographic Signal”, IEEE Transaction on Biomedical Engineering, January 2001, Vol. 48, No.1, pp 5-23. [3] K.L. Verma, A.K. Jaiswal and S.S. Chandel, “Statistical Methods of Bio-Physiological Data Processing,” ISBN 978-3-659-31141-3, Lambert Academic Publishing, Germany, 2012 [4] K.Meigas, R.Kattai and M.Nigul, “Comparisons of Signal of Pulse Profile as Skin Surface Vibration PPG and Doppler Spectrogram for Continuous Blood
38
International Journal of Computer Applications (0975 – 8887) Volume 86 – No 17, January 2014 Pressure Monitoring,” Proceeding of the International Federation for Medical and Biological Engineering, 2002, Vol. 3, pp. 510-511. [5] L. Antonelli, W. Ohley and R. Khamlach, “Dicrotic notch detection using wavelet transform analysis,” IEEE, 1994, pp. 1216-1217. [6] M.H.Sherebin, R.Z. Sherebin, “Frequency Analysis of Peripheral Pulse Wave Detected in the Finger with Photoplethysmograph,” IEEE Transaction on Biomedical Engineering, March 1999, Vol.37, No.3. [7] M.J. Oppenheim and D.F. Sittig, “An Innovative Dicrotic Notch Detection Algorithm which combines Rule-based logic with Digital Signal Processing Techniques,” Computers and Biomedical Research, 1995, pp. 154-170 [8] Prakhar Prakash, Meghna Sareen, Rohin Anand, Abhinav and Sneh Anand, “Application of wavelets based multiresolution analysis to detect relevant points of interest from finger-tip photoplethesmography and pressure signal from the radial artery,” Proceedings of the IEEE : CIBEC'08, 2008
IJCATM : www.ijcaonline.org
[9] R.B. Blažek , Chien-Cheng Lee, “Multi-resolution Linear Model Comparison for Detection of Dicrotic Notch and Peak in Blood Volume Pulse Signals,” Analysis of Biomedical Signals and Images; 2010, 20: 378-386 [10] Sangeeta Bagha and Laxmi Shaw, “Real Time Analysis of PPG Signal for Measurement of SpO2 and Pulse Rate,” International Journal of Computer Applications, December 2011, Vol. 36– No.11, pp.4550 [11] Subhash Bharati, Girmallappa Gidveer, “Waveform Analysis of Pulse Wave Detected in the fingertip with PPG” International Journal of Advances in Engineering & Technology, March 2012, Vol. 3, pp. 92-100 [12] Swarup Sarkar, Akash Kumar Bhoi and Gyanesh Savita , “Fingertip Pulse Wave (PPG signal) Analysis and Heart Rate Detection,” International Journal of Emerging Technology and Advanced Engineering, September 2012, Volume 2, pp.404-408
39