Journal of Mechanical Science and Technology 30 (3) (2016) 1421~1430 www.springerlink.com/content/1738-494x(Print)/1976-3824(Online)
DOI 10.1007/s12206-016-0250-2
Numerical simulation and experimental comparison of the R12, R22 and R134a flow inside straight and coiled helical capillary tubes† Masoud Zareh1,*, Mohammad Ghorbani Heidari1 and Puya Javidmand2 1
Department of Mechanical and Aerospace Engineering, Science and Research Branch, Islamic Azad University, Tehran, Iran 2 Department of Aerospace Engineering, Wichita State University, Wichita, KS (Manuscript Received July 1, 2015; Revised October 24, 2015; Accepted November 3, 2015)
----------------------------------------------------------------------------------------------------------------------------------------------------------------------------------------------------------------------------------------------------------------------------------------------
Abstract This paper presents a numerical simulation for adiabatic condition of the R12, R22 and R134a flow through straight and helically capillary tubes and also an experimental investigation of the R134a flow inside straight and helically tubes. Therefore, the two-phase flow is developed by using Drift flux model (DFM) with proper friction factor for both straight and helical capillary tubes. The conservation equations of the mass, energy and momentum are numerically solved using the 4th order Runge-Kutta method. Numerical model is validated by the previously published paper and also by present experimental results. The effect of refrigerant, inlet pressure, inlet temperature, degree of sub-cooling, capillary tube’s geometry and dimension are studied. The results show that mass flux increases linearly as degree of sub-cooling increases as well as by increasing of coiled diameter and tube diameter. Moreover, void fraction and vapor quality’s variation has same trend along coiled and straight capillary tubes. Keywords: Adiabatic; Drift flux model; Experimental; Helical capillary tube; Numerical; Straight ----------------------------------------------------------------------------------------------------------------------------------------------------------------------------------------------------------------------------------------------------------------------------------------------
1. Introduction The Capillary tube as an expansion device controls refrigerant mass flow rate and balances the system pressure in the refrigeration cycle. Nominal size of the capillary tube is ranging between 0.5-2.0 mm in diameter and 1-6 m in length [1-5]. Capillary tubes are also normally applied as expansion device in small refrigeration systems such as refrigerator and freezer [6-12]. Despite the simple geometry and configuration, the complex physical processes are observed during the throttling of refrigerant flow inside capillary tube, which have been the subject of many studies in the twenty years ago. Schenk and Oellrich [4] presented new experimental data for R600a flow through adiabatic capillary tube. Moreover, the effect of critical flows or choked flow is investigated by them using experimental data [4]. Effects of coiling in capillary tubes have been also investigated experimentally and numerically by limited of researchers. A correlation for the mass flow rate has proposed based on Buckingham- p method and experimental investigation for R22, R407C and R410A by Park [5]. He founds that the mass flow rate for coiled capillary tubes in same geometry condition is quite reduced in comparison of the straight capillary *
Corresponding author. Tel.: +98 21 4486 8536 E-mail address:
[email protected] Recommended by Associate Editor Ji Hwan Jeong © KSME & Springer 2016 †
tubes. Valladares [6, 7] presented a numerical simulation model and experimental validation for R22 flow through the coiled capillary tubes based on the finite volume formulation. A numerical model was developed by Chingulptak and Wongwises [8, 9] for refrigerant flow inside coiled capillary tube by using the homogenous model. In addition, they found that in the same length, mass flow rate in the coiled capillary tube with coil diameter for 40 mm is reduced about 9 percent rather than in straight capillary tube [8, 9]. Guobing and Zhang [10, 11] have conducted an experimental investigation on helically coiled capillary tubes and R22 refrigerant flow. The mass flow rate of a capillary tube with coil diameter of 40 mm is approximately 10% less than that of the straight capillary tube. In addition, they have found that the mass flow rates of the coiled capillary tubes have decreased by 6-15% than those of the straight capillary tubes. Khan et al. [12] used a homogenous two-phase flow model to study adiabatic helical and spiral capillary tube. Results indicated that length of the helical capillary tube increases with the pitch of the helix and the length is 12% shorter than that of the straight capillary tube. A new numerical modeling of the refrigerant mass flow rates through adiabatic capillary tubes and also short tube orifices was presented by Yang and Zhang [13] in order to obtain generalized dimensionless correlation. This numerical simulation was used of the homogeneous equilibrium model for different refrigerants entering adia-
1422
M. Zareh et al. / Journal of Mechanical Science and Technology 30 (3) (2016) 1421~1430
batic capillary tubes or short tube orifices in sub-cooled liquid, two-phase mixture and supercritical fluid. Therefore, they proposed a general correlation for adiabatic flow condition through straight capillary tubes and short tube orifices [13]. Ingle et al. [14] developed a numerical model for two phase refrigerant flow inside the capillary tubes. This model established based on mechanical and thermal equilibrium between liquid phase and vapor phase. Their results indicated that the flashing phenomenon happens when a liquid is out of thermodynamic equilibrium. The flashing’s rate of refrigerant was simulated proportion to the deviation from the equilibrium vapor pressure. Moreover, model can be applied in critical flow rate condition for different inlet conditions [14]. Chingulpitaka and Wongwises [15] have also developed a numerical investigation of the refrigerant flow characteristics inside helical capillary tubes and have compared it with straight capillary tubes. They were used homogenous twophase flow model based on the conservation of mass, energy, and momentum. Furthermore, they validated the results by comparing it with the previously experimental data of both straight and helical capillary tubes. Theirs results indicate that the refrigerant flowing through the straight capillary tube have a slightly lower pressure drop in compression with flow in the helical capillary tube, which in same condition [15]. The stepped capillary tube is a new design that consists of two serial-connected capillary tubes with different diameter as an alternative in order to reduce the manufacturing cost of the two capillary tubes and a by-pass check valve in residential heat pump systems. Valladares [16] presented a numerical simulation of the stepped capillary tube by considering of the metastable regions. In addition, He used a statistical analysis based on linear regression and deviation errors in order to validate his model. The model validation for R22 shows reasonable results [16]. Furthermore, a theoretical model was developed by Sinpiboon and Wongwises [17] based on conservation of mass, energy and momentum of fluids in the capillary tube and suction line in order to study refrigerant flow characteristics in non-adiabatic capillary tubes. They categorized the mathematical model’s region into three different cases, depending on the position of the heat exchange process. The differential equations was solved by the explicit method of finitedifference scheme and also validated in compression with the previously experimental data. The results obtained from the present model show reasonable agreement with the experimental data [17]. Mostly of the previous studies that reviewed here, belongs to CFC refrigerant flow along straight or coiled capillary tubes, moreover by considering the scarcity of published experimentally papers related to R134a flow through helical capillary tubes, so to close this gap, an experimental set up was built and experimental data in the range of typical small scale refrigeration systems is collected. Therefore, this study attempts to use a pioneer numerically method (DFM) to predict flow characteristics along the adiabatic straight and helical capillary
tube with various refrigerants such as R134a, R12, R22 and also experimentally investigation for R134a flow under different operating conditions and capillary tubes’ type and geometries. Finally, the performance of the both type of adiabatic capillary tubes are studied experimentally by a closed loop test rig and also refrigerant’s effect was investigated by developing “a non-refrigerant oriented drift flux model using proper friction factor for coiled helical capillary tube”.
2. Numerical simulation A Drift flux model (DFM) by considering of fixed capillary tube’s inner diameter and relative roughness, oil-free refrigerant, adiabatic refrigerant flow, one- dimensional and steady state flow, and also neglecting the effects of metastable flow is presented. Therefore, at first this model is simulated for straight capillary tube and then it is extended to helical coiled capillary tube by using present proper friction factor correlation. Normally, in drift flux flow model (DFM), the conservation of mass, momentum, and energy equations are applied by considering the two-phase region as a mixture of two liquid and vapor phases with different velocity. Then, the formulation of the two-phase flow is demonstrated in terms of three equations of continuity, momentum and energy for mixture and one drift velocity equation for vapor phase. Finally, the governing equations for both single phase and two-phase refrigerant flow are developed as follow: 2.1 Single phase region Eqs. (1) and (2) display momentum equation governs for single-phase flow region and sub cooled liquid length, respectively as follow:
f G2 dp =- D . dz 2dρ f Lsub =
2dρ f
( pin
(1) - psat )
fDG2
.
(2)
where Psat is defined as the statured pressure related to the refrigerant temperature at inlet. Furthermore, the friction factor of the refrigerant flow (fD) through straight capillary tube and coiled capillary tube is represented by Colebrook’s correlation and Valladares [6] equation, respectively by considering of tube’s relative roughness as following: æε 9.34 ö ÷. = 1.14 - 2 log ç + ç d fD Re fo f D ÷ø è c1 (d / D)0.5 c2 fD = (1 + ). (R e (d / D) 2.5 )1/6 ( Re (d / D) 2.5 )1/6 1
(3) (4)
2.2 Two-phase flow region The governing equations of the continuity, momentum and
M. Zareh et al. / Journal of Mechanical Science and Technology 30 (3) (2016) 1421~1430
energy for one dimensional and steady state two-phase flow are respectively defined as following:
d d ( r f u f (1 - a )) + ( rv uva ) = 0. dz dz dp d d + (αρv uv 2 ) + ((1- α ) ρ f u f 2 ) = Fw dz dz dz uf 2 ö uv 2 ö d æ d æ ) ÷ + ç ρ f u f (1- α ) ( h f + )÷ = 0 . ç ρv uv α ( hv + ç dz è 2 ø dz è 2 ÷ø
(5) (6)
æ 37530 ö Btp = ç ÷ ç Retp ÷ è ø
16
Then the drift velocity and volumetric flux for vapor phase are defined by:
uvj = uv - j
(8)
αρ u + (1- α ) ρ f u f j = v v ρm
(9)
and density of the mixture (refrigerant’s liquid-vapor phase) is also defined by:
ρm = αρv + (1- α ) ρ f .
(10)
The following correlation for drift velocity of two-phase refrigerant flow along horizontal tubes, by Zuber and Findly [18] presented: 1
ρ é ( ρ - ρv ) σg ù 4 uvj = c 0 j + 1.48 f ê f ú . ρm ë ρf 2 û
(11)
For example, Liang and Wong [19] has obtained reasonable results with c0 equal one for critical flow condition through capillary tubes. Therefore, by using c0 = 1 and substituting Eqs. (10) and (11) into Eq. (12), the following equation is founded [19]. 1 4
u f = uv -
1.48 é ( ρ f - ρv ) σg ù ê ú 1- α ë ρf 2 û .
(12)
Furthermore, the wall friction (Fw) of two-phase refrigerant flow, could be calculated by multiplying two-phase multiplier and the wall friction gradient of overall single-phase refrigerant flow as follows: Fw = -φ fo 2
fDG2 . 2dρ
(13)
The friction factor of the coiled capillary tube is also determined by Eq. (5), where φfo2 is the multiplier for two-phase flow region was presented by Lin et al. [20]: φ fo 2 = [
Afo + B fo A tp + Btp
]
1
8
[1 + x(
ρf ρv
-1)]
16
é æ 7 0.9 0.27 ε ö ù Afo = ê-2.457 Ln ç ( ) + ÷ú ç Re fo d ÷ø ú êë è û
é Atp = ê-2.457 Ln êë
(7)
(14)
1423
Re fo =
DG μf
(15) 16
æ 7 0.9 0.27 ε ö ù ) + ç( ÷ú ç Retp d ÷ø ú è û
(16)
16
æ 37530 ö , B fo = ç ÷ ç Re fo ÷ è ø
,
Retp =
DG μ tp
(17) (18)
x=
rv uva G
(19)
aj
duv dα dp + bj + cj = dj . dz dz dz
(20)
The amount of the coefficients aj, bj, cj and dj for j = 1, 2, 3 are obtained based on refrigerant type and it’s properties [2, 3]. Therefore, these coefficients could be calculated by using thermodynamic properties and related refrigerant’s charts. The 4th order Runge-Kutta method was used to predict the critical mass flow rates of the refrigerant flow through capillary tube with very small inlet quality. Using this numerical simulation and iteration method, system of equations for j = 1, 2 and 3 are solved simultaneously, for unknown variables vapor velocity (uv), void fraction (α) and pressure (p) under specified initial conditions are obtained, then mass flux is increased up to the point where choked flow happens at the end of the tube when dp/dz approaches infinity. This method is not refrigerantoriented, in depended of the refrigerant type, with high convergence rate, small computation time and high accuracy. Therefore, it can avoid a vast amount of repetitive experiments. Finally, critical mass flux distribution, pressure variations, vapor quality and void fraction variations through adiabatic capillary tubes are obtained.
3. Experimental set up and test conditions The schematic feature of experimental set up was shown in Fig. 1. This apparatus consists of the main components such as compressor, condenser, evaporator, sub-cooler, accumulator, receiver-drier, oil separator, preheater, filter, etc. It was also designed for different refrigerants such as the R134a, R12 also R22 different modular capillary tubes test section. The all kinds of test section made of drawn copper capillary tube are shown in Fig. 2. From capillary tube, refrigerant enters evaporator. A tank of the ethylene glycol was designed for evaporator heat load. Ethylene glycol was circulated by a centrifugal pump. The two-phase flow from the evaporator is sent toward the accumulator. Therefore, only vapor may enter the reciprocating compressor. The oil-free vapors from oil separators are condensed in the shell and tube condenser. An open loop cooling water tank is applied in order to obtain steady condition for water flow. Three sight glasses are installed after the condenser, inlet and outlet of capillary tube to visualize the state of refrigerant flow. A sub cooler and an electrical heater are also used after the
1424
M. Zareh et al. / Journal of Mechanical Science and Technology 30 (3) (2016) 1421~1430
Fig. 1. Experimental apparatus.
Fig. 3. Comparison of the present experimental work and experimental data of Chen and Lin [21] along the adiabatic straight capillary tube.
Fig. 2. Schematic feature of the straight and coiled adiabatic capillary tube.
water cooled condenser in order to fine tune the refrigerant flow sub-cooling degree. The high pressure liquid from condenser is collected in the receiver. In order to achieve continuous supply refrigerant flow through capillary tube, saturated and sub cooled liquid is collected in the receiver- drier. A Filter was placed in order to collect and remove the moisture, impurities and particles. A manually expansion valve is also placed after the condenser and in parallel with the test section to adjust the surplus refrigerant flow in capillary tube. Temperature at different locations of the main components such as condenser, sub-cooler and compressor are measured by thermocouples. Furthermore, the pressure at the inlet and outlet of the compressor and test section are measured by using the Bourdon pressure gauges. The pressure along the helical capillary tube is measured using 10 online pressure transducers connected to a computer. Temperature along the wall of the capillary tube is also measured by 20 K-type thermocouples. Any kinds of capillary tubes of with different diameters from 0.7874 mm to 1.40 mm, different lengths from 1.5 m to 6.2 m, and two coil diameters 40 mm and 50 mm (for coiled capillary tubes) are used in the experimental investigation. The range of inlet sub-cooling degree is adjusted from 4°C to 16°C, while condensing temperature is set at 38°C to 50°C for each tube length, tube diameter and coil diameter of the different kinds of capillary tubes. In order to reach the steady state conditions in each test run, the exit pressure of the capillary tube is adjusted lower than 200 kPa for all test runs that ensures choked conditions. This process takes about 50-60 minutes to accomplish. The steady state condition is achieved when the inlet pressure and condenser temperature remain steady about
5-10 minutes (depend on test condition) within 0.05 bars and 0.2°C, respectively. A counter is also used to measure the critical mass flux in the bypass circuit located next to the horizontal test section. The pressure and temperature variation along the coiled capillary tube are recorded using online pressure transducers and online thermocouples with an accuracy ±0.25% of full scale and ±0.3°C, respectively.
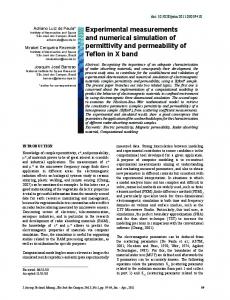
4. Results and discussion For validating of the present numerical modeling and this experimental investigation, the results are compared with previous data of Chen and Lin [21], Wolf et al. [22], Liang and Wong [19], Mikol [23], Li et al. [24] and Bansal and Wang [25] for straight capillary tubes in adiabatic flow conditions an also the present numerical and experimental results were compared with each other. 4.1 Experimental validation of present work In order to validate the present experimental work in adiabatic flow condition, this comparison were shown in Fig. 3 and also more details information were illustrated in Table 1 for adiabatic flow condition. Distribution of measured pressure of Chen and Lin [21] for R134 flow through adiabatic straight capillary tubes with 0.66 mm inner diameter, 160 cm length in same condition of our results was shown in Fig. 3. Therefore, this comparison shows maximum error of about 12% for pressure profile. In other hands, it indicates a reasonable agreement of the present work data and results of Chen and Lin [21]. Moreover, the present experimental results were compared with published data by Wolf et al. [22]. This comparison, in Table 2, displays maximum deviation about 8 percent for
M. Zareh et al. / Journal of Mechanical Science and Technology 30 (3) (2016) 1421~1430
1425
Table 1. Comparison of the present work and the measured pressure for straight adiabatic capillary tube of Chen and Lin [21].
Position (cm)
Chen and Lin, kpa (num.)
0.0
907
916.1
-0.99
0.99
30.0
832.5
851.4
-2.22
2.22
50.0
785.2
803.9
-2.34
2.34
70.0
731.0
762.5
-4.14
4.14
Present exp. Average error Mean error work, kpa (%) (%)
97.0
656.6
671.6
-2.25
2.25
110.0
620.0
617.1
0.47
0.47
124.0
555.0
559.5
-0.81
0.81
134.0
473.8
512.1
-7.47
7.47
144.0
311.4
437.3
-28.80
28.80
150.0
203.1
363.6
-44.15
44.15
153.0
108.3
161.6
-32.98
32.98
-11.4
11.5
Fig. 4. Comparison of the present numerical simulation’s results with the experimental data for R12.
1 n å ABS[((m& pred - m& meas ) *100) / m& meas ] , n 1 1 n Average(%) = å [((m& pred - m& meas ) *100) / m& meas ] n 1
Mean(%) =
Table 2. Comparison of the present experimental work and published data by Wolf et al. Wolf correla- Present Exp. tion (kg/s) work (kg/s)
Deviation
Average dev. (%)
Mean dev. (%)
0.001630196
0.0016837
-3.28
-3.18
3.18
0.001739099
0.0016275
6.42
6.86
6.86
0.001728116
0.0015012
13.13
15.11
15.11
0.001749839
0.0019843
-13.40
-11.82
11.82
0.00170307
0.0017552
-3.06
-2.97
2.97
0.80
7.99
Fig. 5. Comparison of the Liang and Wong’s data with simulation results for R134a.
R134a mass flow rate through adiabatic straight capillary tube. 4.2 Validation of the present numerical simulation Comparison of the present numerical results and experimental data of Li et al. [24] for tubes with 1.117 mm inner diameter and refrigerant R12 and published data of Liang and Wong [19] for tubes with 0.66 mm inner diameter and refrigerant R134a were shown in Figs. 4 and 5 for straight adiabatic tube, respectively. It is clearly observed that pressure variations is linear in single phase and decreases rapidly in two-phase region near the tube exit due to flashing of refrigerant. Furthermore, this comparison shows a reasonable agreement of the presented numerical results and the measured data. This verifies that the present model can be used for predicting refrigerant flow inside adiabatic straight tubes. The comparison of the pressure profile along straight tubes and coiled tube for refrigerant R22 obtained from present drift flux model and the measured data of Mikol [23] was shown in Fig. 6. It is observed that the mass flux through helical tube
Fig. 6. Comparison between experimental data and numerical results of the coiled capillary tube for R22 and R134a.
with coil diameter of 40 mm is less than of straight capillary tube about 11 percent under the same test conditions and tube length. These differences are due to the existence of secondary flow and high pressure drop in helical capillary tube. Fig. 7 displays the comparison of the pressure profile of the present numerical simulation and experimental data of Mikol [23] for tubes of 1.4 mm inner diameter and refrigerant R22 along the straight capillary tube. It’s observed that pressure’s profile is linear in single phase region and decreases rapidly in two-phase flow region at the end of the tube due to flashing. Therefore, the results indicate that this model is in agreement with the measured data, except slight deviation in the twophase region due to neglecting of the metastable flow.
1426
M. Zareh et al. / Journal of Mechanical Science and Technology 30 (3) (2016) 1421~1430
Fig. 9. Distribution of the pressure along straight capillary tube for R12, R134a and R22. Fig. 7. Comparison of the present work with the experimental data for R22.
Fig. 10. Comparison of the void fraction and vapor quality variation along straight capillary tube for R12, R134a and R22.
Fig. 8. Comparison of the present model and experimental pressure variation along the adiabatic coiled tube.
The present simulated pressure’s profile along the helical tube and pressure variation of the experimental data for tube with 1.397 mm inner diameter, 4.36 m length, 40 mm coil diameter and refrigerant R134 were illustrated in Fig. 8. It was clearly seen that there is a reasonable agreement between present experimental work and numerical simulation data at the beginning and at the end region of coiled capillary tube, but there is slight deviation in the two-phase region, where this model neglects the metastable phenomenon. Finally, this comparison indicates maximum deviation about 6%. Distribution of pressure, void fraction and vapor quality along straight adiabatic capillary tube for three refrigerants R12, R22 and R134a for tube with 1.117 mm inner diameter, 1.42 m length and different mass flux were shown in Figs. 9 and 10. It is clearly seen that pressure profiles related to different refrigerants are same, but mass flux corresponding to R12 is about 8 percent more than mass flux related to R134a and R22 for achieving to choked condition in same geometry. Variation of the vapor quality and void fraction along straight capillary tubes are illustrated in Fig. 10. It is observed that variation of the vapor quality is not linear and also vapor quality increases significantly at the start point of the vaporization
Fig. 11. Variation of the vapor quality and void fraction along the different helical adiabatic capillary tube for R134a flow.
due to phase change of refrigerant. At the capillary tube exit, vapor quality was increased notably and produces a large amount of vapor due to sharp pressure drop, when the refrigerant flow approaches the critical condition. Therefore, the void fraction was increased rapidly after the flash point and reaches to about one nearby to tube’s exit. Fig. 11 illustrates the variation of the vapor quality and void fraction along coiled capillary tubes with different geometries, mass flux and R134a and R22 flow. It observed that void fraction and vapor quality’s profile of the coiled capillary tubes are similar to the straight one, hence void fraction increases faster than vapor quality and vapor quality increases rapidly at
M. Zareh et al. / Journal of Mechanical Science and Technology 30 (3) (2016) 1421~1430
1427
Fig. 12. Void fraction and vapor quality distribution along the straight adiabatic capillary tube for R12 flow. Fig. 15. Mass flux variation for different inner tubes diameter and coiled diameter in the helical capillary tube for R134a.
Fig. 13. Variation of the pressure for different capillary tube’s length with tube diameter 1.397 mm.
Fig. 16. Mass flux variation versus degree of sub cooling for different tube diameter and coil diameter.
Fig. 14. Mass flux variation for different inner tubes diameter along straight capillary tube for R134a.
the beginning of the vaporization, but with higher rate rather than of straight one due to larger pressure drop. The variation of the vapor quality and void fraction along straight capillary tubes with different geometries, mass flux and refrigerants R134a and R12 were shown in Fig. 12. It is clearly seen that those profiles are similar with different position in vaporization and change phase due to different thermodynamics properties of refrigerants. The comparison of the saturated pressure’s distribution inside straight capillary tubes with refrigerant R134a and different tube diameter and length are shown in Fig. 13. It is observed that the pressure drop increases remarkably in the exit of all capillary tubes which is due to the increase in the friction loss in two-phase flow region. Furthermore, refrigerant’s mass
flux increased, as capillary tube length is decreased due to decrease of pressure drop. Fig. 14 presents the mass flux variation for different lengths of straight capillary tubes for different tube diameter of 1.397 mm, 1.117 mm and 0.66 mm and also refrigerant R134a. It can be seeing that the same trend of mass flux for different tube diameter. Furthermore, this result illustrates that as the capillary tube length decreases under the same conditions, mass flux increases due to decrease in friction loss. The effects of the tube diameter and coiled diameter on mass flux were shown in Fig. 15. These figures illustrate the variation of the mass flux for three different coil diameters 40 mm, 80 mm, and 100 mm; three different tube diameter 1.397 mm, 1.0668 and 0.66 mm and also different lengths obtained from the present numerical work for refrigerant R-134a. This figure shows that the mass flux of the capillary tube decreases with decrease in the coil diameter. It obviously was seen that mass flux decrease as the tube diameter decreases in same length. The mass flux variation versus degree of sub-cooling in different coiled diameter and tube diameter based on present simulation work for coiled capillary tubes with 1.5 m length and refrigerant R134 are shown in Fig. 16. It is clearly seen that mass flow rate increases linearly as degree of sub-cooling
1428
M. Zareh et al. / Journal of Mechanical Science and Technology 30 (3) (2016) 1421~1430
Fig. 17. Distribution of saturated and measured pressure along helical capillary tube for different degree of sub cooling.
Fig. 20. Variation of the measured pressure and saturated pressure (corresponding to measured temperature) for R134a flow in realistic condition.
Fig. 21. Variation of the mass flux versus along different straight and coiled capillary tubes for R134a flow. Fig. 18. Distribution of the saturated and measured pressure along helical capillary tube for different degree of sub cooling.
Fig. 19. Mass flux variation versus degree of sub cooling for two different condensing temperatures.
increases as well as increase in tube diameter. The variation of measured and saturated pressure along helical capillary tube for different degree of sub-cooling was illustrated in Figs. 17 and 18 based on experimental results. It clearly observed that liquid’s length of refrigerant increased as degree of sub-cooling increases. Variation of the mass flux versus sub-cooling degree of refrigerant inside coiled capillary tube for different condensing temperature was shown in Fig. 19. It is clearly observed that
mass flux increases linearly as degree of sub-cooling increases. Finally, these experimental results verify present numerical simulation results again. Fig. 20 shows present experimental work results in actual operation (by considering metastable phenomenon) of the capillary tube during heat transfer with ambient. Therefore, this figure displays the variation of the measured pressure and saturated pressure (corresponding to measured temperature) the R134a flow through adiabatic helically capillary tube for tube 0.9144 mm inner diameter, 4 cm coil diameter and 6.50 m length. It is clearly seen that the refrigerant flow inside the capillary tube can be classified three regions; 1) single-phase flow, 2) metastable region and 3) thermodynamic equilibrium two-phase region. Moreover, theoretical flash point is defined the intersection measured and saturated pressure profile, but generally inception of vaporization does not happen (Ps) in this point, whereas in actual flash point, vaporization takes place at this location (Pv). These two important points were occurred about 3.9 m and 4.4 m from inlet of helically capillary tube. The amount of pressure difference (Ps-Pv) is called under pressure or delay of vaporization as a main characteristic of the metastable flow. Fig. 21 displays the mass flux distribution for different lengths of straight and helical capillary tubes for inner diameter of 0.84 mm and refrigerant R134a. This figure also shows the same trend of mass flux for different tube length. More-
M. Zareh et al. / Journal of Mechanical Science and Technology 30 (3) (2016) 1421~1430
over, it can be seen that the present numerical results for both straight and coiled tube have reasonable deviation regarding to the results of Chingulptak and Wongwises [9] and the measured data of Wijaya [26]. Finally, these results indicate that as the capillary tube length decreases, mass flux increases due to decrease in friction loss under the same conditions.
5. Conclusions The performance and comparison of the adiabatic CFC and HFC flow condition through straight and helical capillary tubes was studied both using specific numerical simulations verified by experimental data. Therefore this paper can be summarized as follows: ·A drift flux model was developed by using modified friction factor equation. ·The model was validated by experimental results for R12, R22 and R134a with maximum deviation of about 11%. ·The mass flow rate through helical capillary tube with coil diameter of 40 mm is about 11% less than the straight one in same test conditions, tube diameter and tube length. ·The helical capillary tube’s length is about 14% shorter than the straight one in same mass flow rate. ·This numerical simulation is no refrigerant-oriented code with high accuracy. ·The void fraction approaches to one at the end of capillary when dp/dz approaches to infinity. ·The mass flux increases by increasing of the tube inner diameter, condensation temperature and refrigerant degree of sub-cooling. ·The comparison between the present measured data, the developed drift flux model results, and the previously published data displays maximum deviation of about 5.5%. ·Increasing mass flux of the refrigerant flow by increasing of the degree of sub cooling, tube diameter and coiled diameter. ·Distribution of the pressure, void fraction and vapor quality are obtained along capillary tubes. ·The present model can be used as a suitable tool for design and optimization of the Vapor compression refrigeration systems (VCRS).
Acknowledgment The authors would like to appreciate of the Science Research Branch, Islamic Azad University for all supports.
Nomenclature-----------------------------------------------------------------------d D F g
: Tube diameter, m : Coil diameter, m : Darcy’s friction factor : Gravity’s acceleration , ms-2
G h j p Re T u x z
1429
: Mass flux, Kgs-1m-2 : Enthalpy, kJkg-1 : Volumetric velocity, ms-1 : Pressure, kPa : Reynolds number : Temperature, K : Velocity, ms-1 : Vapour quality : Axial coordinate, m
Greek letters α ε ρ ρm σ
: Void fraction : Roughness, m : Fluid density, kgm-3 : Mixture fluid density, kgm-3 : Surface tension, Nm-1
φ2f0
: Two-phase multiplier
References [1] M. K. Khan, R. Kumar and P. K. Sahoo, Flow characteristics of refrigerants flowing through capillary tubes-A Review, App. Therm. Eng., 29 (2009) 1426-1439. [2] M. Zareh, H. Shokouhmand, M. R. Salimpour and M. Taeibi, Numerical simulation and experimental analysis of refrigerants flow through adiabatic helical capillary tube, Int. J. Refrigeration, 38 (2014) 299-309. [3] H. Shokouhmand and M. Zareh, Experimental investigation and numerical simulation of choked refrigerant flow through helical adiabatic capillary tube, App. Therm. Eng., 63 (2014) 119-128. [4] M. Schenk and L. R. Oellrich, Experimental investigation of the refrigerant flow of isobutene (R600a) through adiabatic capillary tubes, International Journal of Refrigeration, 38 (2014) 275-280. [5] C. Park, S. Lee, H. Kang and Y. Kim, Experimentation and Modeling of Refrigerant Flow through Coiled Capillary Tubes, Int. J. of Refrigeration, 30 (2007) 1168-1175. [6] O. G. Valladares, Numerical simulation and experimental validation of coiled adiabatic capillary tubes, App. Therm. Eng., 27 (2007) 1062-1071. [7] O. G. Valladares, Numerical simulation of capillary tubes expansion devices behavior with pure and mixed refrigerants considering metastable region, App. Therm. Eng., 22 (2007) 173-182. [8] S. Chingulptak and S. Wongwises, Two-phase flow model of refrigerants flowing through helically coiled capillary tubes, App. Therm. Eng., 30 (2011) 1927-1936. [9] S. Chingulptak and S. Wongwises, A comparison of flow characteristics of refrigerants flowing through adiabatic straight and helical capillary tubes, Int. Comm. in Heat and Mass Trans., 38 (2011) 398-404. [10] Z. Guobing and Z. Yufeng, Numerical model for matching of Adiabatic coiled Capillary Tube in a split air conditioner
1430
M. Zareh et al. / Journal of Mechanical Science and Technology 30 (3) (2016) 1421~1430
using HCFC22 and HC290, App. Therm. Eng., 30 (2006) 1477-1487. [11] Z. Guobing and Z. Yufeng, Numerical and experimental investigations on the performance of coiled adiabatic capillary tubes, App. Therm. Eng., 26 (2006) 1106-1114. [12] M. Khan, R., Kumar and P. K. Sahoo, An experimental study of the flow of R-134a inside an adiabatic spirally coiled capillary tube, Int. J. of Refrigeration, 31 (2008) 970978. [13] L. Yang and C. L. Zhang, A generalized dimensionless local power-law correlation for refrigerant flow through adiabatic capillary tubes and short tube orifices, International Journal of Refrigeration, 46 (2014) 69-76. [14] R. Ingle, V. S. Rao, L. S. Mohan and Y. Dai, Modelling of flashing in capillary tubes using homogeneous equilibrium approach, ANSYS Inc., Gunaranjan Chaudhry, Procedia IUTAM, IUTAM Symposium on Multiphase Flows with Phase Change: Challenges and Opportunities, 15 (2015) 286-292. [15] J. Sinpiboon and S. Wongwises, Numerical investigation of refrigerant flow through non-adiabatic capillary tubes, Applied Thermal Engineering, 22 (2002) 2015-2032. [16] O. García-Valladares, Numerical simulation and validation of a stepped capillary tube using as throttling device in residential heat pump systems, Applied Thermal Engineering, 84 (2015) 27-33. [17] J. Sinpiboon and S.Wongwises, Numerical investigation of refrigerant flow through non-adiabatic capillary tubes, Applied Thermal Engineering, 22 (2002) 2015-2032. [18] N. Zuber and J. A. Findlay, Average volumetric concentration in two-phase flow systems, J. Heat Transfer, 8 (1965) 453-468. [19] S. M., Liang and T. N., Wong, Numerical modeling of twophase refrigerant flow through adiabatic capillary tubes, App. Therm. Eng., 21 (2001) 1035-1048. [20] S. Lin, C. C. K. Kwok, R. Y. Li, Z. H. Chen and Z. Y. Chen, Local friction pressure drop during vaporization of R-
12 through capillary tubes, Int. J. Multiphase Flow, 17 (1991) 95-102. [21] D. Chen and S. Lin, Under pressure of vaporization of refrigerant R-134a through diabatic capillary tube, Int. J. Refrigeration, 24 (2001) 261-271. [22] D. A. Wolf, R. R. Bittle and M. B. Pate, Adiabatic capillary tube performance with alternative refrigerants, ASHRAE Research Project (1995) RP-762. [23] E. P. Mikol, Adiabatic single and two-phase flow in small bore tubes, ASHRAE J., 5 (1963) 75-86. [24] R. Y. Li, S. Lin and Z. Y. Chen, Numerical modeling of thermodynamic non-equilibrium flow of refrigerant through capillary tubes, ASHRAE Trans., 96 (1990) 181-186. [25] P. K. Bansal and G. Wang, Numerical analysis of choked refrigerant flow in adiabatic capillary tubes, App. Therm. Eng., 24 (2004) 851-863. [26] H. Wijaya, Adiabatic capillary tube test data for HFC-134a, Proceeding of the IIR-Purdue Refrigeration Conference, West Lafayette, USA, 1 (1992) 63-718.
Masoud Zareh is an Assistant Professor of Mechanical and Aerospace Engineering Department, Science Research Branch, Islamic Azad University. He received his doctor degree in mechanical engineering, energy conversion from Islamic Azad University. His research interests include Experimental & Numerical Modeling of the Multi-phase flow, Two-Phase Flow and Heat Transfer, Pulsating &Oscillating Heat Pipes, Computational Fluid Dynamics (CFD), Modeling and Simulation of Transport phenomena in porous media, Experimental and Numerical Simulation of Cooling Tower and specially the Optimization of the HVAC System (Refrigerator, Heat pump, Absorption system,…).