Jan 16, 2018 - Two-phase (liquid-gas) flow inside a pipe is a complicated phenomenon which is ..... that is added to the model, a variable is introduced: the volume fraction of the ..... during condensation of refrigerant R134a,". International ...
Proceedings of the ASME 2017 International Mechanical Engineering Congress and Exposition IMECE2017 November 3-9, 2017, Tampa, Florida, USA
IMECE2017-72113
EXPERIMENTAL VISUALIZATION AND NUMERICAL SIMULATION OF LIQUID-GAS TWO-PHASE FLOWS IN A HORIZONTAL PIPE Milad Darzi Department of Mechanical and Aerospace Engineering, University of Missouri Columbia, MO, USA
Chanwoo Park Department of Mechanical and Aerospace Engineering, University of Missouri Columbia, MO, USA
ABSTRACT This paper presents the results of both visualization experiment and numerical simulation for two-phase (water-air mixture) flows in a horizontal tube. A visualization experimental setup was used to observe various two-phase flow patterns for different flow rates of water/air mixture flow in a glass tube of 12 mm in diameter. Total of 303 experimental data points were compared with Mandhane’s flow map. Most of the data for stratified, plug and slug flows were found to be in good agreement. However, annular flow was observed for relatively lower gas flow rates and also wavy flow occurred at relatively higher liquid flow rates in this experiment. A three-dimensional Computational Fluid Dynamics (CFD) simulation was performed using OpenFOAM employing “interFoam” as the solver to simulate the two-phase flows in horizontal pipe based on Volume-Of-Fluid (VOF) method.The simulated and experimentally observed flow patterns for the same set of superficial velocities shows acceptable similarities for stratified, wavy, plug, slug and annular flows. Also, the computed values of the void fraction and pressure drop for the numerical simulations shows reasonable agreement with well-known correlations in literature.
t time [s] U velocity vector [m/s] u velocity magnitude [m/s] V volume [m3] x vapor quality [-] Greek letters α phase volume fraction [-] void fraction [-] σ surface tension [N/m] ρ density [kg/m3] Subscripts compression c f frictional g gas k type of fluid l liquid max maximum n normal x coordinate z coordinate INTRODUCTION Two-phase (liquid-gas) flow inside a pipe is a complicated phenomenon which is dictated by various competing forces such as shear stress, capillarity, gravity and momentum. Such complex conditions gets even more complicated by the continuous movement of the phase interfaces which introduces a destabilizing effect into the flows and causes the changes of temporal and spatial distributions of the phases. Because of the complex characteristics of the liquid and gas flow, the two-phase flow is often classified as a unique flow pattern and presented in a flow-pattern (sometime refers to as “flow-regime”) map. Therefore, the correlations for the pressure drop and heat transfer for two-phase flows should be flow regime-specific for accurate prediction of behaviors of two-phase systems. Horizontal two-phase flow is more complex than vertical two-phase flow, because the flow is not axisymmetric, due to the
NOMENCLATURE A cross-sectional area [m2] curvature [m-1] c Co courant number [-], Co ≡ u∆t/∆x D diameter of the pipe [m] F force [N] f friction factor [-] mass flux [kg/m2s] G g gravity constant [m/s2] J superficial velocity [m/s] L length of the pipe [m] p pressure [pa] Q volumetric flow rate [m3/s] Re Reynolds number [-] r radial distance [mm]
1
Copyright © 2017 ASME
Downloaded From: http://proceedings.asmedigitalcollection.asme.org/ on 01/16/2018 Terms of Use: http://www.asme.org/about-asme/terms-of-use
gravity. Among several flow regime maps reported in literature, Baker’s [1], Mandhane’s [2] and Taitel-Dukler’s [3] maps are recognized as the most cited for horizontal adiabatic gas-liquid flow (for condensing or boiling two-phase flow, the matter is further complicated by the continuous change of the vapor and liquid fractions, which is accompanied by a similar change in the spatial distributions of the phases). Baker’s flow map failed to handle the effect of pipe diameter as most of the data used by Baker was for 25.4 mm pipe [4]. Taitel-Dukler’s map is based on the simplified theoretical model and some of their assumptions has received a great deal of criticism from other researchers [5]. For example, for the transition between annular flow and intermittent flow (plug and slug flow), they simply assumed that when the equilibrium liquid level occupies more than half of the pipe, intermittent flow will happen; otherwise annular flow will develop. However, Lin and Hanratty [6] believe that annular flow is the result of combined effects of entrainment and deposition. Perhaps Mandhane’s flow map is the most commonly accepted for horizontal flows since the wide range of parameter values were used to produce the map. Therefore, in the present study, Mandhane’s flow regime map is used for the comparison of the experimental observations and numerical simulations. Interpretation of two-phase flow patterns is usually subjective and there is no accurate quantitative procedure to describe and classify the flow patterns [7]. The following descriptions are based on the most widely accepted classifications of the gas-liquid two-phase flows in a horizontal tube:
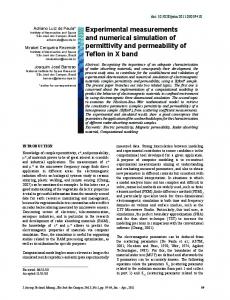
Unlike the plug flow, in which the elongated bubbles are transported by the liquid phase, in the slug flow, the liquid slugs are carried by the faster moving gas flow. It is worth mentioning that the slug flow regime is highly undesirable in practical application. The fast moving liquid slugs are usually associated with sudden pressure pulses and severe pressure oscillations that can cause damage to downstream components [5]. (e) Annular flow: This flow is momentum-dominant and occurs at relatively high gas flow rates. As shown in Fig. 1(e), the liquid forms a continuous film around the perimeter of the tube wall and gas flows as a central core and entrains small droplets of liquid dispersed in the form of mist. Small bubbles of gas may also be entrained in the liquid film. The thickness of liquid film is higher at the bottom of the pipe due to gravity effect. It is worth mentioning that this flow regime is associated with relatively higher heat transfer coefficient in flow boiling or condensation. (f) Bubbly flow: This flow regime takes place at very high liquid flow rates. As shown in Fig. 1(f), gas bubbles are dispersed in a continuous liquid phase. The bubbles are relatively small in comparison with the tube diameter and tend to rise to the top of the pipe due to buoyancy force. However, when the liquid velocity is high enough, shear forces are dominant and uniform distribution of bubbles occur in the pipe. This flow regime is really a separate category. (a) to (e) can be obtained by simply increasing Jg at the same Jl, which is just the opposite of how the bubbly flow is obtained.
(a) Stratified flow: The gas flows along the upper part of the horizontal pipe whereas the liquid travels along the bottom with no significant interfacial waves. This flow is gravity dominant and occurs at relatively low gas and liquid flow rates. As can be seen in Fig. 1(a), this flow has the simplest configuration of all the horizontal flow patterns and sometimes referred to as “stratified smooth” flow pattern. (b) Wavy flow: As the gas velocity increases in stratified flows, the shear forces of the gas flow over the liquid cause ripples on the gas-liquid interface resulting in the formation of waves. The waves climb up the sides of the pipe but usually do not touch the top side of the pipe wall and the liquid layer at the bottom of the channel starts to stretch thin [Fig. 1(b)]. This flow is sometime referred to as “stratified wavy” flow pattern. (c) Plug flow: As shown in from Fig. 1(c), elongated gas bubbles in bullet-shaped and liquid plugs appear alternatively on top of the pipe. The diameter of the elongated bubbles are smaller than the tube dimeter which allows for a continuous liquid phase to appear on the bottom of the pipe. This flow is sometimes referred to as “elongated bubble” flow pattern [8]. (d) Slug flow: With large amplitude wave or splashes of liquid, ultimately, the waves build up and reach the upper wall of the pipe to form liquid slugs. These liquid slugs are then transported at the higher velocity of the gas [see Fig 1(d)].
FIGURE 1. REPRESENTATIVE TWO-PHASE FLOW PATTERNS IN A HORIZONTAL PIPE. Generally, in two-phase flow, experimental data are the main source of information about the flow behavior as theoretical solutions are either almost impossible due to the complexity or based on many assumptions to make the problems simpler. Therefore, experimental results has been highly appreciated for prediction of two-phase flow behavior. The most common approach to study gas liquid flow patterns is to visualize the two-phase flow through a transparent channel [9-14].
2
Copyright © 2017 ASME
Downloaded From: http://proceedings.asmedigitalcollection.asme.org/ on 01/16/2018 Terms of Use: http://www.asme.org/about-asme/terms-of-use
Because of relatively high cost and practical limitation associated with experiment to study the behavior of two-phase flow, Computational Fluid Dynamic (CFD) is utilized by investigators to simulate multi-phase flow [15-17]. The majority of CFD studies of two-phase flow have typically been focused on commercial software such as ANSYS Fluent and ANSYS CFX. However, in recent years, OpenFOAM (Open-source Field Operation AND Manipulation) has gained traction as an alternative to the commercial software because of no license cost, automatic parallelization of applications, code customization according to problems and wide range of solvers available [18-22]. There is a growing interest in the use of OpenFOAM both in academic and industrial research [23]. In the first part of this paper, an experimental set-up is discussed which was used to visualize two-phase flow patterns in a horizontal tube. The air and water flow rates were varied to observe and record images of various flow patterns using a camera. The visualized flow patterns were compared with Mandhane’s flow map. In the second part, for a total of 15 predefined flow conditions, flow patterns were computed using OpenFOAM, employing Volume of Fluid (VOF) method. The numerically simulated flow patterns were compared with the experimental results for the same superficial velocities. Also, the computed values of void fraction and pressure drop obtained from the CFD simulations were compared against available correlations in literature.
recorded by a Nikon D7100 digital camera with a Nikkor 67mm lens at 1,000 fps. A white diffusion screen was placed behind the glass tube as background with an indirect lighting system consisting of two ultra-bright LED (light emitting diode) strips with diffuser covers. Wide ranges of superficial velocities of liquid (JL=0.1 ~ 1.2 m/s) and gas (JG=0.3 ~ 12.5 m/s) were achieved to cover various two-phase flow patterns. The superficial velocities of liquid and gas phases are defined as: Q (1) J l, l
A Qg , Jg A
(2)
where Ql and Qg are the liquid and gas volumetric flow rates respectively and A is the cross-sectional area of the pipe. According to the uncertainty analysis using Engineering Equation Solver (EES), the uncertainties of Jl and Jg did not exceed 7.2% and 9.5%, respectively.
VISUALIZATION EXPERIMENTS A schematic diagram of the overall experimental setup is shown in Fig. 2. The test section is a straight glass tube with 12 mm I.D. and 1 m length (length to diameter ratio of 84). Tube diameter has an uncertainty of ±0.2 mm provided by the manufacturer. The glass tube was selected to facilitate the flow visualization and the test section was carefully leveled to eliminate the effect of inclination. A centrifugal pump with the maximum flow rate up to 9.7 GPM provides different water flow rates. A rotameter with a range of 0.2 ~ 2 GPM and with an accuracy of ± 2% of full scale was used to measure the volumetric flow rate of water. Compressed air was introduced along with the water into a mixer to create two-phase mixture flows at various flow rates and then the two-phase mixture went through the test section of the glass pipe. Two parallel air flow meters having different ranges of 2 ~ 25 LPM and 10 ~ 100 LPM with an accuracy of ± 2% of full scale were installed in the compressed air line. Liquid and air flow rates as key experimental parameters were controlled independently to create desirable flow rate combinations. The fluids used in the test loop were air and water. The water is distilled and stored in the reservoir. The visualization experiments were performed at an isothermal and atmospheric condition. The camera was located downstream near the exit of the test section to capture and record fully-developed two-phase flow patterns which helps reduce the effect of inlet conditions of twophase flow. The visualization zone of the test section is150 mm long (67 < L/D < 79). Images of the two-phase flow were
FIGURE 2. SCHEMATIC OF THE EXPERIMENTAL SETUP. Figure 3 depicts the images from the visualization experiments showing various flow patterns such as stratified, wavy, plug, slug and annular flows which were created with different combination of air and water flow rates. Bubbly flow, however, were not observed as this flow pattern occurs at very high liquid flow rates out of the operating ranges of the pump used in this experiment. Figure 4 illustrates the experimental result of a total of 330 observed flow patterns plotted in the Mandhane’s flow map. The measured flow regimes generally match the transition boundaries presented by Mandhane’s flow map. The main deviation from the flow map is that the annular flow was captured at relatively lower gas superficial velocities and also the wavy flow patterns were obtained at relatively higher water flow rates. The possible reasons of such a deviation include: (a) the flow transition from one pattern to another is rather gradual. Thus, the transitional line between different flow patterns should be considered as a zone and not a distinct line. (b) Mandhane’s flow map like other flow maps differs more or less from one another. The difference between flow maps could be attributed to any dissimilarities in experimental setups, and experimental
3
Copyright © 2017 ASME
Downloaded From: http://proceedings.asmedigitalcollection.asme.org/ on 01/16/2018 Terms of Use: http://www.asme.org/about-asme/terms-of-use
more fluids (or phases) are immiscible. For each additional phase that is added to the model, a variable is introduced: the volume fraction of the phase in the computational cell. In each control volume, the volume fractions of all phases sum to unity. The fields for all variables and properties are shared by the phases and represent volume-averaged values, as long as the volume fraction of each of the phases is known at each location. Thus, the variables and properties in any given cell are either purely representative of one of the phases, or representative of a mixture of the phases, depending upon the volume fraction values. In other words, if the kth fluid’s volume in the cell is denoted as αk, the following three conditions are possible: αk =0: The cell is empty (of the kth fluid). αk =1: The cell is full (of the kth fluid). 0< αk 2000): 0.079 (18) fl 0.25 Re l
fg
0.079 0.25 Re g
(19)
where Reynolds number can be calculated from the superficial velocity and is given by
Re
JD
(20)
Note that, the respective densities, superficial velocities and dynamic viscosities of the liquid and gas phases should be used in Eq. (20).
C. EVALUATION OF PRESSURE DROP Muller-Steinhagen and Heck [30] proposed a two-phase frictional pressure drop correlation that is an empirical
8
Copyright © 2017 ASME
Downloaded From: http://proceedings.asmedigitalcollection.asme.org/ on 01/16/2018 Terms of Use: http://www.asme.org/about-asme/terms-of-use
CONCLUSIONS Experimental visualization of non-condensing two-phase (water-air) flow in a horizontal pipe was carried out. The observed flow patterns of stratified, wavy, plug and slug flows were found to be generally consistent with Mandhane’s flow map except annular flow which was observed at relatively lower gas superficial velocities and also wavy flows were obtained for relatively higher water superficial velocities in the experiment. The differences for the annular and wavy flows can be attributed to different experimental conditions (e.g., pipe diameter), complex behavior of two-phase flow near the transition zone and subjective classification of observed flow patterns by researchers. In this study, a 3D model of the half-pipe was developed using OpenFOAM to capture different two-phase flow patterns for various inlet conditions in a horizontal pipe. Experimental and numerical results were generally consistent in the qualitative prediction of flow patterns. Also, the comparison of the void fraction and pressure drop of the simulated cases showed acceptable agreement with the well-known empirical correlations in literature.
FIGURE 10. COMPARISON OF COMPUTED VOID FRACTIONS WITH WOLDESEMAYAT AND GHAJAR’S [29] CORRELATION.
ACKNOWLEDGEMENTS This work was supported by the National Science Foundation CAREER Award (Grant No. 1464504). REFERENCES 1. Baker O., 1953, "Design of pipelines for the simultaneous flow of oil and gas," in Fall Meeting of the Petroleum Branch of AIME: Society of Petroleum Engineers. 2. Mandhane J., Gregory G, and Aziz K., 1974 "A flow pattern map for gas—liquid flow in horizontal pipes," International Journal of Multiphase Flow, 1(4): p. 537553. 3. Taitel Y., and Dukler A., 1976 "A model for predicting flow regime transitions in horizontal and near horizontal gas‐liquid flow," AIChE Journal, 22(1): p. 47-55. 4. Spedding P., and Spence D., 1993 "Flow regimes in two-phase gas-liquid flow," International journal of multiphase flow, 19(2): p. 245-280. 5. Lamari M., 2001 "An Experimental Investigation of Two-Phase (Air-water) Flow Regimes in a Horizontal Tube at Near Atmospheric Conditions," Carleton University Ottawa. 6. Lin P., and Hanratty T., 1987 "Detection of slug flow from pressure measurements," International Journal of Multiphase Flow, 13(1): p. 13-21. 7. Tang C.C.W., 2011 "Study of Heat Transfer in Nonboiling Two-phase Gas-liquid Flow in Pipes for Horizontal, Slightly Inclined, and Vertical Orientations," Doctoral dissertation, Oklahoma State University. 8. Govier G., and Aziz K., 1972, "The flow of complex mixtures in pipes," Vol. 469. New York: Van Nostrand Reinhold.
FIGURE 11. COMPARISON OF COMPUTED PRESSURE DROPS WITH MULLER STEINHAGEN AND HECK’S [30] CORRELATION. Figure 11 indicates the comparison of the pressure drop of the simulated results with the correlation proposed by MullerSteinhagen and Heck [30]. A reasonable agreement is obtained as all of the data points are within an error band of ±20%. From the results, it is clear that the annular flow has the largest pressure drop due to the extremely high gas velocity compared to other flow patterns. However, as it appears in Fig. 11, one data point of the slug flow shows a large pressure drop since this point corresponds to the high velocities of the phases, especially the liquid velocity (see the 9th row of Table 3). Generally, the slug flow happens at wider combinations of the gas and liquid superficial velocities (Fig. 9) in comparison to other flow regimes. Stratified flow corresponds to the low velocity of the both phases which leads to the relatively lower pressure drop as can be seen from Fig. 11.
9
Copyright © 2017 ASME
Downloaded From: http://proceedings.asmedigitalcollection.asme.org/ on 01/16/2018 Terms of Use: http://www.asme.org/about-asme/terms-of-use
9.
10.
11.
12.
13.
14.
15.
16.
17.
18.
de Oliveira L. A., Cunha Filho J. S., Faccini J. L. H., and Su J., 2010 "Visualization of Two-Phase GasLiquid Flow Regimes in Horizontal and SlightlyInclined Circular Tubes," in Proceedings of 13th Brazilian Congress of Thermal Sciences and Engineering (ENCIT 2010). Mastrullo R., Mauro A., Thome J. R., Toto D., and Vanoli G. P., 2012, "Flow pattern maps for convective boiling of CO 2 and R410A in a horizontal smooth tube: experiments and new correlations analyzing the effect of the reduced pressure," International Journal of Heat and Mass Transfer, 55(5): p. 1519-1528. Yang C.Y., and Shieh C.C., 2001, "Flow pattern of air– water and two-phase R-134a in small circular tubes," International Journal of Multiphase Flow, 27(7): p. 1163-1177. Coleman J.W., and Garimella S., 2003, "Two-phase flow regimes in round, square and rectangular tubes during condensation of refrigerant R134a," International Journal of Refrigeration, 26(1): p. 117128. Mohseni S., Akhavan-Behabadi M.A., and Saeedinia M., 2013 "Flow pattern visualization and heat transfer characteristics of R-134a during condensation inside a smooth tube with different tube inclinations," International Journal of Heat and Mass Transfer, 60: p. 598-602. Jagan V., and Satheesh A., 2016, "Experimental studies on two phase flow patterns of air–water mixture in a pipe with different orientations," Flow Measurement and Instrumentation, 52: p. 170-179. López J., Pineda H., Bello D., and Ratkovich N., 2016, "Study of liquid–gas two-phase flow in horizontal pipes using high speed filming and computational fluid dynamics," Experimental Thermal and Fluid Science, 76: p. 126-134. De Schepper S.C., Heynderickx G.J., and Marin G.B., 2008, "CFD modeling of all gas–liquid and vapor– liquid flow regimes predicted by the Baker chart," Chemical Engineering Journal, 138(1): p. 349-357. Vaze M.J., and Banerjee J., 2010 "Visualization of AirWater Type Two-Phase Flow Patterns," IUP Journal of Mechanical Engineering, 3(3). Herreras N., and Izarra J., 2013 "Two-Phase Pipe Flow Simulations with OpenFOAM," Master’s thesis, Norwegian University of Science and Technology, Norway.
19.
20.
21.
22.
23.
24. 25. 26.
27.
28. 29.
30.
31.
10
Polansky J., Wang M., and Faraj Y., 2015, "Numerical modelling of gas-liquid flow phenomena in horizontal pipelines," in Leeds Proceedings. Shuard A.M., Mahmud H.B., and King A.J., 2016, "Comparison of Two-Phase Pipe Flow in OpenFOAM with a Mechanistic Model. in IOP Conference Series," Materials Science and Engineering, IOP Publishing. Thaker J.P., and Banerjee J., 2013, "CFD simulation of two-phase flow phenomena in horizontal pipelines using openfoam," in Proc. 40th Nat. Conf. on Fluid Mech. & Fluid Power. Vershinin V.E., Ganopolsky R.M., and Polyakov V.O., 2015, "Numerical modeling of two-dimensional gasliquid flow structures," Modern Applied Science, 9(2): p. 236. Jasak H., 2009, "OpenFOAM: open source CFD in research and industry," International Journal of Naval Architecture and Ocean Engineering, 1(2): p. 89-94. Weller H., 2010, "OpenFOAM: The Open Source CFD Toolbox User Guide." Guide A.F.U., November, 2011, "Release 14.0, ANSYS," Inc., USA. Brackbill J., Kothe D.B., and Zemach C., 1992, "A continuum method for modeling surface tension," Journal of computational physics, 100(2): p. 335-354. Hänsch S., Lucas D., Höhne T., Krepper E., and Montoya G., 2013, "Comparative simulations of free surface flows using VOF-methods and a new approach for multi-scale interfacial structures," in Proceedings of the ASME 2013 Fluids Engineering Division Summer Meeting. Yeoh G.H., and Tu J., 2009, "Computational techniques for multiphase flows," Elsevier. Woldesemayat M.A., and Ghajar A.J., 2007, "Comparison of void fraction correlations for different flow patterns in horizontal and upward inclined pipes," International journal of multiphase flow, 33(4): p. 347370. Müller-Steinhagen H., and Heck K., 1986, "A simple friction pressure drop correlation for two-phase flow in pipes." Chemical Engineering and Processing: Process Intensification, 20(6): p. 297-308. Tribbe C., and Müller-Steinhagen H., 2000, "An evaluation of the performance of phenomenological models for predicting pressure gradient during gas– liquid flow in horizontal pipelines," International Journal of Multiphase Flow, 26(6): p. 1019-1036.
Copyright © 2017 ASME
Downloaded From: http://proceedings.asmedigitalcollection.asme.org/ on 01/16/2018 Terms of Use: http://www.asme.org/about-asme/terms-of-use