polymers Article
Numerical Simulation and Experimental Investigation of the Viscoelastic Heating Mechanism in Ultrasonic Plasticizing of Amorphous Polymers for Micro Injection Molding Bingyan Jiang 1 , Huajian Peng 1 , Wangqing Wu 1, *, Yunlong Jia 1,2 and Yingping Zhang 1 1
2
*
State Key Laboratory of High Performance Complex Manufacturing, Central South University, Changsha 410083, China;
[email protected] (B.J.);
[email protected] (H.P.);
[email protected] (Y.J.);
[email protected] (Y.Z.) Institute of Polymer Composites, Hamburg University of Technology, Denickestrasse 15, Hamburg D-21073, Germany Correspondence:
[email protected]; Tel.: +86-158-7429-5500
Academic Editor: Martin Kröger Received: 24 March 2016; Accepted: 10 May 2016; Published: 17 May 2016
Abstract: Ultrasonic plasticizing of polymers for micro-injection molding has been proposed and studied for its unique potential in materials and energy-saving. In our previous work, we have demonstrated the characteristics of the interfacial friction heating mechanism in ultrasonic plasticizing of polymer granulates. In this paper, the other important heating mechanism in ultrasonic plasticizing, i.e., viscoelastic heating for amorphous polymer, was studied by both theoretical modeling and experimentation. The influence mechanism of several parameters, such as the initial temperature of the polymer, the ultrasonic frequency, and the ultrasonic amplitude, was investigated. The results from both numerical simulation and experimentation indicate that the heat generation rate of viscoelastic heating can be significantly influenced by the initial temperature of polymer. The glass transition temperature was found to be a significant shifting point in viscoelastic heating. The heat generation rate is relatively low at the beginning and can have a steep increase after reaching glass transition temperature. In comparison with the ultrasonic frequency, the ultrasonic amplitude has much greater influence on the heat generation rate. In light of the quantitative difference in the viscoelastic heating rate, the limitation of the numerical simulation was discussed in the aspect of the assumptions and the applied mathematical models. Keywords: micro injection molding; ultrasonic plasticizing; viscoelastic heating; numerical simulation
1. Introduction Polymer plasticizing with ultrasonic energy and directly injection molding with ultrasonic sonotrode has been proposed especially for micro-sized parts in fields like electronics, medicine, or biotechnology [1–5]. The method is also called ultrasonic micro-molding, which has been developed for its unique potential in materials and energy saving [6,7]. In comparison with traditional micro injection molding, over 90% of the polymer can be saved by plasticizing just the small amount of polymer just as required for micro-sized parts [6]. This could be a significant cost factor for micro-molded parts, especially in the case of engineering polymers used for high-performance applications. Another advantage of ultrasonic micro-molding is that external heating for the plasticizing chamber and the mold could be spared due to the propagation of the energetic ultrasound in the molten material [6].
Polymers 2016, 8, 199; doi:10.3390/polym8050199
www.mdpi.com/journal/polymers
Polymers 2016, 8, 199
2 of 12
Despite some advantages over conventional micro-injection molding, the potential applications of ultrasonic micro-molding are still limited [5–7]. This could be related to the complexity of the ultrasonic micro-molding process which is still under development. One of the challenges of ultrasonic micro-molding process that has been confronted has been the plasticizing of just a small amount polymer as required. The plasticizing quality of the molten material could be very sensitive under concentrated ultrasonic energy in a very short time. Uneven plasticization and even polymer degradation have occurred very often due to improper handling [5–7]. To achieve controllable ultrasonic micro-molding, the characteristics and mechanisms of ultrasonic plasticizing have to be understood. According to Michaeli et al. [1–4] there are two types of heat generation mechanisms, i.e., the interfacial friction heating and the viscoelastic heating in ultrasonic plasticizing process. In our previous work [5], the interfacial friction heating of polymer granulates has been studied by numerical simulation and experimentation. It was found that the polymer interfacial heating occurs and lasts only until the interfaces disappear, meaning that it acts only at the initial stage of ultrasonic the plasticizing process. In other words, the viscoelastic heating might be the predominant heat generation mechanism for ultrasonic polymer plasticizing. However, as a new concept for polymer plasticizing in micro-molding, the mechanism that can clearly explain the viscoelastic heating effect has been rarely reported. On the contrary, extensive modeling efforts have been made to simulate the ultrasonic polymer welding process [8–14]. Both interfacial friction and volumetric viscoelastic heating were taken into consideration in the modeling. It was confirmed that the temperature increase at the welding interface can be attributed to the combined action of interfacial friction and viscoelastic heating and that the viscoelastic heating effect plays a major role in ultrasonic polymer welding. Unlike the heat generated in ultrasonic polymer welding which is mainly confined to the interface area, the heat generated in ultrasonic polymer plasticizing should be released and transferred to melt the polymer in the whole chamber. This could be a significant difference for process modelling. In addition, modelling efforts were mainly concentrated on the temperature distribution in ultrasonic polymer welding for different materials and joint designs [10]. For the quantitative characterization of the viscoelastic heating and the influence mechanism of the process parameters, however, there has been only a very few literature report for the case of both ultrasonic welding [10,13,14] and ultrasonic plasticizing [5]. Therefore, the objective of this work is to study the characteristics and mechanisms of viscoelastic heating in ultrasonic plasticizing by both theoretical modeling and experimentation. The viscoelastic heating phenomenon was modeled on the basis of several models including the generalized Maxwell model, the Arrhenius and semi-empirical WLF models [11,12,15,16], which was solved numerically by the commercial FEM software ANSYS. The heat generation rate was calculated and measured quantitatively. The influence mechanism of the initial temperature of the polymer, the ultrasonic amplitude, and the ultrasonic frequency on the heat generation rate were studied. 2. Theoretical Modeling 2.1. Problem Description In ultrasonic polymer plasticizing, polymer in granulate form is compacted under a certain pressure and plasticized by the sonotrode under ultrasonic vibration as shown in Figure 1. The interfacial friction heating involves surface friction among granulates and between granulates and the wall. The viscoelastic heating is related to the deformation of polymer granulates under ultrasonic vibration. The combined action of the interfacial friction heating and viscoelastic heating leads to a polymer phase change from glassy state to rubbery state. After that, a polymer melt with good flowability could be acquired due to the ultrasonic cavitation and acoustic streaming effect. In our previous work [5], the characteristics and mechanisms of the interfacial friction heating has been investigated. It was found that the interfacial friction heating occurs and lasts only until the interfaces disappear, meaning that it acts only at the initial stage of the ultrasonic plasticizing process. After that,
Polymers 2016, 8, 199
3 of 12
Polymers 2016, 8, 199
3 of 12
the volumetric viscoelastic heating is dominant. The scope of this research is to promote understanding Polymers 2016, 8, 199 heating mechanism in ultrasonic plasticizing. 3 of 12 on the viscoelastic
Figure 1. Schematic diagram of heating effects during ultrasonic polymer plasticizing.
2.2. Theoretical Modeling Figure 1. Schematic diagram of heating effects during ultrasonic polymer plasticizing. 2.2. Theoretical Theoretical Modeling 2.2.1. Physical model 2.2. Modeling ultrasonic polymer plasticizing, the stress field in the polymer granulates is usually uneven 2.2.1.InPhysical model and complex. To simplify the problem, the loading conditions of a micro unit cell in a polymer In ultrasonic polymer plasticizing, the field in that the polymer polymer granulates usually uneven the granulates usually uneven granulate is simplified as shown in Figure 2. stress It is assumed the micro-unit cell is is loaded with ideal To simplify the problem, the loading conditions of a micro unit cell and complex. Tostress simplify the problem, the loading conditions of in a polymer uniaxial normal , which is a sine function with the same frequency as the ultrasonic σ (t ) 2. 2. It isItassumed thatthat the micro-unit cell is loaded with ideal granulate is is simplified simplifiedas asshown shownininFigure Figure is assumed the micro-unit cell is loaded with vibration. After being compacted by the plasticizing pressure and heated by the initial interfacial uniaxial normal stress , which is a sine function with the same frequency as the ultrasonic ideal uniaxial normal stress ultrasonic σ ( t )σ ptq, which is a sine function with the same frequency as friction, the polymer granulates are assumed to form a homogeneous bulk cylinder without having vibration. After being compacted by the plasticizing pressure and heated by the initial interfacial vibration. After being to compacted by the plasticizing pressure and heatedhas by athe initial interfacial internal imperfections facilitate the research. The polymer bulk cylinder diameter of 10 mm friction, the polymer granulates are assumed to form aa homogeneous bulk cylinder without having friction, the polymer granulates are assumed to form homogeneous bulk cylinder without having and a height of 5 mm and is cyclically loaded by the ultrasonic sonotrode as shown in Figure 3. internal imperfections to facilitate the research. The polymer bulk cylinder has a diameter of 10 mm and internal imperfections to facilitate research. The polymer cylinder diameter vibration. of 10 mm The cyclic load is assumed to havethe the same amplitude and bulk frequency as has the aultrasonic aand height of 5 mm and is and cyclically loaded by the ultrasonic sonotrode as shownas in shown Figure 3. cyclic height of 5polymer mm is cyclically loaded by theheated ultrasonic inThe Figure 3. As aaresult, the cylinder is supposed to be due sonotrode to the viscoelastic nature of the load is assumed to assumed have the same amplitude and frequencyand as the ultrasonic vibration. As a result, the The cyclic load is to have the same amplitude frequency as the ultrasonic vibration. polymer material. polymer cylinder is supposed to be heated due totothe nature the polymernature material. As a result, the polymer cylinder is supposed beviscoelastic heated due to theofviscoelastic of the polymer material.
Figure 2. Simplified loading conditions of a micro-unit cell in a polymer granulate. Figure 2. Simplified loading conditions of a micro-unit cell in a polymer granulate.
Figure 2. Simplified loading conditions of a micro-unit cell in a polymer granulate.
Polymers 2016, 8, 199
4 of 12
Polymers 2016, 8, 199 Polymers 2016, 8, 199
4 of 12 4 of 12
Figure 3. Simplified viscoelastic heating model in ultrasonic plasticizing.
2.2.2. Mathematical Modeling
Figure 3. 3. Simplified Simplified viscoelastic viscoelastic heating heating model model in in ultrasonic ultrasonic plasticizing. plasticizing. Figure
Figure 4 illustrates a typical stress–strain curve of polymer material in a vibration cycle. A 2.2.2. Mathematical Modeling hysteresis loop is formed due to the non-coincidence of the loading and unloading curves. The area 2.2.2. Mathematical Modeling of theFigure hysteresis loop is the work done by the ultrasonicofsonotrode against theininternal friction of the a vibration cycle. A Figure 44 illustrates illustrates aa typical typical stress–strain stress–straincurve curve ofpolymer polymermaterial material in a vibration cycle. macromolecular segments in a single vibration cycle. Hence, the heat generation of the micro unit cell hysteresis loop is formed due to the non-coincidence of the loading and unloading curves. The area A hysteresis loop is formed due to the non-coincidence of the loading and unloading curves. The area per unit of time isloop given by: work done by the ultrasonic sonotrode against the internal friction of the of the the hysteresis is the the of hysteresis loop is work done by the ultrasonic sonotrode against the internal friction of the 2 π/ω macromolecular segments in single vibration vibration cycle. Hence, Hence, the the heat heat generation generation of of the the micro micro unit unit cell cell macromolecular segments in aa single cycle. Q = f σ( t ) d ε( t ) = f σ ε ω sin ω t cos ω t − δ dt = f πσ ε sin δ ( ) per unit of time is given by: (1) 0 0 0 0 per unit of time is given by:
0 2 π/ω
Q = f ¿ σ(t ) dε(t ) = fσ 0 ε 0 ω2πż{ωsin ωt cos ( ωt − δ ) dt = fπσ 0 ε 0 sin δ (1) is the vibration frequency, σ and ε0 are, respectively, the amplitude of the stress and Q “ f σptqdεptq “ f σ0 ε00 ω 0 sinωtcos pωt ´ δq dt “ f πσ0 ε0 sinδ (1) strain, δ is the lag angle of the strain, and ω0 is the angular frequency of the sonotrode. frequency, and ε0 number are, respectively, amplitude of theofstress and where, f is the vibration By expressing the stress and strainσ in0 complex form, the the complex modulus polymer where, f is the vibration frequency, σ0 and ε0ωare, respectively, the amplitude of the stress and strain, can be simplified as: strain, δ is the lag angle of the strain, and is the angular frequency of the sonotrode. δ is the lag angle of the strain, and ω is the angular frequency of the sonotrode. By expressing the stress and strain number form, the complex modulus of polymer σ in complex number By expressing the stress and the'' complex modulus of polymer E *strain E ' + iE = 0in complex can be simplified as: ( cos δ + i sin δ ) =form, (2) ε can be simplified as: ˆ 0 ˙ σ0 1 ` (2) E˚* = “ σ 0'' (pcosδ ' i modulus. sin δ “ + isinδq ) =EE`' +iEiE2 '' (2) Eε0 is cos with E is the storage modulusE and the δloss
where, f
''
ε0
2 is = σ0 sinδ/ε Equation the heat generation rate Q can be reformulated substituting with By E1 is the storage E modulus and0Ein the loss (1) modulus. ' '' 2 “ with is the storage modulus and is the loss modulus. E E By substituting E σ sinδ{ε in Equation (1) the heat generation rate Q can be reformulated as: 0 0 as:
By substituting as:
E'' = σ0 sinδ/ε0
in Equation (1) the heat generation rate Q“ Q = ffπε πε0 22EE2 '' 0
Q
can be reformulated (3) (3)
According (3),(3), it can be deduced that the heating heating is relatedistorelated the ultrasonic According totoEquation Equation it can be deduced that the viscoelastic to the 2 viscoelastic (3) Q = fthe πε0polymer E '' of thematerial. frequency, the amplitude and the lossand modulus ultrasonic frequency, the amplitude the lossofmodulus polymer material.
According to Equation (3), it can be deduced that the viscoelastic heating is related to the ultrasonic frequency, the amplitude and the loss modulus of the polymer material.
Figure curve of of polymer polymer material material in in aa vibration vibration cycle. cycle. Figure 4. 4. Typical Typical stress-strain stress-strain curve Figure 4. Typical stress-strain curve of polymer material in a vibration cycle.
Polymers 2016, 8, 199
5 of 12
Considering the attenuation of the ultrasonic amplitude in the propagation direction, the solution of the ultrasonic wave function in the polymer bulk cylinder (see Figure 3) is given by [17,18]: ´ z¯ u U pz, tq “ U0 e´αz ˆ exptiω t ´ c
(4)
where U is the vibration amplitude, c is the propagation speed of sound, z is the distance to sonotrode, and α is the attenuation factor which is given by: ωtanδ ωE2 α“ z “ ωz 1 c E
c
ρ E1
(5)
Combining Equations (3)–(5) gives the heat generation rate considering the ultrasonic attenuation: Qpzq “ f ε0 2 expt
´2E2 ωz 2 b uE E1 Eρ1
(6)
The modulus of polymers can be influenced by both temperature and loading frequency. For the polymers under low frequency loading, the loss modulus can be measured by dynamic mechanical analysis. For the polymer under high-frequency loading such as the ultrasonic vibration, however, the loss modulus can only be acquired by deducing with the Time-Temperature-Superposition method [19–21]. To this end, the complex modulus as a function of temperature and frequency is described by the generalized Maxell model: E˚ “
n n ÿ ÿ Ej ω2 τj 2 Ej ωτj ` i 2 2 1 ` ω τj 1 ` ω2 τj 2
j“1
(7)
j “1
where j is the generalized Maxwell order number, Ej and τj are, respectively, the static relaxation modulus and the relaxation time of corresponding Maxwell unit, and ω is the angular frequency of external loading. The relaxation time is calculated using Arrhenius [11] and semi-empirical WLF equation [15,16]: H
1
1
τj pTq “ 10 2.303R p T ´ Ts q ˆ τj pTs q τj pTq “ 10
´C1 pT´Ts q C2 `T´Ts
T ď Tg
(8)
Tg ă T ď Tg ` 60
ˆ τj pTs q
with τT and τs being, respectively, the relaxation time at an arbitrary temperature T and the reference temperature Ts , H is the activation energy, R is the molar gas constant, C1 and C2 are constants. By Equations (6)–(8) the viscoelastic heating rate as a function of frequency and temperature is given by: 2
E
Q pT, ω, zq “
E1
2 f πε 0 2 expt ´2Eb ωz u ρ E1 E1
H
p1´ 1 q T Ts ˆτ p T q j 0 2H p 1 ´ 1 q 2 2.303R T T s ˆτj 2 pT0 q j“1 1`ω 10 ´C1 pT´Ts q n Ej ω10 C2 `T´Ts ‚τj pT0 q ´2C1 pT´Ts q j“1 1`ω 2 10 C2 `T´Ts ‚τ 2 pT q 0 j
b ωz u Q pT, ω, zq “ f πε0 2 expt ´2E ρ 1
n ř
Ej ω10 2.303R
ř
T ď Tg (9) Tg ă T ď Tg ` 60
2.2.3. Numerical Simulation The governing differential equation to be solved is: ρCpTq
B2 T B2 T B2 T BT “ kx 2 ` ky 2 ` kz 2 ` QpT, z, ωq Bt Bx By Bz
(10)
Polymers 2016, 8, 199
6 of 12
where ρ is density, CpTq is specific heat capacity as a function of temperature T, t is time, kx , ky , and kz are, respectively, heat conductivity in coordinate directions. Equation (10) can be numerically solved by the heat analysis module in commercial FEM software ANSYS. To this end, the polymer bulk cylinder (see Figure 3) was modeled in ANSYS and meshed by SOLID90 element. The viscoelastic heating rate under certain frequency is defined as a function of the node temperature T and the node coordinate z. By applying suitable assumptions, material properties, and initial and boundary conditions, the numerical solution of the temperature T as a function of time in Equation (10) was obtained by time dependent heat analysis. ‚
Assumptions (1) (2) (3) (4) (5)
‚
Material properties (1) (2) (3)
‚
The material applied in the model is amorphous poly(methyl methacrylate) (PMMA) which has a glass transition temperature of 105 ˝ C and a viscos flow temperature of 160 ˝ C. The relaxation modulus and relaxation time of the generalized Maxwell model at a reference temperature of 105 ˝ C is defined according to [12]. The activation energy H and the constants C1 and C2 in Equation (8) are defined as 335 KJ/mol, 17.6, and 65.5, respectively, according to [15].
Initial conditions (1) (2)
‚
The heat exchange between the model and the environment is natural convection. The contact between the sonotrode and the polymer cylinder stays unchanged during vibration due to the constant plasticizing pressure. The density of the polymer bulk cylinder is assumed to be constant during viscoelastic heating to simplify the numerical simulation. The heat generated by the sonotrode during ultrasonic plasticizing is neglected to focus on the polymer internal heat generation by viscoelastic heating. The possible energy leak from the sensor insertion is neglected because the ultrasonic plasticizing is a transient process which usually lasts only a few seconds.
For the study on the influence of the initial temperature of polymer on the viscoelastic heating, the initial temperature of the polymer was defined as 30, 96, and 100 ˝ C, respectively. For the study on the influence of the ultrasonic amplitude and frequency on the viscoelastic heating, the initial temperature was defined as 100 ˝ C.
Boundary conditions (1) (2)
(3)
(4)
(5)
The environment temperature is 25 ˝ C. There is thermal radiation to environment during viscoelastic heating which was considered by applying the convection and radiation heat transfer coefficient which is defined as 16 W/m2 ¨ ˝ C. For the study on the influence of the initial temperature of polymer on the viscoelastic heating, the vibration frequency and amplitude at the end of the sonotrode were defined as 20 kHz and 40 µm, respectively. For the study on the influence of ultrasonic frequency on the viscoelastic heating, a vibration frequency sweep from 15 to 30 kHz with a step of 5 kHz and an amplitude of 40 µm were set up for the end of the sonotrode. For the study on the influence of ultrasonic amplitude on the viscoelastic heating, a vibration amplitude sweep from 20 to 50 µm with a step of 10 µm and a vibration frequency of 20 kHz were set up for the sonotrode.
Polymers 2016, 8, 199
7 of 12
3. Experimentation 3.1. Materials A polymethyl methacrylate (PMMA) bar with a diameter of 10 mm was purchased for the viscoelastic heating experiment. The material properties are shown in Table 1. Table 1. Material properties of PMMA. Density [Kg/m3 ]
Heat conduction coefficient [W/m¨ ˝ C]
Specific heat capacity [J/Kg¨ ˝ C]
Glass transition temperature [˝ C]
E-modulus [GPa]
Poisson’s ratio
1,166
0.18
1,828
105
3.3
0.345
3.2. Ultrasonic Plasticization System Table 2 indicates the main technical data of the self-developed ultrasonic plasticization system which was used for the viscoelastic heating experiment. It should be clarified that the frequency and the amplitude ranges in numerical simulation may out of what are shown in Table 2. This can be related to the resonance characteristics of the ultrasonic vibration. There are usually only one resonance frequency for a certain ultrasonic vibration system. The experimentation could be too expensive if the frequency and amplitude ranges in the numerical simulation were all covered. Therefore, the frequency and amplitude were chosen according to the numerical simulation results, related open literature [5–7], and the research budget. Table 2. Technical data of the ultrasonic plasticization system. Parameter
Power (W)
Frequency (kHz)
Amplitude (µm)
Pressure (Mpa)
Value
0–500
20
0–30
0–30
3.3. Methodology To focus on the volumetric viscoelastic heating effect, the influence of the interfacial friction heating should be excluded to avoid uneven plasticization. In addition, an ultrasonic amplitude range from 0–30 um, which is narrower than the one applied in the numerical modeling, was chosen to avoid polymer degradation [5–7]. Instead of polymer granulates, a long PMMA bar which was cut into several bulk cylinders with the same size as indicated in Section 2.2.1 was used in the experimentation. Each bulk cylinder was used only for one experiment. As illustrated in Figure 5, a micro-temperature sensor with a probe diameter of 0.1 mm and a response time of 50 ms (Omega, 5TC-TT-K-40-36, Stamford, CT, USA) was inserted into the PMMA bulk cylinder to measure the internal temperature rise under ultrasonic vibration. As the overall temperature of the sample is not evenly distributed due to the attenuation of the ultrasonic vibration, the temperature sensors was tailored to the same embedded location among the bulk cylinders. Specifically, the embedded location of the temperature sensor was 2 mm below the upper surface of the bulk cylinder. The measurements were conducted under various conditions referring to the initial and boundary conditions in Section 2.2.3 and compared with the calculated results from numerical modeling.
Polymers 2016, 8, 199 Polymers 2016, 8, 199
8 of 12
8 of 12
Polymers 2016, 8, 199
8 of 12
Figure5.5.Schematic Schematicdiagram diagram of viscoelastic viscoelastic heat method. Figure heattemperature temperatureacquisition acquisition method. Figure 5. Schematic diagram of viscoelastic heat temperature acquisition method.
Results and and Discussion Discussion 4. 4Results
4 Results and Discussion
Influenceofofthe theInitial InitialTemperature TemperatureofofPolymer Polymer 4.1.4.1. Influence 4.1.The Influence of the Initial Temperature of indicate Polymer numerical simulation results can bebe significantly The numerical simulation results indicate that that the the viscoelastic viscoelasticheating heatingrate rate can significantly influenced by the initial temperature of polymer. It is quite obvious that there is a distinct transition of Thebynumerical results indicate that viscoelastic rate is can be significantly influenced the initialsimulation temperature of polymer. It isthe quite obviousheating that there a distinct transition ofinfluenced the viscoelastic heating rate below and above the glass transition temperature as shown the initial polymer. It is quite obvioustemperature that there is aasdistinct the viscoelasticbyheating ratetemperature below andofabove the glass transition showntransition in Figure in 6a,b. Figure For an initial temperature the glass temperature, thereas is shown only a slight of the6a,b. viscoelastic heating rate belowbelow and above the transition glass transition temperature in For an initial temperature below the glass transition temperature, there is only a slight increment of Figure 6a,b. For an initial temperature below the glass transition temperature, thereinisFigure only a6a. slight increment of viscoelastic heating rate with increasing initial temperature as shown When viscoelastic heating rate with increasing initial temperature as shown in Figure 6a. When the initial increment of viscoelastic rate increasing temperature as shown in Figure 6a. When the initial temperature of heating polymer is with increased frominitial 30 to 96 °C, the average heating rate has only a temperature of polymer of is polymer increased from 30 from to 9630˝ C, the°C,average heating rate has only aa slight the initial temperature is increased to 96 the average heating rate has only slight increment of 0.4 °C/s in 5 s. This can be attributed to the very low loss modulus of the glassy increment of 0.4 ˝ C/s in 5°C/s s. This5 s. can be can attributed to thetovery low low loss modulus of the glassy state of slight of 0.4 This be attributed the very modulus the glassy state of increment the polymer, furtherinlead to very low viscoelastic heating rate loss according to of Equation (3) as theillustrated polymer, further lead to very low heating heating rate according to Equation (3) as(3) illustrated state of the polymer, further lead to viscoelastic very low viscoelastic rate according to Equation as in Section 2.2.2. in Section 2.2.2. illustrated in Section 2.2.2.
(a) (a)
(b)(b)
Figure6.6.Simulated Simulatedviscoelastic viscoelastic heating heating curve atatvarious initial temperatures, (a) (a) Initial Figure curve of of PMMA initial temperatures, Initial Figure 6. Simulated viscoelastic heating curve ofPMMA PMMA atvarious various initial temperatures, (a) Initial temperature of 30 and 96 °C; (b) Initial temperature of 100 °C. temperature of 30 and 96 °C; (b) temperature of 100 °C. ˝ ˝ temperature of 30 and 96 C; (b) Initial temperature of 100 C.
Whenthe theinitial initialtemperature temperature of of polymer 100 °C,°C, there is still no no significant When polymerisisfurther furtherincreased increasedtoto 100 there is still significant ˝100 When the initial temperature of polymer is further increased to 100 C, there is still noabout significant improvement in the viscoelastic heating rate. The average heating rate from to 105 °C is 2.4 2.4 improvement in the viscoelastic heating rate. The average heating rate from 100 to 105 °Cabout is ˝up °C/s. With the temperature increases up to 105 °C, a steep increase of the average heating rate to about improvement in the viscoelastic heating rate. The average heating rate from 100 to 105 C °C/s. With the temperature increases up to 105 °C, a steep increase of the average heating rate is up to ˝ ˝ 64.8 °C/s was determined from 105 to 150 °C. This can be ascribed to the significantly increased loss 2.464.8 C/s. temperature toThis 105 can C, be a steep increase the averageincreased heating rate °C/sWith wasthe determined fromincreases 105 to 150up °C. ascribed to theofsignificantly loss up modulus during the glass transition rate 150 °C was found to ˝ C/s was to modulus 64.8 determined from 105of toPMMA. 150 ˝ C.The Thisaverage can beheating ascribed to above the significantly increased during the glass transition of PMMA. The average heating rate above 150 °C was found toloss be reduced to a comparative level that is nearly the same as the one below glass transition ˝ modulus during glass transition of PMMA. The average heating rate one above 150 glass C wastransition found to be be reduced to the a comparative level that is nearly the same as the below temperature. This means that the viscoelastic heating is only highly active in the temperature range temperature. This meanslevel that the heating active in the temperature range reduced to a comparative thatviscoelastic is nearly the sameisasonly the highly one below glass transition temperature. between 105 and 150 °C, corresponding to the glass transition range of PMMA. between 105 and 150 °C, corresponding to the highly glass transition range of PMMA. range between 105 and This means that the viscoelastic heating is only active in the temperature The variation of the loss modulus can be further explained by the movement of the polymer variation of to thethe loss modulus can be further explained the movement of theglassy, polymer 150 ˝chain C,The corresponding glass transition range of the PMMA. under different material states. Specifically, polymer by cylinder will undergo chain under different material states. Specifically, the polymer cylinder will undergo glassy, The variation the loss modulus can beplasticizing. further explained by thestate movement of the polymer chain viscoelastic and of rubbery states in ultrasonic For the glassy PMMA the deformation viscoelastic and rubbery statesSpecifically, in ultrasonic plasticizing. For the and glassy state theviscoelastic deformationand of the polymer chain isstates. mainly limited as thethe changes in thecylinder length the anglePMMA of glassy, the intramolecular under different material polymer will undergo ofcovalent the polymer is mainly limitedThe as For the changes in the length and behavior the angle of the intramolecular bond and the lateral motion. material shows typical elastic with inconspicuous rubbery states inchain ultrasonic plasticizing. the glassy state PMMA the deformation of the polymer covalent bond and the lateral motion. The material shows typical elastic behavior with inconspicuous stress-strain hysteresis. Hence, the amount of energy dissipated in the form of heat is negligible and bond chain is mainly limited as the changes in the length and the angle of the intramolecular covalent
stress-strain hysteresis. Hence, the amount of energy dissipated in the form of heat is negligible and and the lateral motion. The material shows typical elastic behavior with inconspicuous stress-strain hysteresis. Hence, the amount of energy dissipated in the form of heat is negligible and the loss
Polymers 2016, 8, 199
9 of 12
modulus is marginal as well. For the viscoelastic state PMMA the macromolecular segments starts Polymers 2016, 8, 199 of 12 Polymers 2016, 8, 199 9 of9 12 to move at temperatures above glass transition temperature and undergo the transformation from the rigid glassy stateistomarginal the soft rubbery state.viscoelastic The amount ofPMMA energy dissipated in form of heat can loss modulus well. state macromolecular segments thethe loss modulus is marginal as as well. ForFor thethe viscoelastic state PMMA thethe macromolecular segments be greatly increased by the significant intermolecular forces, leading to a significantly increased starts move temperatures above glass transition temperature and undergo transformation loss starts to to move at at temperatures above glass transition temperature and undergo thethe transformation modulus. As PMMA enters a rubbery state the macromolecular segments have more from rigid glassy state soft rubbery state. The amount energy dissipated form of heat of from thethe rigid glassy state to to thethe soft rubbery state. The amount of of energy dissipated in in form of freedom heat movement, leading to a decreased amountintermolecular of energy dissipation and to loss modulus. greatly increased significant intermolecular forces, leading to a significantly increased cancan bebe greatly increased byby thethe significant forces, leading a significantly increased loss modulus. PMMA enters a rubbery state macromolecular segments have more freedom loss modulus. AsAs PMMA enters a rubbery state thethe macromolecular segments have more freedom of of
4.2.movement, Influence of the Ultrasonic Frequency movement, leading a decreased amount energy dissipation and loss modulus. leading to to a decreased amount of of energy dissipation and loss modulus.
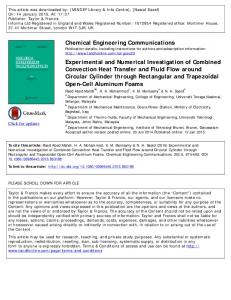
Figure 7 shows the influence of the ultrasonic frequency on the viscoelastic heating rate. It can be Influence of the Ultrasonic Frequency 4.2.4.2. Influence of the Ultrasonic Frequency observed that the viscoelastic heating rate seems to start and end at zero and is only remarkable at the Figure 7 shows influence of the ultrasonic frequency viscoelastic heating rate. It can ˝ C regardless Figure 7 shows thethe influence the150 ultrasonic frequency onon thethe viscoelastic heating It can glass transition range between 105 of and of the ultrasonic frequency. Itrate. should be noted be observed that the viscoelastic heating rate seems to start and end at zero and is only remarkable be observed that the viscoelastic heating rate seems to start and end at zero and is only remarkable that the viscoelastic heating rate seems to start and end at zero is because of the huge difference in glass transition range between and regardless ultrasonic frequency. It should at at thethe glass transition range between 105105 and 150150 °C°C regardless of of thethe ultrasonic frequency. It should the order of magnitude of viscoelastic heating rate. The order ofend magnitude out of theofglass transition be noted that the viscoelastic heating rate seems to start and at zero is because the huge be noted that the viscoelastic heating rate seems to start and end at zero is because of the huge rangedifference is too small to compare with the one in the glass transition range. For all ultrasonic frequencies, order magnitude viscoelastic heating rate. The order magnitude difference in in thethe order of of magnitude of of viscoelastic heating rate. The order of of magnitude outout of of thethe ˝ C, corresponding to the maximum theglass viscoelastic heating rate reaches a maximum at about 125 glass transition range is too small to compare with the one in the glass transition range. For transition range is too small to compare with the one in the glass transition range. For allall lossultrasonic modulus atfrequencies, this pointthe during glass transition. The maximum viscoelastic heating rate increases ultrasonicfrequencies, theviscoelastic viscoelastic heatingrate ratereaches reachesa amaximum maximumat at about125 125°C, °C, heating about corresponding to the maximum loss modulus at this point during glass transition. The maximum with increasing ultrasonic frequency. The maximum viscoelastic heating rate at kHz ultrasonic corresponding to the maximum loss modulus at this point during glass transition. The30maximum viscoelastic heating rate increases with increasing ultrasonic frequency. The maximum viscoelastic viscoelastic heating rate increases with increasing ultrasonic frequency. The maximum viscoelastic frequency is about two times of the one at 15 kHz ultrasonic frequency. However, when observing heating rate at kHz ultrasonic is about two times one kHz ultrasonic rate at curves 30 30 kHz ultrasonic about two times of of thethe one at at 15 15 kHz ultrasonic theheating temperature in Figure 8,frequency itfrequency can beisfound that the ultrasonic frequency has only a limited frequency. However, when observing the temperature curves in Figure 8, it can be found that the frequency. However, when observing the temperature curves in Figure 8, it can be found that the influence on the polymer temperature rise. The polymer temperature has only a steep increase in the ultrasonic frequency only a limited influence on the polymer temperature rise. The polymer ultrasonic frequency hashas only a105 limited influence polymer temperature rise. The polymer ˝ C foron glass transition range between and 150 allthe ultrasonic frequencies. After plasticizing with temperature only a steep increase glass transition range between and temperature hashas only a steep increase in in thethe glass transition range between 105105 and 150150 °C°C forfor allall ˝C an ultrasonic frequency of 30 Hz for 5 s the polymer temperature is only 5.6 higher than the one ultrasonic frequencies. After plasticizing with ultrasonic frequency s the polymer ultrasonic frequencies. After plasticizing with anan ultrasonic frequency of of 30 30 HzHz forfor 5 s5the polymer at 15 temperature Hz. Therefore,only there is°Cnot much meaning to increase the ultrasonic frequency for an increased higher than one Hz. Therefore, there much meaning temperature is is only 5.65.6 °C higher than thethe one at at 15 15 Hz. Therefore, there is is notnot much meaning to to efficiency of ultrasonic plasticizing. increase ultrasonic frequency increased efficiency ultrasonic plasticizing. increase thethe ultrasonic frequency forfor anan increased efficiency of of ultrasonic plasticizing.
Figure 7. Influence of ultrasonic frequency on the viscoelastic heat generation rate.
Figure7.7.Influence Influence of on on the the viscoelastic heat generation rate. rate. Figure ofultrasonic ultrasonicfrequency frequency viscoelastic heat generation
Figure 8. Viscoelastic heating curve of PMMA PMMA atatvarious ultrasonic frequencies. Figure 8.8. Viscoelastic heating curve various ultrasonic frequencies. Figure Viscoelastic heating curve of of PMMA at various ultrasonic frequencies.
Polymers 2016, 8, 199
10 of 12
4.3. Influence of the Ultrasonic Amplitude Polymers 2016, 8, 199 Polymers 2016, 8, 199
10 of 12 10 of 12
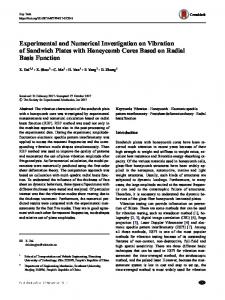
Figure 9 illustrates the viscoelastic heating curve under various ultrasonic amplitudes. It is as 4.3.4.3. Influence of the Ultrasonic Amplitude Influence ofviscoelastic the Ultrasonic Amplitude expected that the heating rate can be significantly influenced by the ultrasonic amplitude. Figure 9 illustrates the viscoelastic heating curve under various ultrasonic amplitudes. is Since the Figure viscoelastic heating is proportional to the square of the strain amplitude asIt indicated in 9 illustrates therate viscoelastic heating curve under various ultrasonic amplitudes. It as is as expected that the viscoelastic heating rate can be significantly influenced by the ultrasonic amplitude. Section 2.2.2. The temperature curves illustrate the same trend but with a huge difference in viscoelastic expected that the viscoelastic heating rate can be significantly influenced by the ultrasonic amplitude. Since the viscoelastic rate is proportional to to thethe square of of thethe strain amplitude as as indicated in in heating rate. It can beheating determined the viscoelastic heating rate at 50 µm ultrasonic amplitude Since the viscoelastic heating rate isthat proportional square strain amplitude indicated Section 2.2.2. The temperature curves illustrate the same trend but with a huge difference in Section 2.2.2. The of temperature theamplitude. same trend Hence, but with huge difference in is nearly eight times the one at curves 20 µmillustrate ultrasonic thea efficiency of ultrasonic viscoelastic heating rate. It can bebe determined that thethe viscoelastic heating rate at at 50 50 μm ultrasonic viscoelastic rate. Itby can determined that viscoelastic heating rate ultrasonic plasticizing can heating be improved increasing the ultrasonic amplitude. However, it hasμm been reported by amplitude is is nearly eight times of thethe one at at 20 20 μmμm ultrasonic amplitude. Hence, thethe efficiency of of amplitude eight times one ultrasonic amplitude. Hence, efficiency Sacristán et al. [6]nearly that too high an of ultrasonic amplitude may lead to a decrease of the average molar ultrasonic plasticizing can be improved by increasing the ultrasonic amplitude. However, it has been ultrasonic plasticizing can be improved by increasing the ultrasonic amplitude. However, it has been mass of theby polymer. Therefore, a lower ultrasonic amplitude range from 0totoa 30 µm was chosen reported Sacristán et et al. al. [6][6] that tootoo high anan ultrasonic amplitude may lead of of thethe for reported by Sacristán that high ultrasonic amplitude may lead to decrease a decrease theaverage experimentation. averagemolar molarmass massof ofthethepolymer. polymer.Therefore, Therefore,a alower lowerultrasonic ultrasonicamplitude amplituderange rangefrom from The experimental results further confirms the numerical simulation as shown in Figure 10a,b. 0–30 μm was chosen for the experimentation. 0–30 μm was chosen for the experimentation. The experimental further confirms thethe numerical simulation as as shown in in Figure 10a,b. The temperature curves results measured in the PMMA cylinder show nearly the same trend as the simulated The experimental results further confirms numerical simulation shown Figure 10a,b. The temperature curves measured in the PMMA cylinder show nearly the same trend as the results in the case of both below and above the glass transition temperature. For the PMMA The temperature curves measured in the PMMA cylinder show nearly the same trend as cylinder the simulated results in in thethe case both and above thethe glass transition temperature. ForFor the PMMA ˝ C,below with simulated an initial temperature ofof25 measured temperature increment is 19.5, 34.4, and 50.6 ˝ C after results case of boththe below and above glass transition temperature. the PMMA cylinder with anan initial temperature of of 25 25 °C,°C, thethe measured temperature increment is 19.5, 34.4, and cylinder with initial measured temperature ultrasonic plasticizing for 5temperature s, respectively, for the ultrasonic amplitudes increment of 10 um, is2019.5, um 34.4, and and 30 um as 50.6 °C after ultrasonic plasticizing for 5 s, respectively, for the ultrasonic amplitudes of 10 um, 20 20 50.6 after 10a. ultrasonic forthat 5 s, the respectively, for heating the ultrasonic of 10 um, shown in°C Figure It wasplasticizing determined viscoelastic rate atamplitudes the ultrasonic amplitude of umum and 30 30 umum as as shown in in Figure 10a. It was determined that thethe viscoelastic heating rate at at thethe and shown Figure 10a. It was determined that viscoelastic heating rate 30 ultrasonic um is about 2.5 times higher the one athigher the ultrasonic amplitude of 10 um. For an increased amplitude of of 30 umum isthan about 2.52.5 times than thethe one at at thethe ultrasonic amplitude of of ultrasonic amplitude 30 is about times higher than one ultrasonic amplitude initial temperature of PMMA cylinder, there is no significant change in viscoelastic heating rate until 10 10 um. For an increased initial temperature of PMMA cylinder, there is no significant change in um. For an increased initial˝ temperature of PMMA cylinder, there is no significant change in theviscoelastic temperature risesrate up until to 105 Ctemperature as shown in Figure It was determined that theIt viscoelastic heating thethe rises upup to10b. 105105 °C as as shown in in Figure 10b. was viscoelastic heating rate until temperature rises to °C shown Figure 10b. It was ˝ C/s rate heating rate can be asviscoelastic fast as 125 at ultrasonic amplitude of 30 um. Thisamplitude isamplitude in agreement determined that thethe heating cancan bebe as as fast as as 125125 °C/s at at ultrasonic of of 30 30 with determined that viscoelastic heating rate fast °C/s ultrasonic um. This is in agreement with results obtained by Tolunay et al. [9] They found that the rate of of results obtained by Tolunay et al. [9] They found that the rate of temperature rise can be substantially um. This is in agreement with results obtained by Tolunay et al. [9] They found that the rate temperature rise can be substantially increased even at places distant from the welding interface increased even at places from the welding interface internal temperature temperature rise can bedistant substantially increased even at placeswhen distantthe from the welding interfaceof the when the internal of of thethe polymer reaches upup to to thethe temperatures around thethe glass polymer reaches up temperature totemperature the temperatures around the glass transition. when the internal polymer reaches temperatures around glass transition. transition.
Figure 9. 9. Viscoelastic heating curve of PMMA at various ultrasonic amplitudes. Figure of PMMA PMMA various ultrasonic amplitudes. Figure Viscoelastic 9. Viscoelasticheating heatingcurve curve of atatvarious ultrasonic amplitudes.
(a) (a)
(b) (b)
Figure 10. Measured viscoelastic heating curve of PMMA at various initial temperatures, (a) initial Figure 10. Measured viscoelastic heating curve of PMMA at various initial temperatures, (a) initial
Figure 10. Measured curve at various initial temperatures, (a) initial temperature of 25 °C; viscoelastic and (b) initialheating temperature of of 80 PMMA °C. temperature of 25 °C; and (b) initial temperature of 80 °C. temperature of 25 ˝ C; and (b) initial temperature of 80 ˝ C.
Polymers 2016, 8, 199
11 of 12
It should be noted that although the temperature increase during viscoelastic heating has nearly the same trend, there are still quantitative difference in the rate of viscoelastic heating between experimentation and numerical simulation. For instance, it was determined that the viscoelastic heating rate is about 3.3 ˝ C/s in the range of 100 to 105 ˝ C when the applied ultrasonic amplitude is 30 um in numerical simulation. However, the experimentally-measured viscoelastic heating rate is about 12 ˝ C/s. This may be ascribed to the assumptions made for the simplified numerical simulation model which ignores the heat generation of the sonotrode. In addition, the temperature spectra of loss modulus is unable to accurately obtain under ultrasonic frequency due to the limitation of existing instrument. Hence, the difference in viscoelastic heating rate may be further related to the accuracy of the mathematical modeling of the macromolecular segment movement around glass transition. By the Arrhenius and semi-empirical WLF equations in this work, the influence of temperature on the macromolecular segment movement around glass transition cannot be fully described. Since the theoretical premise of the Arrhenius equation is that the movement units before the glass transition are all chain elements and lateral groups that are smaller than the macromolecular segments. The semi-empirical WLF equation is mainly used to describe the movement characteristics of the macromolecular segments. 5. Conclusions In this work, the viscoelastic heating phenomenon of amorphous polymer in ultrasonic plasticization was studied by both theoretical modeling and experimentation. Considering the attenuation of ultrasonic amplitude in viscoelastic medium, the viscoelastic heating rate was mathematically modelled as a function of the ultrasonic frequency, the square of the strain amplitude and the loss modulus of the polymer. The mathematical model was then applied to the numerical simulation in the commercial FEM software ANSYS. The influence mechanism of several parameters, such as the initial temperature of the polymer, the ultrasonic frequency, and the ultrasonic amplitude were investigated. Both the results from numerical simulation and experimentation indicate that the heat generation rate of viscoelastic heating can be significantly influenced by the initial temperature. The glass transition temperature was found to be a significant shifting point in viscoelastic heating. The heat generation rate is relatively low at the beginning and can have a steep increase after reaching the glass transition temperature. In comparison with the ultrasonic frequency, the ultrasonic amplitude has much greater influence on the heat generation rate. It can be concluded that the viscoelastic heating is the main heat source and predominant in ultrasonic plasticizing of amorphous polymers since the interfacial friction heating lasts only a very short time. For the development of the ultrasonic plasticizing, it would be benefit if the plasticizing chamber could be heated up to the glass transition temperature of amorphous polymers. Acknowledgments: This research is financially supported by the National Natural Science Foundation of China (No. 51575540 and No. 51405519). The helpful comments of anonymous reviewers are gratefully acknowledged. Author Contributions: Bingyan Jiang provided academic advice and contributed materials and analysis tools for this research; Wangqing Wu and Yunlong Jia conceived and designed the numerical simulation and the experiments. Yunlong Jia conducted the numerical simulation and the data analysis; Huajian Peng and Yingping Zhang performed the experiments and the data analysis. Wangqing Wu wrote the paper. Conflicts of Interest: The authors declare no conflict of interest.
References 1. 2.
Michaeli, W.; Spennemann, A.; Gärtner, R. New plastification concepts for micro injection moulding. Microsyst. Technol. 2002, 8, 55–57. [CrossRef] Michaeli, W.; Opfermann, D. Ultrasonic plasticising for micro injection moulding. In Proceedings of the 4 m 2006—Second International Conference on Multi-Material Micro Manufacture, Grenoble, France, 20–22 September 2006; Fillon, W.M.D., Ed.; Elsevier: Oxford, UK, 2006; pp. 345–348.
Polymers 2016, 8, 199
3.
4. 5. 6. 7.
8. 9. 10. 11. 12. 13. 14. 15. 16. 17. 18. 19. 20. 21.
12 of 12
Michaeli, W.; Kamps, T. Heating and plasticizing polymers with energetic ultrasound for micro injection molding. In Proceedings of the Annual Technical Conference (ANTEC) of the Society of Plastics Engineers (SPE), Orlando, FL, USA, 16–20 May 2010. Michaeli, W.; Kamps, T.; Hopmann, C. Manufacturing of polymer micro parts by ultrasonic plasticization and direct injection. Microsyst. Technol. 2011, 17, 243–249. [CrossRef] Wu, W.; Peng, H.; Jia, Y.; Jiang, B. Characteristics and mechanisms of polymer interfacial friction heating in ultrasonic plasticization for micro injection molding. Microsyst. Technol. 2016. [CrossRef] Sacristán, M.; Plantá, X.; Morell, M.; Puiggalí, J. Effects of ultrasonic vibration on the micro-molding processing of polylactide. Ultrason. Sonochem. 2014, 21, 376–386. [CrossRef] [PubMed] Planellas, M.; Sacristán, M.; Rey, L.; Olmo, C.; Aymamí, J.; Casas, M.T.; del Valle, L.J.; Franco, L.; Puiggalí, J. Micro-molding with ultrasonic vibration energy: New method to disperse nanoclays in polymer matrices. Ultrason. Sonochem. 2014, 21, 1557–1569. [CrossRef] [PubMed] Nonhof, C.J.; Luiten, G.A. Estimates for process conditions during the ultrasonic welding of thermoplastics. Polym. Eng. Sci. 1996, 36, 1177–1183. [CrossRef] Tolunay, M.N.; Dawson, P.R.; Wang, K.K. Heating and bonding mechanisms in ultrasonic welding of thermoplastics. Polym. Eng. Sci. 1983, 23, 726–733. [CrossRef] Suresh, K.S.; Rani, M.R.; Prakasan, K.; Rudramoorthy, R. Modeling of temperature distribution in ultrasonic welding of thermoplastics for various joint designs. J. Mater. Process. Technol. 2007, 186, 138–146. [CrossRef] Mano, J.F.; Viana, J.C. Stress–strain experiments as a mechanical spectroscopic technique to characterise the glass transition dynamics in poly(ethylene terephthalate). Polym. Test. 2006, 25, 953–960. [CrossRef] Zhang, Z.; Wang, X.; Luo, Y.; Zhang, Z.; Wang, L. Study on heating process of ultrasonic welding for thermoplastics. J. Thermoplast. Compos. Mater. 2010, 23, 647–664. [CrossRef] Siddiq, A.; Ghassemieh, E. Thermomechanical analyses of ultrasonic welding process using thermal and acoustic softening effects. Mech. Mater. 2008, 40, 982–1000. [CrossRef] Benatar, A.; Gutowski, T.G. Ultrasonic welding of peek graphite apc-2 composites. Polym. Eng. Sci. 1989, 29, 1705–1721. [CrossRef] Lu, H.; Leng, J.; Du, S. A phenomenological approach for the chemo-responsive shape memory effect in amorphous polymers. Soft Matter 2013, 9, 3851–3858. [CrossRef] Ham, J.H.; Platzer, B. Semi-empirical equations for the residence time distributions in disperse systems—Part 1: Continuous phase. Chem. Eng. Technol. 2004, 27, 1172–1178. [CrossRef] Lionetto, F.; Maffezzoli, A. Polymer characterization by ultrasonic wave propagation. Adv. Polym. Technol. 2008, 27, 63–73. [CrossRef] Reynolds, W.N.; Scudder, L.P.; Pressman, H. The use of ultrasonic wave attenuation to monitor polymer and composite quality. Polym. Test. 1986, 6, 325–336. [CrossRef] Wortmann, F.J.; Schulz, K.V. Stress relaxation and time/temperature superposition of polypropylene fibres. Polymer 1995, 36, 315–321. [CrossRef] Schapery, R.A. Application of thermodynamics to thermomechanical, fracture, and birefringent phenomena in viscoelastic media. J. Appl. Phys. 1964, 35, 1451–1465. [CrossRef] Plazek, D.J. The temperature dependence of the viscoelastic behavior of poly(vinyl acetate). Polym. J. 1980, 12, 43–53. [CrossRef] © 2016 by the authors; licensee MDPI, Basel, Switzerland. This article is an open access article distributed under the terms and conditions of the Creative Commons Attribution (CC-BY) license (http://creativecommons.org/licenses/by/4.0/).