Air Qual Atmos Health (2012) 5:277–292 DOI 10.1007/s11869-010-0105-4
Numerical simulations examining the possible role of anthropogenic and volcanic emissions during the 1997 Indonesian fires Melissa Anne Pfeffer · Bärbel Langmann · Angelika Heil · Hans-F. Graf
Received: 28 July 2010 / Accepted: 27 October 2010 / Published online: 2 December 2010 © The Author(s) 2010. This article is published with open access at Springerlink.com
Abstract The regional atmospheric chemistry and climate model REMOTE has been used to conduct numerical simulations of the atmosphere during the catastrophic Indonesian fires of 1997. These simulations represent one possible scenario of the event, utilizing the RETRO wildland fire emission database. Emissions from the fires dominate the atmospheric concentrations of O3 , CO, NO2 , and SO2 creating many possible exceedances of the Indonesian air quality standards. The scenario described here suggests that urban anthropogenic emissions contributed to the poor air quality due primarily to the fires. The urban air pollution may have increased the total number of people exposed to exceedances of the O3 1-h standard by 17%. Secondary O3 from anthropogenic emissions enhanced the conversion of SO2 released by the fires to SO42 – , demonstrating that the urban pollution actively altered the atmospheric behavior and lifetime of the fire emisM. A. Pfeffer Max Planck Institute for Meteorology, Hamburg, Germany B. Langmann Institute of Geophysics, University of Hamburg, Hamburg, Germany A. Heil Institute of Chemistry and Dynamics of the Geosphere, Research Center Jülich, Jülich, Germany H.-F. Graf University of Cambridge, Cambridge, UK Present Address: M. A. Pfeffer (B) Department of Geosciences, University of Oslo, Oslo, Norway e-mail:
[email protected]
sions. Under the conditions present during the fires, volcanic SO2 emissions had a negligible influence on surface pollution. Keywords Indonesia · Air pollution · Wildfires
Introduction Air pollution is a significant environmental problem in Indonesia, having an impact on public health and disrupting the Indonesian economy (Aiken 2004). Elevated concentrations of lead, particulate matter (PM), carbon monoxide (CO), hydrocarbons, sulfur dioxide (SO2 ), and nitrogen dioxide (NO2 ) are found in all large cities in the country. Motor vehicles, fires, and the industrial sector are the greatest contributors to the air pollution problem (Energy Information Administration 2004). Additional sources of air pollution in Indonesia are volcanoes, as this is the region of the world with the largest number of historically active vents (Simkin and Siebert 1994). Large-scale fires set by people for land conversion contribute greatly during the dry season, releasing gases and particles referred to as haze into the atmosphere (Heil and Goldammer 2001). These fires are typically extinguished at the onset of the north monsoon rains in October–November. In 1997, however, strong El Niño conditions delayed the onset of the rains and promoted a drought (Khandekar et al. 2000), allowing the fires to burn uncontrolled for a longer time than usual. Between August and November 1997, land-clearing fires in Kalimantan and Sumatra grew out of control into wildfires producing an environmental disaster. The El Niño conditions also reduced convective activity in the region, preventing
278
the emissions from the fires from mixing upwards in the atmosphere (Heil and Goldammer 2001). This had the effect of generating high surface concentrations of the pollutants that were transported over a large part of Southeast Asia. While Indonesia experienced the brunt of the pollution effects from the fires (Frankenberg et al. 2004), a multitude of transboundary health and economic problems, significantly in Malaysia (Sastry 2002; Khandekar et al. 2000) and Singapore (Koe et al. 2001), were also felt. The 1997 fires and their effects have been studied using several different methods, including stationary, balloon, and airplane measurements, satellite observations, illness and mortality surveys, and numerical modeling of atmospheric processes. The surface and tropospheric concentrations of the compounds emitted by the fires including PM, SO2 , CH4 , CO, NOx , and secondarily produced O3 were enhanced within the region for all observed pollutants (Davies and Unam 1999; Fujiwara et al. 1999, 2000; Matsueda et al. 1999; Tsutsumi et al. 1999; Yonemura et al. 2002a, b). Even measurements performed several hundred kilometers from the fires demonstrated significantly elevated concentrations for all of these compounds. Satellite observations of this event are important, as there are very few ground-level observations of the extent of the area burned and of the dispersion of the pollution from the fires. The extent of the fires and associated haze were observed using Advanced Very High Resolution Radiometer (AVHRR) data (Wooster et al. 1998; Fang and Huang 1998). Nakajima et al. (1999) used AVHRR data to study sulfate and carbonaceous aerosol optical thickness due to the fires, finding that the peak enhancement occurred in October and that the smoke from the fires was dominated by small submicron aerosol particles. The Total Ozone Mapping Spectrometer (TOMS) was used to observe tropospheric column O3 (TCO) and tropospheric water vapor (Chandra et al. 1998) and total atmospheric O3 (Kita et al 2000). TOMS indicated about 10– 20 Dobson Units (DU; 1 DU = 2.69 × 10¹⁶ molecules cm−2 ) of increased tropospheric ozone over the Indonesian region (Chandra et al. 1998) while groundbased measurements indicated an increase of up to 35 DU (Fujiwara et al. 1999). By comparing AVHRR and TOMS data, Nakajima et al. (1999) suggest that sulfate aerosol particles may be observed further from the fires than carbonaceous aerosol particles because of the time required for SO2 released by the fires to convert to sulfate aerosol. Increased tropospheric column concentrations of NO2 , O3 , and H2 CO were observed by the Global Ozone Monitoring Experiment (GOME) during the fires (Burrows et al. 1999).
Air Qual Atmos Health (2012) 5:277–292
Several studies of the environmental and radiative effects of the compounds emitted by the fires have been conducted using climate and aerosol models. A global chemical transport model with a mean climatological state rather than the actual meteorological conditions present during the fires was used by Hauglustaine et al. (1999) to study the increase in tropospheric O3 due to precursor species released by the fires. A global atmospheric chemistry and transport model was applied by Chandra et al. (2002) who demonstrated a strong enhancement of TCO over Indonesia and most of the western Pacific and a decrease in TCO in the eastern Pacific, concluding that both the emissions from the fires and El Niño specific meteorological conditions contributed to the O3 anomaly. Duncan et al. (2003) expanded on the work of Chandra et al. (2002) using the same model and gaseous emissions while adding the radiative effects of black carbon (BC) and organic carbon (OC) particles from the fires in their study. They found that the net effect of the fires was to reduce OH and the oxidizing capacity of the troposphere and to reduce radiative forcing at the Earth’s surface, predominantly by OC and BC. Podgorny et al. (2003) applied an aerosol optical model producing results that agree with those of Duncan et al. (2003) that the aerosol particles released by the fires generated an enhancement in atmospheric solar heating and a corresponding decrease in solar flux reaching the surface over the equatorial region ranging from west of Indonesia to Papua New Guinea. A large uncertainty in these early studies is in the emission inventory applied for the fires, in particular the contribution of peat fires to total fire emissions. Langmann and Heil (2004) applied a regional atmospheric chemistry and climate model to compare different emission scenarios in order to better constrain how much particulate matter was released by the fires, and how much the burning of peat forest contributed to the total pollution. The present work is a theoretical study that attempts to capture the complex interactions of the different emission sources during the Indonesian fires of 1997. We have conducted the first study of this event that applies a high-resolution regional model including full tropospheric chemistry. We have further included a new improved inventory of anthropogenic and wildfire emissions- the RETRO database (Schultz et al. 2008; Schultz 2007). In order to model the event as realistically as possible, we have also included volcanic SO2 emissions. Due to the scarcity of measurements during the event, however, this is a theoretical modeling study that cannot be properly validated. The goal of this study is to examine the atmospheric concentrations of trace gases during this event, and to consider how the
Air Qual Atmos Health (2012) 5:277–292
anthropogenic and volcanic emissions in the region may have participated in the extreme pollution event due primarily to the fires. Experimental setup In this section, we will describe the experiments performed for this study. Firstly, the model will be introduced. Then, the inventories for the anthropogenic, fire, and volcanic emissions will be described. Finally, the three experiments performed for this work will be explained. Model The regional atmospheric chemistry model Regional Model with Tracer Extension (REMOTE; Langmann 2000) has been used for this study. REMOTE combines the physics of the regional climate model REMO 5.0 with tropospheric chemical equations for 63 chemical species; 158 gas phase reactions from the RADM II photochemical mechanism (Stockwell et al. 1990) are included. The chemical tracer transport mechanisms include horizontal and vertical advection (Smolarkiewitz 1983), convective up- and down-draft (Tiedtke 1989), and vertical diffusion (Mellor and Yamada 1974). Trace species can undergo chemical decay in the atmosphere or can be removed from the atmosphere by wet and dry deposition or transport out of the model boundaries. Forty-three longer-lived chemical species are transported between grid boxes, and 20 are calculated but too short-lived to be transported. The model was applied with 20 vertical layers of increasing thickness between the Earth’s surface and the 10 hPa pressure level (approximately 23 km). The model domain covers Indonesia and northern Australia (91◦ E–141◦ E; 19◦ S–8◦ N) with a horizontal resolution of 0.5◦ (approximately 55 km). Meteorological analysis data from the European Centre for Medium-Range Weather Forecasts (ECMWF) were used as boundary conditions every 6 h. Results from a global chemical transport model (MOZART; Horowitz et al. 2003) simulation for the year 1990 (Granier et al. 2003) were used as chemical concentration boundary conditions every 6 h for 14 chemical species including O3 and CO. Background concentrations for 25 other species (Chang et al. 1987) including SO2 and SO42 – were specified at the lateral model boundaries. Emission inventories The emissions have been divided into three categories: anthropogenic, fire, and volcanic. The fires were set by
279
people and are hence an anthropogenic source. For the purposes of this paper, however, the fire emissions are treated as distinct from the other anthropogenic emissions. The anthropogenic and fire emissions include 18 and 19 species, respectively, including SO2 , CO, and NO2 . Some of the anthropogenic species vary monthly while others are an annual mean in the inventory. The anthropogenic emissions with monthly values vary little, and so these emissions are shown for only October 1997. All fire species have large monthly variations, so the fire emissions are shown for September, October, and November 1997. The volcanic inventory was developed to be a realistic, conservative estimate averaged over the past century. These emissions are temporally constant and include only SO2 and SO42 – . Sea spray generally contributes less than 20% to atmospheric S in Indonesia (Kloster 2006), and is not considered in this paper. Anthropogenic emissions The anthropogenic emission inventory (Table 1) was assembled using data available from the Global Table 1 Indonesian anthropogenic emissions for October 1997 Species
Emissions Gg Oct. 1997
Acetaldehydea Alkanesa,f Aromaticsa,g Black carbonb Butane + Propanec COc Ethanec Ethenec Formaldehydea Ketonesa NH3 d NOc NO2 c Propenec SO2 e SO42 – e Toluenec Xylenec
22.3 74.0 13.0 43.2 36.2 2,402.0 27.7 40.5 8.2 8.4 145.8 139.0 8.9 18.7 39.8 2.5 22.1 15.3
a EDGAR
V2.0; benchmark year 1990 original inventory; benchmark year 1985; Penner et al. (1993); Dignon et al. (1994) c RETRO d EDGAR V2.0; benchmark year 1990; Bouwman et al. (1997) e GEIA original inventory; benchmark year 1985; Benkovitz et al. (1996) f Hexane and higher g Excluding benzene, toluene, xylene, methyl benzene, and trimethyl benzene b GEIA
280
Air Qual Atmos Health (2012) 5:277–292
Emissions Inventory Activity (GEIA) website (GEIA 2006). Data was included from the RETRO emission database (Schultz 2007) and the EDGAR V2.0 emission database (Olivier et al. 1996; Bouwman et al. 1997). Multiple emission inventories were combined to include as many trace species as possible in the simulations. The RETRO emissions are available as monthly data in 0.5◦ resolution. In the RETRO emissions, a discontinuity occurs at the equator due to the change in the seasons between the northern and southern hemispheres. As the equator is significant in the domain of these model experiments, the RETRO emissions for the southern hemisphere have been applied with the northern hemisphere seasonal cycle to avoid this discontinuity. The data provided from the other sources are available as annual means for the year 1985 or 1990 in 1.0◦ resolution and have been interpolated to 0.5◦ for the experiments. The Indonesian anthropogenic emissions range from 1–6% of the global total of anthropogenic emissions. Fire emissions The fire emission inventory (Table 2) is from the RETRO emission database (Schultz et al. 2008) and are provided as monthly data in 0.5◦ resolution. The species included within the anthropogenic and fire inventories
Table 2 Indonesian Fire Emissions for September–November 1997 Species
Emissions Gg Sep. 1997
Emissions Gg Oct. 1997
Emissions Gg Nov. 1997
Acetaldehyde Black carbon Formaldehyde CO Ethane Ethene Isoprene Ketonesa NH3 NO2 NO Organic carbon Propane Propene SO2 SO42 – Toluene TPM Xylene
1,608.1 355.4 1,151.0 134,708.3 887.1 1,994.8 544.5 940.4 8,408.3 82.6 1,293.5 5,006.8 629.2 2,010.3 1,960.2 122.5 730.3 24,790.8 69.2
1,329.3 266.2 913.6 108,791.7 689.7 1,589.8 461.1 760.6 7,065.5 63.9 999.6 3,970.4 479.7 1,634.4 1,634.0 102.1 606.4 20,572.5 55.6
448.0 89.8 307.9 36,662.5 232.0 535.4 155.4 256.4 2,380.7 21.6 338.1 1,338.0 161.1 550.2 550.6 34.4 204.3 6,935.7 18.7
All emissions from RETRO a Acetone
differ in that the fire emissions do not include higher alkanes or butane (which are oxidized in fires very quickly) while the anthropogenic emissions do not include isoprene (which is mainly emitted by vegetation), OC, or total particulate matter (TPM). All of the fire emission species increase dramatically in the dry season (northern hemisphere autumn) compared with the wet season (northern hemisphere spring). In September (the peak month of fire emissions), these emissions range from 62– 95% of the global total of fire emissions. The Indonesian fires of 1997 are the largest contributor to global fire emissions contained in the RETRO wildland fire database (Schultz et al. 2008). The burning of peat during the fires contributed greatly to the severity of the emissions (auxiliary material Schultz et al. 2008). Volcanic emissions The amount of SO2 released by a volcano is dependent on many factors including activity type and varies widely from one volcano to another and at one volcano over time. There are few reported measurements of the degassing rates of the Indonesian volcanoes. The SO2 flux of five mildly erupting and passively degassing Indonesian volcanoes have been measured using correlation spectroscopy (COSPEC). Potentially stratosphere-reaching eruptive plumes have been observed with TOMS for four volcanoes and of tropospheric eruptions for two others. The petrologic method (whereby the difference in volatile concentration in melt inclusions and coexisting matrix glass is used to estimate degassing for one eruptive event) has been used to calculate the SO2 emissions of four large eruptions. Relatively rare stratospheric-reaching eruptions released from 200–5,800 Gg SO2 per eruption, while passive degassing and small eruptions (the source of most volcanic emissions) released from 5– 240 Gg SO2 year−1 . Because of the very few measurements of the emission rates of the Indonesian volcanoes, estimates are necessary to be able to incorporate volcanic emissions into modeling studies. A conservative emission estimate has been developed considering eruptive and passive degassing volcanic activity. The only volcanic species considered are SO2 and its oxidation product SO42 – because there is far more information available about the flux rate of SO2 at individual volcanoes at specific times and, more generally, at volcanoes at different activity levels than for any other species. The eruptive activity recorded in the Simkin and Siebert (1994) catalog during the past century (1900– 1993) for each volcano in the model domain were summed. Over this time period, 63 volcanoes in
Air Qual Atmos Health (2012) 5:277–292
281
Table 3 Estimates of Indonesian volcanic emissions
suggested by the VSI. The SO2 flux resulting from this multiplication was then divided by the 94 years of the record to generate an annual mean emission estimate. The time-averaging removes some of the high natural short-term variability in volcanic eruption frequency. These calculations indicate 290 Gg SO2 year−1 released eruptively by the Indonesian volcanoes. The passive emissions were calculated by assuming that 60% of volcanic emissions are eruptive and 40% are passive, following Halmer et al. (2002). This results in an assessment of 190 Gg SO2 year−1 released passively. The passive emissions were divided evenly among the 95 active volcanoes, providing a mean passive SO2 flux of 2 Gg SO2 year−1 for each volcano. The sum of passive and eruptive volcanic emissions is about 480 Gg SO2 year−1 . The estimated emissions of individual volcanoes are generally less than COSPEC measurements. The COSPEC measurements were mostly made during times of tropospheric eruptive activity and eruptions
Emissions (Gg (SO2 )/year) Author
Eruptive
Non-eruptive
Combined
Hilton et al. (2002) Spiro et al. (1992) Nho et al. (1996) Halmer et al. (2002) Pfeffer et al. (2006) This study
– – 1,900 – 290 290
120 210 1,600 – 3,500 194
– – 3,500 2,100–2,600 3,790 484
Indonesia are known to have erupted and 32 additional volcanoes have passively degassed. The strength of each eruption as described by the volcanic explosivity index (VEI; Newhall and Self 1982) was used to calculate the amount of SO2 released following the volcanic sulfur index (VSI; Schnetzler et al. 1997). The total number of eruptions of each VEI class was multiplied by the maximum amount of SO2 released by arc volcanoes (volcanism produced by subduction)
February 1997
0.0005
6N
0.001
3N
SOx (Tg SO2/yr)
September 1997
0.0001 6N
EQ
0.005
EQ
3S
0.01
3S
6S
0.05
6S
9S
0.1
9S
12S 15S 18S
0.5
12S 15S 18S
1 1.5 95E 100E 105E 110E 115E 120E 125E 130E 135E 140E
Emission Source
3N
Contribution (%) Feb.
Sep.
48
2
Fire
5
96
Volc
47
2
Anth
95E 100E 105E 110E 115E 120E 125E 130E 135E 140E
2.1 0.0001 0.0005
6N
0.001
3N
0.005
EQ
NOx (Tg NO2/yr)
6N EQ
3S
0.01
3S
6S
0.05
6S
9S
0.1
9S
12S 15S 18S
0.5
12S 15S 18S
1 1.5 95E 100E 105E 110E 115E 120E 125E 130E 135E 140E
Emission Source
3N
Contribution (%) Feb.
Sep.
Anth
98
9
Fire
2
91
95E 100E 105E 110E 115E 120E 125E 130E 135E 140E
1.8 0.005 0.01
6N
0.05
3N
CO (Tg CO/yr)
3N
EQ
0.1
EQ
3S
0.5
3S
6S
1
6S
9S
5
9S
12S 15S 18S
10
12S 15S 18S
50 100 95E 100E 105E 110E 115E 120E 125E 130E 135E 140E
130
Emission Source
6N
Contribution (%) Feb.
Sep.
Anth
91
1
Fire
9
99
95E 100E 105E 110E 115E 120E 125E 130E 135E 140E
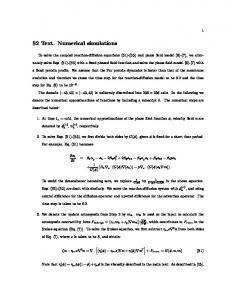
Fig. 1 Total emissions for the sum of the anthropogenic, fire, and volcanic sources for SOx , NOx , and CO for February and September 1997
282
are frequently interspersed with long periods of passive degassing. The lower values of the estimated emissions compared with the COSPEC measurements reflect this lower emission flux averaged over time. We contend that this century-mean emission inventory provides a realistic, conservative estimate of the volcanic degassing of SO2 in the region (Table 3). Implementation of emission inventories Figure 1 shows the total emissions from anthropogenic, fire, and volcanic sources for SOx (SO2 + SO42 – ) and the total emissions from anthropogenic and fire sources for NOx (NO2 + NO) and CO for February and September 1997. The emissions of each volcano have been released into the model layer at the height of the volcano, which lie within the bottom 12 model levels (up to about 4 km). This is a practical approach as we do not have sufficient data to reasonably estimate the injection heights of the eruptive emissions or the
Air Qual Atmos Health (2012) 5:277–292
amount of passive degassing from the flanks of the volcanoes. The anthropogenic and fire emissions were released into the bottom model layer, which is between ∼30 – 500 m thick. This is a reasonable approach for Indonesia where few industrial stack heights exceed this height and where most of the biomass burning emissions are from smoldering peat fires (Heil 2007). For all three species, the fire emissions strongly dominate in September while they are minor in February. Because of the severity of the fires, the total emissions are also greatly increased in September. The fires in September 1997 were strongest in southern Kalimantan and southeastern Sumatra. Experiments In order to ascertain the influence of the different emission sources within the model domain on the air quality in the region, an experiment including all emission sources and two sensitivity experiments excluding an
Fig. 2 Ground-level concentration of SO2 , NO2 , CO, and O3 averaged over September–November 1997 for experiment AnthVolc-Fire
Air Qual Atmos Health (2012) 5:277–292
emission source were conducted. (1) Anth-Volc-Fire— emissions from the anthropogenic, volcanic, and fire sources were included in the model experiment: this is the reference experiment; (2) Volc-Fire—only emissions from the volcanic and fire sources were included while anthropogenic emissions inside the domain were excluded; and (3) Anth-Fire—only emissions from the anthropogenic and fire sources were included while volcanic sources inside the domain were excluded. In figures, experiments Anth-Volc-Fire, Volc-Fire, and Anth-Fire will be referred to as AVF, VF, and AF, respectively. All experiments were conducted for the year 1997. The sulfur species, SO2 and SO42 – , have been “marked” into four categories: A, V, and F for the anthropogenic, volcanic, and fire emission sources, respectively, and B for the sulfur containing species defined at the boundaries of the simulation area. This marking allows sulfur from each source to be followed individually throughout the experiments as four SO2 and four SO42 – tracers. This is a technique only possible in modeling studies.
Results The maximum surface concentrations of SO2 , NO2 , CO, and O3 in September–November 1997 are found Fig. 3 Vertical profiles of the modeled (f illed triangles) and measured (open circles) O3 for 17 February, 15 September, 15 October, and 17 November 1997 at Petaling Jaya, Malaysia (3.0◦ N, 101.5◦ E). Measurements are from Yonemura et al. (2002a)
283 Table 4 Indonesian air quality standards Pollutant SO2
NO2
CO O3
Averaging
Standard
time
μg/m3
ppma
1h 24 h 1 year 1h 24 h 1 year 1h 24 h 1h 1-year
900 365 100 400 150 100 30,000 10,000 235 50
0.34 0.14 0.023 0.21 0.080 0.053 26.2 8.7 0.12 0.025
Syahril et al. (2002); For comparison, the air quality standards of the US EPA (ppm) are: SO2 24 h, 0.14; NO2 1 year, 0.053; CO 1 h, 35; O3 8 h, 0.08 a Calculated assuming 25◦ C and 1 ATM
over southeastern Sumatra and southern Kalimantan (Fig. 2): the locations of the most intense fires. These four compounds are focused on because they are among the pollutants regulated by the Indonesian government and they are active participants in tropospheric chemistry. These 3-month average values have been plotted to highlight where they exceed the Indonesian air quality standards. There are no 3-month air quality standards (Table 4). There are 1-year air quality standards for SO2 (0.023 ppm),
284
Air Qual Atmos Health (2012) 5:277–292
Fig. 4 Vertical profiles of the modeled (f illed triangles) and measured (open circles) O3 for 19 February, 17 September, 15 October, and 19 November 1997 at Watukosek, Indonesia (7.5◦ S, 112.6◦ E). Measurements are from Fujiwara et al. (1999)
NO2 (0.053 ppm), and O3 (0.025 ppm) and a 24-h standard for CO (8.7 ppm). Comparing the 3-month average values of SO2 , NO2 , and O3 with the 1-year standards will overestimate the region where the air quality standards were exceeded, as the fires did not last a whole year. Comparing the 3-month average value of CO with the 24-h standard will produce an underestimation of the region with exceedances. Despite the lack
October 20, 1997 14 GC/FID measurements REMOTE
12
10 Height (km)
Fig. 5 Vertical profiles of the modeled (f illed triangles) and measured (open circles) CO for 20 October 1997 between 1–7◦ N and 103–109◦ E. Measurements were made using a gas chromatograph equipped with a flame ionization detector (GC/FID) from Matsueda and Inoue (1999)
of 3-month air quality standards, comparing these three months of the main fires with the longest available air quality standards provides a framework to consider the severity of the pollution. Regions in Fig. 2 that exceed the standards as described above are plotted in green through red, while regions with concentrations less than the standards are plotted in white and blue. SO2 , NO2 , and CO rarely exceed the air quality standards.
8
6
4
2
0
0
0.2
0.4
0.6
0.8
1 CO (ppm)
1.2
1.4
1.6
1.8
2
Air Qual Atmos Health (2012) 5:277–292
The three-month averaged O3 exceeds the 1-year air quality standard over a large portion of the modeling domain, most significantly extending from the fires northwestward over much of western Kalimantan, central Sumatra, and southern Malaysia. The modeled O3 has been compared with ozonesonde measurements performed at two locations: Petaling Jaya, Malaysia (Fig. 3; Yonemura et al. 2002a) and Watukosek, Indonesia (Fig. 4; Fujiwara et al. 1999; for locations of measurements see bottom right panel of Fig. 2). At Petaling Jaya, 23 ozonesonde measurements were performed in 1997, typically at the beginning/end of a month and in the middle of a month, usually around 20:00 (local time). At Watukosek, 20 measurements were made, similarly at the beginning/end of a month and in the middle
285
of a month, with no measurements made April–June and weekly measurements made October–December, usually around 10:00 (local time). Petaling Jaya is downwind of the fires and is modeled to be affected by the fire-related O3 , with surface concentrations greater than the 1-year air quality standard. In February, the simulated O3 matches the measured very well. During the three months of the fire, the model overpredicts the surface O3 at Petaling Jaya by 20–40 ppb. Between 1–2 km elevation, the model greatly overpredicts the O3 and becomes less than the observed above 3 km. Watukosek is upwind of the fires, and the measured O3 is greater than the O3 measured at Petaling Jaya. Again, the modeled O3 in February matches the observation very well. For the three months of the fire, the simulated O3 is
Fig. 6 Tropospheric column concentration of NO2 for February (top row) and September (bottom row) 1997 for REMOTE model simulations (left column) and GOME satellite observations (right column; Richter et al. 2005)
286
less than the observed and up to 3 km matches the vertical pattern of the ozonesonde measurements quite well. The modeled CO has been compared with airborne measurements made on October 20, 2007 (Fig. 5; Matsueda and Inoue 1999; for locations of measurements see bottom left panel of Fig. 2). The model results shown are for the horizontal grid box and model level containing the latitude/longitude and elevation where a sample was collected. Heights of the measurements and model results are not equal in the figure because the model results are presented at the mean height of the model layer. The modeled CO is approximately double the observed throughout the vertical profile, and replicates the vertical trend very well. The modeled, monthly averaged NO2 tropospheric column concentration for February and September 1997 has been compared with gridded, monthly averaged GOME satellite data (Fig. 6; Richter et al. 2005). Despite the missing data in the February 1997 GOME image (the white pixels), it can be seen that the REMOTE February simulation matches the GOME
Air Qual Atmos Health (2012) 5:277–292
image well. In September 1997, the burning regions of southern Kalimantan and southeastern Sumatra have much greater NO2 burdens than the GOME image shows. The modeled O3 tropospheric column concentration cannot be compared with GOME observations, because REMOTE does not include stratospheric chemistry. A result of this is that the very important transport of O3 from the stratosphere into the troposphere is not captured, and our simulated tropospheric column concentrations will necessarily be underestimated. The influence of the anthropogenic emissions in the domain has been depicted by subtracting the surface concentration of the four species of interest calculated in the experiment without anthropogenic emissions (Volc-Fire) from the results of the reference experiment (Anth-Volc-Fire; Fig. 7). The anthropogenic surface concentrations (Fig. 7) are about one order of magnitude less than the total surface concentrations (Fig. 2). The greatest increase of SO2 and NO2 is found above Singapore, with an increase of 91%
Fig. 7 Difference in surface concentration of SO2 , NO2 , CO, and O3 averaged over September–November 1997 for experiment AnthVolc-Fire-Volc-Fire
Air Qual Atmos Health (2012) 5:277–292
for SO2 and 99% for NO2 when the anthropogenic emissions are included in the experiments. The greatest effect for CO is above Kuala Lumpur, where the anthropogenic emissions increase the atmospheric CO by 58% and for O3 above Jakarta by 67%. O3 is not enhanced by the anthropogenic pollution over most of Kalimantan and southeastern Sumatra, where the emissions from the fires were the strongest. The influence of the volcanic emissions on these four species has been calculated accordingly, by subtracting the results of the experiment without volcanic emissions (AnthFire) from Anth-Volc-Fire. These results are not shown because the influence on SO2 is minor, with the volcanic emissions contributing primarily over Java.
Discussion The observational data set is too small to make a robust statistical comparison with the model results: it is only possible to present a visual comparison of the model results with the few observations. Comparisons of the model results with the measurement sets available indicate that the simulated atmospheric concentrations of trace gases from the fires are too high at downwind locations. O3 compared with ozonesonde measurements at Petaling Jaya, CO compared with airborne measurements made slightly beyond the region where the model simulates the fire emissions to have been transported, and NO2 as observed by GOME all support this. In contrast, comparisons made in February, not during the extreme fires, agree well. We do not put as much weight on the comparison with measurements made at Watukosek. It is possible that the O3 values measured at Watukosek are too high, as they are greater than the values measured at Petaling Jaya (downwind of the fires) and the high values continue after the end of the fires. Ladstätter-Weißenmayer et al. (2005) show that the tropospheric column concentration of O3 as calculated from the ozonesonde measurements at Watukosek in September 1997 are about 10 DU greater than the GOME satellite observations. Thompson et al. (2003) offer the hypothesis that half of the tropospheric O3 increase measured at Watukosek may be due to large scale dynamical processes rather than fire emission related photochemical processes, in which case the measurements may not be too high, rather there is a physical transport mechanism that is not being correctly simulated. The RETRO fire trace gas emissions included in this study may be overestimated. The RETRO fire emissions can be most readily compared with the
287
Global Fire Emissions Database, Version 2 (GFEDv2; Randerson et al. 2006). RETRO has higher emissions than GFEDv2, which is attributed to a greater contribution from smoldering peat fires (auxiliary material Schultz et al. 2008). The RETRO emissions for the 1997 Indonesian fires has an uncertainty range of at least a factor of four due to uncertainties in variables including biomass load and burning efficiency (Heil 2007). Unfortunately, given the paucity of measurement data, it is not possible using the comparisons we have made to quantify the possible overestimation. Given that the fire emissions may be too high, the results regarding the air quality exceedances are most likely overestimated. The good performance of the model’s atmospheric chemistry in February, outside of the burning season, suggests that the results relating to the interactions between the different emission sources may be valuable. If the fire emissions have been overestimated, however, this will influence the results relating to the other emission sources, and as such the results presented are for this one simulated scenario. A detailed comparison of the model’s simulated rainfall with data from the Global Precipitation Climatology Centre (GPCC 2007), Global Precipitation Climatology Project (Huffman et al. 1997), and individual Malaysian stations is presented in Langmann and Heil (2004). The relevant comparison is for the so-called climate mode. It is shown that the REMOTE model follows the seasonal trend of dry season/wet season very well but strongly overestimates rainfall, particularly over the ocean. Over land, REMOTE’s simulation of rainfall is more reasonable. This overprediction means that water soluble compounds, such as SO42 – , will be washed out of the atmosphere too quickly but will have little effect on less soluble compounds. The highest surface concentrations of SO2 , NO2 , CO, and O3 in September–November 1997 were modeled to be directly above southeastern Sumatra and southern Kalimantan—the locations of the strongest fires, with winds out of the southeast transporting the pollution. The active Indonesian volcanoes are upwind of the fires. They contributed only slightly to the surface concentration of SO2 during the fires and did not discernibly influence the concentration of the secondary pollutant O3 . The anthropogenic pollution was greatest above the major cities in the region: Jakarta, Singapore, and Kuala Lumpur. Singapore and Kuala Lumpur are in the downwind path of the fire pollution, while Jakarta is upwind. The modeled concentrations of SO2 , NO2 , and CO were all highest at 7:00 (local time) as the pollutants are trapped in the nocturnal boundary layer. The modeled concentration of O3 was highest at 13:00 (local time) due to photochemical reactions.
288
The 1-h air quality standards (Table 4) were exceeded for all four species at discrete modeled hourly values above and downwind of the main fires. For SO2 , NO2 , and CO the exclusion of the anthropogenic pollution in the domain (experiment Anth-Volc-FireVolc-Fire) produces a minor reduction in the number of exceedances at 7:00. The inclusion of the anthropogenic pollution increases the total sum of O3 1-h exceedances where the most people live (Fig. 8). Applying the Gridded Population of the World Version 3 (GPWv3) data for the year 1995 (Center for International Earth Science Information Network (CIESIN), Columbia University and Centro Internacional de Agricultura Tropical (CIAT) 2005) indicates an increase of 17% of the number of people living in grid boxes with 1-h O3 exceedances. Some of the changes in surface O3 due to anthropogenic emissions are due to NOx pollution along the lines of international shipping (bottom right panel Fig. 7; middle row Fig. 1). It is shown by subtracting the SO2 F (the SO2 marked as specifically fire) in experiment Volc-Fire from that in Anth-Volc-Fire (top row Fig. 9) that the difference in SO2 F is negative over peninsular Malaysia and Java, near the large cities where the anthropogenic emissions are strongest, and positive above the southeastern Sumatra fires. The difference in SO42 – F shows the reverse pattern: where the difference in SO2 F is negative, that in SO42 – F is positive. The anthropogenic emissions in the domain enhance the conversion of the SO2 released by the fires to SO42 – . This decrease in SO2 F is in contrast to the upper left panel in Fig. 7 which shows an increase in the total SO2 . While the anthropogenic emissions decrease SO2 F, the total SO2 is increased. The decrease in SO2 F occurs in the same areas as where the anthropogenic
Air Qual Atmos Health (2012) 5:277–292
emissions have increased the surface concentration of O3 (bottom right panel of Fig. 7). The increase of O3 by the anthropogenic emissions leads to the enhancement of the conversion of SO2 to SO42 – . The evidence that the secondarily produced compound O3 influences another secondarily produced compound, SO42 – , shows that the anthropogenic emissions are able to change the atmospheric lifetime of the fire pollution. This is a demonstration of non-linearity in the chemical system. As we looked at SO2 F to see how the anthropogenic pollution affected the fire emissions, we have looked at SO2 A to examine the influence of the fire emissions on the anthropogenic. The subtraction of SO2 A in experiment Anth-Volc from that in Anth-Volc-Fire (bottom row Fig. 9) shows that the difference in SO2 A is negative. The difference in SO42 – A is positive above the main fires and negative above peninsular Malaysia. The fire emissions are leading to the more rapid oxidation of SO2 A to SO42 – A. Above peninsular Malaysia, the SO42 – A is then being formed in a region with more precipitation (not shown), leading to a more rapid wash out of the SO42 – A, producing the negative difference in SO42 – A. The possibility that the anthropogenic emissions contributed to air quality exceedances caused primarily by the fire pollution, particularly in the vicinity of major cities, is relevant for the transboundary pollution issue. In Quah (2002), different approaches are discussed involving both Indonesia (the state where the fires occurred) and “victim states” including Singapore and Malaysia in fire prevention and fire reduction. All of the suggested mechanisms for reducing the firerelated haze events involve minimizing the fires within Indonesia. This is very important, and a clear, logical approach to prevent future environmental disasters
Fig. 8 The number of days during September–November 1997 when the Indonesian hourly air quality standard for O3 was exceeded at 13:00 for experiment Anth-Volc-Fire and the difference in Anth-Volc-Fire-Volc-Fire
Air Qual Atmos Health (2012) 5:277–292
289
Fig. 9 Difference in the average ground level concentration for September 1997 of SO2 F and SO42 – F for experiments Anth-VolcFire-Volc-Fire (top row) and of SO2 A and SO42 – A for experiments Anth-Volc-Fire-Anth-Volc (bottom row)
such as occurred during the 1997 fires. The theoretical results of this study suggest an additional approach for neighboring countries that are adversely affected by the fire-related haze: reducing urban air pollution during high-risk times. This may have the effect of keeping the atmospheric concentrations of dangerous pollutants in densely populated areas below the air-quality thresholds, reducing the health and economic consequences of the fires in major cities. If the fire emissions included in the scenario presented here were overestimated, the number of modeled air quality exceedances is greater than really occurred. The role of the anthropogenic emissions in the domain relative to the fire, in that case, will be greater.
Conclusions Indonesian air quality standards for O3 , SO2 , CO, and NO2 were simulated to have been exceeded during the
Indonesian fires of 1997. Due to sparse ground and air based measurements at the time, these simulations represent one possible scenario, our best attempt to capture the complex interactions between various emissions sources during this very important event. Results from this modeled scenario suggest that the RETRO fire emissions included in this study may be overestimated. Anthropogenic emissions were modeled to have extended the region where air quality standard exceedances may have occurred, most significantly for the secondary pollutant O3 in densely populated urban areas. Because the range of possible fire emissions is so great, it is unlikely the modeled number of emission standard exceedances depict reality correctly. The model results show us that the increased atmospheric concentration of O3 from the anthropogenic emissions in the domain increased the rate of conversion of SO2 released by the fires to SO42 – . This study distinguishing the roles of the different emission sources may help in creating solutions to reduce the harmful effects
290
of wildfire pollution. Large cities downwind from major fire events may benefit by reducing their urban pollution during such events, thereby reducing health and economic disturbances. The surface conditions present during this extreme event led to volcanic emissions serving only a minor role.
Acknowledgements We thank Philipp Weis and Elina Marmer for their help and discussion and Sebastian Rast, Álvaro Valdebenito, Julia Lee-Taylor, and two anonymous reviewers for reviewing the manuscript. We thank the German Climate Computing Center (DKRZ) and Johann Feichter for computer time to run these experiments and Ulrike Niemeier for providing the MOZART results that were used as boundary conditions. O3 measurements were kindly made available by Masatomo Fujiwara over Watukosek and by Seiichiro Yonemura over Petaling Jaya. CO measurements were made available by Hidekazu Matsueda. Andreas Richter and Mark Weber provided access to the GOME NO2 observations. Martin Schultz provided access to the RETRO emissions. M. Pfeffer was funded by the Ebelin and Gerd Bucerius ZEIT Foundation and by the American Association of University Women.
Open Access This article is distributed under the terms of the Creative Commons Attribution Noncommercial License which permits any noncommercial use, distribution, and reproduction in any medium, provided the original author(s) and source are credited.
References Aiken S (2004) Runaway fires, smoke-haze pollution, and unnatural disasters in Indonesia. Geograph Rev 94(1):55–79 Benkovitz C, Scholtz M, Pacyna J, Tarrason L, Dignon J, Voldner E, Spiro P, Logan J, Graedel T (1996) Global gridded inventories of anthropogenic emissions of sulfur and nitrogen. J Geophys Res 101(D22):29239–29253 Bouwman A, Lee D, Asman W, Dentener F, Van Der Hoek K, Olivier J (1997) A global high-resolution emission inventory for ammonia. Gl Biogeochem Cycles 11(4):561–587 Burrows J, Weber M, Buchwitz M, Rozanov V, LadstätterWeissenmayer A, Richter A, DeBeek R, Hoogen R, Bramstedt K, Eichmann KU, Eisinger M, Perner D (1999) The global ozone monitoring experiment (GOME): mission concept and first scientific results. J Atmos Sci 56:151– 175 Center for International Earth Science Information Network (CIESIN), Columbia University and Centro Internacional de Agricultura Tropical (CIAT) (2005) Gridded population of the world version 3 (GPWv3): Population Grids, Tech. rep., Socioeconomic Data and Applications Center (SEDAC), Columbia University, Palisades, NY. Available at: http://sedac.ciesin.columbia.edu/gpw. Accessed November 2010 Chandra S, Ziemke J, Min W, Read W (1998) Effects of 1997– 1998 El Niño on tropospheric ozone and water vapor. Geophys Res Lett 25(20):3867–3870 Chandra S, Ziemke J, Bhartia P, Martin R (2002) Tropical tropospheric ozone: implications for dynamics and bio-
Air Qual Atmos Health (2012) 5:277–292 mass burning. J Geophys Res 107(D14):4188. doi:10.1029/ 2001JD000447 Chang JS, Brost RA, Isaksen SA, Madronich S, Middleton O, Stockwell WR, Walcek CJ (1987) A three dimensional Eulerian acid deposition model: physical concepts and formulations. J Geophys Res 92:14681–14700 Davies S, Unam L (1999) Smoke-haze from the 1997 Indonesian forest fires: effects on pollution levels, local climate, atmospheric CO2 concentrations, and tree photosynthesis. For Ecol Manag 124:137–144 Dignon J, Eddleman H, Penner J (1994) A black carbon emission data base for atmospheric chemistry and climate studies. Technical report. Lawrence Livermore National Lab, Livermore, CA Duncan B, Bey I, Chin M, Mickley L, Fairlie T, Martin R, Matsueda H (2003) Indonesian wildfires of 1997: impact on tropospheric chemistry. J Geophys Res 108(D15):4458. doi:10.1029/2002JD003195 Energy Information Administration (2004) Indonesia: environmental issues. Technical report. Energy Information Administration. http://www.eia.doe.gov/emeu/cabs/indoe.html Fang M, Huang W (1998) Tracking the Indonesian forest fire using NOAA/AVHRR images. Int J Remote Sens 19(3): 387–390 Frankenberg E, McKee D, Thomas D (2004) Health consequences of forest fires in Indonesia. California Center for Population Research On-Line Working Papers Series, CCPR-030-04 Fujiwara M, Kita K, Kawakami S, Ogawa T, Komala N, Saraspriya S, Suripto A (1999) Tropospheric ozone enhancements during the Indonesian forest fire events in 1994 and 1997 as revealed by ground-based observations. Geophys Res Lett 23(16):2417–2420 Fujiwara M, Kita K, Ogawa T, Kawakami S, Sano T, Komala N, Saraspriya S, Suripto A (2000) Seasonal variation of tropospheric ozone in Indonesia revealed by 5-year groundbased observations. J Geophys Res 105(D2):1879–1888 GEIA (2006) Available at: http://www.aero.jussieu.fr/projet/ ACCENT/database_table_inventories.php. Accessed November 2010 GPCC (2007) Available at: http://gpcc.dwd.de/. Accessed November 2010 Granier C, Niemeier U, Müller J-F, Olivier J, Peters J, Richter A, Nües H, Burrows J (2003) Variation of the atmospheric composition over the 1990–2000 period. Tech. Rep. 6, POET, EU project EVK2-1999-00011 Halmer MM, Schmincke DJ, Graf HF (2002) The annual volcanic gas input into the atmosphere, in particular into the stratosphere: a global data set for the past 100 years. J Volcanol Geotherm Res 115:511–528 Hauglustaine D, Brasseur G, Levine J (1999) A sensitivity simulation of tropospheric ozone changes due to the 1997 Indonesian fire emissions. Geophys Res Lett 26(21):3305– 3308 Heil A (2007) Indonesian forest and peat fires: emissions, air quality, and human health. PhD thesis, Universität Hamburg. http://www.earthsystemschool.mpg.de/fileadmin/ user_upload/Documents/Theses/34_Thesis_Heil.pdf Heil A, Goldammer J (2001) Smoke-haze pollution: a review of the 1997 episode in Southeast Asia. Reg Environ Change 2:24–37 Hilton D, Fischer TP, Marty B (2002) Noble gases and volatile recycling at subduction zones. In: Porcelli D, Ballentine CJ, Weiler R (eds) Reviews in Mineralogy and Geochemistry— noble gases in Geochemistry and Cosmochemistry, vol 47. Min Soc Am, Washington DC, pp 319–370
Air Qual Atmos Health (2012) 5:277–292 Horowitz LW, Walters S, Mauzerall DL, Emmons LK, Rasch PJ, Granier C, Tie X, Lamarque JF, Schultz M, Tyndall G, Orlando J, Brasseur GP (2003) A global simulation of tropospheric ozone and related tracers: description and evaluation of Mozart, version 2. J Geophys Res 108(D24):4784. doi:10.1029/2002JD002853 Huffman G, Adler R, Arkin P, Chang A, Ferraro R, Gruber A, Janowiak J, McNab A, Rudolf B, Schneider U (1997) The Global Precipitation Climatology Project (GPCP) combined precipitation data set. Bull Am Meteorol Soc 78:5–20 Khandekar M, Murty T, Scott D, Baird W (2000) The 1997 El Niño, Indonesian forest fires and the Malaysian smoke problem: a deadly combination of natural and man-made hazard. Nat Hazards 21:131–144 Kita K, Fujiwara M, Kawakami S (2000) Total ozone increase associated with forest fires over the Indonesian region and its relation to the El Niño-southern oscillation. Atmos Environ 34:2681–2690 Kloster S (2006) DMS cycle in the ocean-atmosphere system and its response to anthropogenic perturbations. PhD thesis, Universität Hamburg. http://www.earthsystemschool.mpg. de/fileadmin/user_upload/Documents/Theses/Thesis_Kloster. pdf Koe L, Arellano A Jr, McGregor J (2001) Investigating the haze transport from 1997 biomass burning in Southeast Asia: its impact upon Singapore. Atmos Environ 35:2723– 2734 Ladstätter-Weißenmayer A, Meyer-Arnek J, Richter A, Wittrock F, Burrows J (2005) Tropospheric O3 over Indonesia during biomass burning events measured with GOME (Global Ozone Monitoring Experiment) and compared with trajectory analysis. Atmos Chem Phys Discuss 5:3105–3130 Langmann B (2000) Numerical modelling of regional scale transport and photochemistry directly together with meteorological processes. Atmos Environ 34:3585–3598 Langmann B, Heil A (2004) Release and dispersion of vegetation and peat fire emissions in the atmosphere over Indonesia 1997/1998. Atmos Chem Phys 4:2145–2160. www. atmos-chem-phys.org/acp/4/2145/ Matsueda H, Inoue H (1999) Aircraft measurements of trace gases between Japan and Singapore in October of 1993, 1996, and 1997. Geophys Res Lett 26(16):2413–2416 Matsueda H, Inoue H, Ishii M (1999) Large injection of carbon monoxide into the upper troposphere due to intense biomass burning in 1997. J Geophys Res 104(D21):26867– 26879 Mellor B, Yamada T (1974) A hierarchy of turbulence closure models for planetary boundary layers. J Atmos Sci 31:1791– 1806 Nakajima T, Higurashi A, Takeuchi N, Herman J (1999) Satellite and ground-based study of optical properties of 1997 Indonesian forest fire aerosols. Geophys Res Lett 26(16): 2421–2424 Newhall CG, Self S (1982) The volcanic explosivity index (vei): an estimate of explosive magnitude for historical volcanism. J Geophys Res 87:1231–1238 Nho EY, Le Cloarec MF, Ardouin B, Tjetjep WS (1996) Source strength assessment of volcanic trace elements emitted from the Indonesian arc. J Volcanol Geotherm Res 74:121– 129 Olivier JGJ, Bouwman AF, van der Maas CWM, Berdowski JJM, Veldt C, Bloos JPJ, Visschedijk AJH, Zandveld PYJ, Haverlag JL (1996) Description of EDGAR version 2.0: a set of global emission inventories of greenhouse gases and
291 ozone-depleting substances for all anthropogenic and most natural sources on a per country basis and on 1x1 grid. Tech rep, National Institute of Public Health and the Environment (RIVM), RIVM report nr. 771060 002. [TNO-MEP report nr. R96/119] Penner J, Eddleman H, Novakov T (1993) Towards the development of a global inventory of black carbon emissions. Atmos Environ 27A:1277–1295 Pfeffer M, Langmann B, Graf HF (2006) Atmospheric transport and deposition of Indonesian volcanic emissions. Atmos Chem Phys 6:2525–2537 Podgorny I, Li F, Ramanthan V (2003) Large aerosol radiative forcing due to the 1997 Indonesian forest fire. Geophys Res Lett 30(1):1028. doi:10.1029/2002GL015979 Quah E (2002) Transboundary pollution in Southeast Asia: the Indonesian fires. World Dev 30(3):429–441 Randerson J, van der Werf G, Giglio L, Collatz G, Kasibhatla P (2006) Global Fire Emissions Database, version 2 (GFEDv2), Data set, Oak Ridge National Laboratory Distributed Active Archive Center, Oak Ridge, Tennessee, USA. http://daac.ornl.gov/ Richter A, Burrows J, Nüß H, Granier C, Niemeier U (2005) Increase in tropospheric nitrogen dioxide over China observed from space. Nature 437:129–132. doi:10.1038/nature04092 Sastry N (2002) Forest fires, air pollution, and mortality in Southeast Asia. Demography 39(1):1–23 Schnetzler CC, Bluth GJS, Krueger AJ, Walter LS (1997) A proposed volcanic sulfur dioxide index (vsi). J Geophys Res 102:20087–20092 Schultz M (2007) Reanalysis of the tropospheric chemical composition over the past 40 years (RETRO)—a long-term global modeling study of tropospheric chemistry final report. Tech rep, 5th EU framework programme Schultz MG, Heil A, Hoelzemann JJ, Spessa A, Thonicke K, Goldammer JG, Held AC, Pereira JMC, van het Bolscher M (2008) Global emissions from wildland fires from 1960 to 2000. Glob Biogeochem Cycles 22, GB2002. doi:10.1029/2007GB003031 Simkin T, Siebert L (1994) Volcanoes of the world, 2nd edn. Geoscience Press in association with the Smithsonian Institution Global Volcanism Program, Tucson, CA Smolarkiewitz PK (1983) A simple positive definite advection scheme with small implicit diffusion. Mon Weather Rev 111:476–479 Spiro PA, Jacob DJ, Logan DJ (1992) Global inventory of sulfur emissions with 1◦ ×1◦ resolution. J Geophys Res 97:6023– 6036 Stockwell WR, Middleton P, Chang JS, Tang X (1990) The second generation regional acid deposition model: chemical mechanism for regional air quality modeling. J Geophys Res 95:16343–16367 Syahril S, Resosudarmo B, Tomo H (2002) Study on air quality in Jakarta, Indonesia: future trends, health impacts, economic value and policy options. Technical report. Asian Development Bank Thompson AM, Witte J, McPeters R, Oltmans S, Schmidlin F, Logan J, Fujiwara M, Kirchhoff V, Posny F, Coetzee G, Hoegger B, Kawakami S, Ogawa T, Johnson B, Vömel H, Labow G (2003) Southern hemisphere additional ozonesondes (shadoz) 1998–2000 tropical ozone climatology 1. Comparison with total ozone mapping spectrometer (toms) and ground-based measurements. J Geophys Res 108(D2):8238. doi:10.1029/2001JD000967 Tiedtke M (1989) A comprehensive mass flux scheme for cumulus parameterization in large-scale models. Mon Weather Rev 117:1778–1800
292 Tsutsumi Y, Sawa Y, Makino Y, Jensen J, Gras J, Ryan B, Diharto S, Harjanto H (1999) Aircraft measurements of ozone, NO(x) , CO, and aerosol concentrations in biomass burning smoke over Indonesia and Australia in October 1997: depleted ozone layer at low altitude over Indonesia. Geophys Res Lett 26(5):595–598 Wooster M, Ceccato P, Flasse S (1998) Indonesian fires observed using AVHRR. Int J Remote Sens 19(3):383–386
Air Qual Atmos Health (2012) 5:277–292 Yonemura S, Tsuruta H, Kawashima S, Sudo S, Peng L, Fook L, Johar Z, Hayashi M (2002a) Tropospheric ozone climatology over peninsular Malaysia from 1992 to 1999. J Geophys Res 107(D15):4229. doi:10.1029/2001JD000993 Yonemura S, Tsuruta H, Maeda T, Kawashima S, Sudo S, Hayashi M (2002b) Tropospheric ozone variability over Singapore from August 1996 to December 1999. Atmos Environ 36:2061–2070