International Archives of the Photogrammetry, Remote Sensing and Spatial Information Sciences, Volume XXXIX-B7, 2012 XXII ISPRS Congress, 25 August – 01 September 2012, Melbourne, Australia
OBJECT-BASED CHANGE DETECTION USING HIGH-RESOLUTION REMOTELY SENSED DATA AND GIS N. Sofina a, M. Ehlers b a
University of Osnabrueck, Institute for Geoinformatics and Remote Sensing, 49076 Osnabrueck, Barbarastrasse 22b, Germany -
[email protected] b University of Osnabrueck, Institute for Geoinformatics and Remote Sensing, 49076 Osnabrueck, Barbarastrasse 22b, Germany -
[email protected] Commission VII, WG VII/5
KEY WORDS: Change Detection, Geographic Information Systems (GIS), Detected Part of Contour, Generation of Features, Data Mining, GIS GRASS, Python
ABSTRACT: High resolution remotely sensed images provide current, detailed, and accurate information for large areas of the earth surface which can be used for change detection analyses. Conventional methods of image processing permit detection of changes by comparing remotely sensed multitemporal images. However, for performing a successful analysis it is desirable to take images from the same sensor which should be acquired at the same time of season, at the same time of a day, and – for electro-optical sensors - in cloudless conditions. Thus, a change detection analysis could be problematic especially for sudden catastrophic events. A promising alternative is the use of vector-based maps containing information about the original urban layout which can be related to a single image obtained after the catastrophe. The paper describes a methodology for an object-based search of destroyed buildings as a consequence of a natural or man-made catastrophe (e.g., earthquakes, flooding, civil war). The analysis is based on remotely sensed and vector GIS data. It includes three main steps: (i) generation of features describing the state of buildings; (ii) classification of building conditions; and (iii) data import into a GIS. One of the proposed features is a newly developed ‘Detected Part of Contour’ (DPC). Additionally, several features based on the analysis of textural information corresponding to the investigated vector objects are calculated. The method is applied to remotely sensed images of areas that have been subjected to an earthquake. The results show the high reliability of the DPC feature as an indicator for change.
investigation based on different acquisition angles of the images. This paper presents a GIS-based approach for the detection of destroyed buildings which were affected by a catastrophic event like an earthquake, a landslide or a military action. The methodology is based on the integrated analysis of vector data containing information about the original urban layout and remotely sensed images obtained after a catastrophic event. The proposed method was applied to damage mapping after the earthquake in Qinghai, China (2010). GIS information was obtained by digitizing from pre-earthquake images. The performed experiments indicate that a GIS-based analysis for change detection can essentially improve the potential of remotely sensed data interpretation and can be considered as a powerful tool for the detection of destroyed building. The proposed methodology was developed solely within the Open Source software environment (GRASS GIS, Python, Orange). The use of Open Source software provides an innovative, flexible and cost-effective solution for change detection analyses.
1. INTRODUCTION Since the 20-th century the integration of cartography, Geoinformatics, and remote sensing technologies has been developed due to rapid technological advances. This evolution implied a number of derivative scientific directions and consolidation of conventional and digital cartographic techniques. The technological progress in remote sensing was one of the most important origins of this integration. Its influence on the cartography is many-folded. The main aspect is that remotely sensed images are considered as maps which lead to the development of new photogrammetry and image processing methods. A second origin of the integration tendencies was the development of geoinformation technologies. In recent years the application of GIS has offered the greatest potential for processing large volumes of multi-source data (Ehlers et al., 1989). For change detection of the Earth’s surface the development of methods based on integrated analysis of vector and image data is a point of general interest. The majority of change detection methods address land-use change dynamics (see, for example, Centeno & Jorge, 2000; Lo & Shipman, 1990; Li, 2009; Mattikalli, 1995; Weng, 2002) and only a few deal with damage assessment. Samadzadegan & Rastiveisi (2008) used information from pre-event vector maps and post-event satellite images to compare different textural features for extracted building vector. Chesnel et al. (2007) used a pair of very high resolution images of a crisis region together with GIS data for
2. STUDY AREA To assess the effectiveness of the proposed approach, the experiments were conducted using a high-resolution panchromatic QuickBird image acquired after the earthquake that struck Yushu, Qinghai, China on April 14, 2010 with a magnitude of 6.9Mw. GIS information was obtained by digitizing from pre-earthquake images.
345
International Archives of the Photogrammetry, Remote Sensing and Spatial Information Sciences, Volume XXXIX-B7, 2012 XXII ISPRS Congress, 25 August – 01 September 2012, Melbourne, Australia
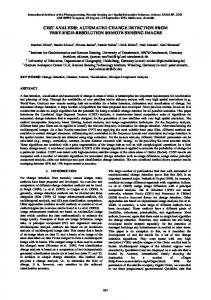
feature ‘Detected Part of Contour’(DPC) that characterizes, which part of the building contour can be detected in the remotely sensed image. For an investigation of the area within a building contour several features based on textural information can be analysed. The investigated images can have different quality depending on atmospheric and brightness conditions. In order to reduce the influence of such effects, the images have to be corrected or filtered. Consequently, before starting the feature calculation process a brightness normalization across the satellite image is performed using homomorphic filtering (Gonzalez & Woods, 2002; Delac et al., 2006). This is a frequency domain filtering, which provides the suppression of low frequency variation due to the illumination by taking the logarithm of the image intensity (that is a product of illumination and reflectance) before a high-pass filtering. The homomorphic filtering facilitates both: image brightness normalization and contrast increase (e.g., building edges and fragments of destruction). Finally, a binary classification of building states and a visualisation of the result damage map conclude the change detection technique (Figure 2).
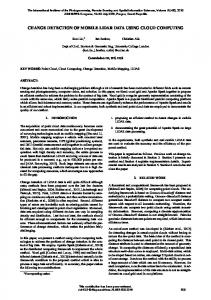
From the available data set an area of 2700×1487 pixels was selected as a test image and the number of the extracted vector objects was limited to the related test area - 610 objects (Figure 1).
Figure 2. Steps involved in object-based change detection. 3.1
Detected Part of Contour
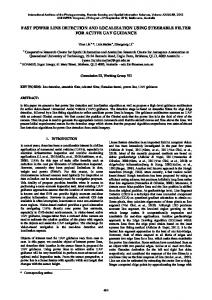
The ‘Detected Part of Contour’ (DPC) feature was developed to evaluate the integrity of building contours in the post-event images. If the investigated building has an intact contour the DPC value reaches its maximum (i.e. 100%). The main steps of the DPC calculation are presented in Fig. 3.
Figure 1. Test data set. Post-event image overlaid with building layer from the vector map. Satellite image courtesy of Digital Globe (©Digital Globe 2010). In order to verify the final result of our change detection the ground-truth information containing the state of buildings was initially identified by a visual comparison of the test data.
3. METHODOLOGY To start a comparative analysis of two different data sources it is important to elucidate the knowledge that can be gathered from the available data sets. The remotely sensed image is in a raster format storing data as a regular array of pixels whereas the vector data are composed of three basic elements: points, lines and polygons. Due to the distinctions the vector and raster data provide different types of information. The vector data model presents objects with well-defined boundaries and their coordinates whereas the raster data model describes a situation at this place. Thus, the information about a building contour geometry and location as well as the area inside the building contour can be extracted from the available data. In order to assess the integrity of the building contours we developed a
Figure 3. Calculation of DPC.
346
International Archives of the Photogrammetry, Remote Sensing and Spatial Information Sciences, Volume XXXIX-B7, 2012 XXII ISPRS Congress, 25 August – 01 September 2012, Melbourne, Australia
(
Firstly, an edge detection filter is applied to the remotely sensed image in order to extract the contours of buildings. In our study the Canny edge detector is used. Additionally, we adjusted the first derivative operator (Sobel operator) to calculate the derivatives for horizontal and vertical directions (Gx, Gy). The main point of this analysis is the calculation of building contour orientations:
) )
)(
{((
)) ( ) (
(
( (
)
) (
( )
(
{(( ) ( ) } )
))
)(
{((
) )
(
(
)
}
(
)
}
)
)) ( ) ( )
)
(3) ( )
(1) # denotes the number of elements in the set and B is the set of pixels from building area selected by the mask. The matrix has to be normalized to remove a dependency on the building size. The following normalization can be used:
Thus, the resulting image presents the objects contours, where pixels have values corresponding to their direction. The pixels that do not belong to the contour are given a “no data” value. Secondly, we extract control points from the vector objects. In the vector map the buildings are symbolized by polygons. The distance between two polygon’s vertexes is partitioned into segments. At the centre of each segment a control point is defined. Thirdly, a contour direction at the position of the control points is calculated. Finally, the algorithm examines the contour image (i.e. the result of the edge detection process) for pixels with appropriate contour direction at the position of each control point within the specified study window. It is assumed, that in the case of an intact contour the window has to contain a number of contour pixels equal to its size. Consequently, the DPC is defined as the ratio of the pixel number found on the raster contour and the number expected for the intact building.
(
∑
(
∑
∑
)
(
)
(4)
)
(5)
R is a normalization constant and 𝑁 is the number of grey levels in the input image (in our study 𝑁 ). Among different textural characteristics proposed by Haralick et al. (1973) we concentrated on the features that describe image homogeneity (Table 1). Textural feature
Equation
Angular Second Moment (ASM)
)
(
𝐴𝑆𝑀
∑ ∑{ (
Description Measure of uniformity. High values correspond to very similar image texture.
)}2
(2) 𝑒
Inertia
Here 𝑁 is the number of pixels found in the i-th study window, P is the size of the study window in pixels, 𝑁 is the number of study windows (or control points). More detailed information on the DPC calculation can be found in Sofina et al. (2011).
Inverse Difference Moment (IDM)
𝑀
∑ ∑(
∑∑
+(
)2 (
)
Characterizes availability of sharp borders and contours.
Measures of homogeneity. High ( ) indicate )2 homogeneous texture.
local values highly image
Table 1. Calculated textural features. 3.2
Calculation of textural features Besides the commonly used average value of the angular features we include also minimum and maximum values as inputs into the classifier.
Since building roofs are mostly visible in the remotely sensed images, we focus our analysis on them. If the building is damaged or destroyed, the texture of its roof has changed. The satellite image represents these changes that can be identified by texture analysis. One of the most effective approaches of texture analysis is the grey value co-occurrence matrix method that describes the grey value relationships in the neighbourhood of the current pixel (Haralick et al., 1973). Conventional techniques of textural feature calculation exploit a fixed rectangular sliding window for the calculation of a greytone spatial-dependence matrix. The object-oriented GIS approach enables an image analysis that is restricted to only the area of the investigated object. In order to analyse the image area corresponding to the building, a small fragment containing the building is cut out from the image under investigation. For the obtained picture a binary mask is created, which allows the selection of the pixels belonging to the study area. Assuming that only pixels from the building area have to be used for calculation of textural features, the equations for grey-tone spatial-dependence matrices can be modified as follows: ( (
) )
(
{(( )
)( }
))
(
3.3
Feature selection
A known problem of data classification is the reduction of the dimensionality of the feature space and redundant information. In our study the potential to separate the objects into two classes is a decision criterion of the feature selection. As can be observed in Figure 4 the application of the maximum of angular texture features enables a better object separation then the application of their average. The calculation of average values shows a loss of information about the texture orientation and results - as a consequence – in a worse performance. At the same time, the maximum values of the angularly features are significant if the buildings are intact.
)
347
International Archives of the Photogrammetry, Remote Sensing and Spatial Information Sciences, Volume XXXIX-B7, 2012 XXII ISPRS Congress, 25 August – 01 September 2012, Melbourne, Australia
Correct class
on April 2010 and a related vector map containing 610 objects corresponding to the pre-event urban situation. After the feature extraction process and the analysis of the calculated features the building conditions are calculated by an unsupervised k-means clustering. The following confusion matrix shows the result of the experiment.
Figure 4. Randomly selected objects present the variation of textural features for intact (top) and destroyed (bottom) buildings.
Table 2. Confusion matrix. C1 – intact buildings, C2 –destroyed buildings. The classification accuracy of 78% demonstrates the ability of this method to detect destroyed buildings. The independent features that depict the different types of the information are prerequisite to the sufficient result of the analysis. Furthermore, the application of the maximum value of the angular textural features instead of the generally used average values leads to a significant improvement. Considering the intact and damaged building separately, we observe that average values decreases feature performance and consequently the change detection accuracy. Detailed analysis of the results shows that the main classification errors are due to the image quality and rectification errors; for example, shadow from a building covering another one, not well defined destruction that cannot be recognized as a heterogeneity, and incorrect position of vector objects. The object-oriented GIS technology makes it possible to concentrate on the investigation of specified objects, thereby reducing the false alarms which are due to natural changes in the environment and not to buildings destruction. A subset of the generated damage map is shown in Figure 6.
Thus, using maximum and minimum of the angular textural features, we can exploit the presence of the textural orientation for building condition identification. The use of the average values of the angular features reduces this phenomenon. The selection of features is based on the analysis of the frequency distribution histograms (Figure 5). Consequently, the maximum value of the angular features for homogeneity (IDM_max) is taken for the classification together with the DPC.
Figure 5. Frequency distribution histograms of the selected features. Red values correspond to destroyed buildings, blue values to intact buildings. 3.4
C1 C2
Prediction C1 C2 175 93 268 40 302 342 215 395 610
Classification
After selection of the most relevant features the building condition is calculated as a binary classification. There are many classification techniques implemented in the Open Source data mining software ‘Orange’. However, we are of the opinion that an optimally selected feature set is an indispensable condition for a successful classification. Unlike supervised techniques, the utilization of unsupervised classification does not require a suitable training data set which is difficult to adapt for all types of constructions. Reasoning from this assumption we use an unsupervised k-means clustering with the Euclidean distance in our study. The main rational is the simplicity of its implementation and its performance and applicability even on large data sets. For the clustering, the centres of cluster are initially chosen arbitrarily. Then every point is assigned to the cluster according to a similarity measurement, for example, distance. The centres are recomputed as centres of mass of their assigned points. The algorithm comes to an end, when there are no changes by the next iteration or when the number of changes is below a given threshold.
Figure 6. Change detection result by the proposed method. Red polygons indicate destroyed building, blue polygons intact buildings.
5. SOFTWARE ENVIRONMENT The methodology is implemented using Open Source software components. The processing of vector and raster data sets including vector data selection and conversion, and data visualization is performed in the GIS GRASS (Geographic Resources Analysis Support System) environment (Neteler & Mitasova, 2004). It is currently the most popular system among
4. RESULTS AND DISCUSSION The developed change detection algorithm is evaluated using remotely sensed image data acquired after the Yushu earthquake
348
International Archives of the Photogrammetry, Remote Sensing and Spatial Information Sciences, Volume XXXIX-B7, 2012 XXII ISPRS Congress, 25 August – 01 September 2012, Melbourne, Australia
the Open Source geographic information systems and provides an access to over 500 modules for manipulation with 2d and 3d raster and vector data. Its functionality can be expanded by the creation of new modules using different programming languages (Python, C, C++, MATLAB). The algorithms for calculation of Detected Part of Contour (DPC) and textural features are written in Python (www.python.org). The algorithm for the Canny edge detection is implemented using Python Image Library and OpenCV Python Library. The programs are integrated as GRASS GIS modules. The Open Source machine learning system Orange (Boulicaut, 2004) is used for data analysis, classification and visualization.
Li, D., 2009. Remotely sensed images and GIS data fusion for automatic change detection. International Journal of Image and Data Fusion, 1(1), pp. 99-108. Mattikalli, N.M., 1995. Integration of remotely-sensed raster data with vector-based geographical information system for land-use change detection. International Journal of Remote Sensing, 16(15), pp. 2813-2828. Neteler, M., Mitasova, H., 2004. Open Source GIS: A GRASS GIS Approach. Second Edition. Kluwer Academic Publishers/Springer, Boston, p. 419. Samadzadegan, F., Rastiveisi H., 2008. Automatic detection and classification of damaged buildings, using high resolution satellite imagery and vector data. The International Archives of the Photogrammetry, Remote Sensing and Spatial Information Sciences, XXXVII(B8), pp. 415-420. Sofina, N., Ehlers, M., Michel, U., 2011. Object-based detection of destroyed buildings based on remotely sensed data and GIS. Earth Resources and Environmental Remote Sensing/GIS Applications II. Proc. of SPIE 8181. Weng, Q., 2002. Land use change analysis in the Zhujiang Delta of China using satellite remote sensing, GIS and stochastic modeling. Journal of Environmental Management, 64, pp. 273284. http://grass.osgeo.org/ www.python.org/ www.pythonware.com/ http://opencv.willowgarage.com/documentation/python/index.ht ml
6. CONCLUSION In this paper, we presented a change detection methodology for buildings that is based on the combined analysis of two different data types – remotely sensed image and vector information. The integrated analysis enables the investigation of both, the building contour integrity and the area inside the contour. In our study, we developed a new feature DPC for assessment of the building contour integrity. Calculation of textural features is based on the Haralick features which have been adapted to the GIS requirements. Consequently, our research contributes to the integration of remote sensing and GIS technologies. Despite of the promising result of the building condition classification, future studies of different cases may require the use of more sophisticated classification techniques than the employed clustering approach. In the future, investigations will focus on solving the identified classification problems that can reveal new features and improve further experimental results.
ACKNOWLEDGEMENTS This work uses Open Source software components such as GRASS GIS, Python programming language and Orange data mining software. The authors would like to thank the development teams for providing and supporting the software. The authors are also grateful to Digital Globe for providing the image data, which made our investigation possible. Special thanks go to the referees for their careful review and valuable comments that helped to improve the paper.
REFERENCES Boulicaut, J.-F., 2004. Orange: from experimental machine learning to interactive data mining. PKDD, LNAI(3202), pp. 537-539. Centeno, S., Jorge, 2000. Integration of satellite imagery and GIS for land-use classification purposes. International Archives of Photogrammetry and Remote Sensing,XXXIII(B7). Chesnel, A.-L., Binet, R.,Wald L., 2007. Damage assessment on buildings using very high resolution multitemporal images and GIS. 5-th International Workshop on Remote Sensing for Disaster Management Applications. Delac, K., Grgic, M., Kos, T., 2006. Sub-image homomorphic filtering technique for improving facial identification under difficult illumination conditions. International Conference on Systems, Signals and Image Processing. Budapest, Hungary, Sept. 21-23. Ehlers, M., Edwards, G., Y. Bedard, 1989. Integration of remote sensing with geographic information systems: a necessary evolution. Photogrammetric engineering and remote sensing, 55(11), pp. 1619-1627. Gonzalez, R.C., Woods, R.E, 2002. Digital Image Processing. Prentice Hall, New Jersey, p.793. Haralick, R.M., Shanmugam, K., Its'hak, D., 1973. Textural features for image classification. IEEE Trans. on Systems, Man and Cybernetics, SMC-3(6), pp. 610-621. Lo, C.P., Shipman, R.L., 1990. A GIS approach to land-use change dynamics detection. Photogrammetric engineering and remote sensing, 56(11), pp. 1483-1491.
349