Estuarine, Coastal and Shelf Science 208 (2018) 219–234
Contents lists available at ScienceDirect
Estuarine, Coastal and Shelf Science journal homepage: www.elsevier.com/locate/ecss
Object-based classification of sub-bottom profiling data for benthic habitat mapping. Comparison with sidescan and RoxAnn in a Greek shallow-water habitat
T
E. Fakirisa,∗, D. Zouraa,1, A. Ramfosb, E. Spinosc, N. Georgioua, G. Ferentinosa, G. Papatheodoroua a
Laboratory of Marine Geology and Physical Oceanography, Department of Geology, University of Patras, 265 00, Rion, Greece Department of Fisheries and Aquaculture Technology, Technological Educational Institution of Western Greece, 302 00, Messolonghi, Greece c Department of Fisheries, Regional Section of Kefalonia, Region of Ionian Islands, Greece b
A R T I C LE I N FO
A B S T R A C T
Keywords: Benthic habitat mapping Marine protected area Sidescan sonar Sub-bottom profiler RoxAnn Kefalonia
Although Ground Discrimination Systems and Multi-beam Echo Sounders tend to be the preferred tools towards gaining knowledge about the seafloor, numerous surveys have been and are still being performed by simultaneously using conventional sidescan Sonars (SSSs) and Sub-Bottom Profilers (SBPs). This is in respect of gaining fast, wide-scale, three-dimensional imaging of the seafloor and its substrate, extracting maximum value from a single, time-limited survey. The combination of these two systems offers good knowledge of both the stratigraphy and the habitat extents on the seabed, aspects often linked to each other. However, a basic drawback is the inconsistency between their mapping scales, as SSS produces high-resolution backscatter maps and SBP produces substrata information of high vertical but very low horizontal density. In this work, 100-kHz SSS and 3.5-kHz SBP data, collected simultaneously during a geophysical survey at a 5.5 × 3.3 km, shallow (10–50 m depth) Marine Protected Area in Lourdas Gulf, Kefalonia Island, Greece, underwent post-processing and analysis, to extract numerous statistical features from both the seafloor and its substrate, towards automated seafloor classification. The SSS mosaic image was subjected to segmentation, coupling the mean-shift algorithm and unsupervised classification. The SBP images were processed using edge enhancement/detection techniques and numerous features were extracted regarding the acoustic appearance, transparency and density of the automatically detected seismic reflectors. Supervised classification of the SBP derivatives exhibited their high discrimination ability between different sea-bed types, making them suitable for ground discrimination. Linking of the SBP classes to the SSS segments (object-based analysis) led to full coverage, high detailed benthic habitat maps. Training of the classifiers was carried out using data points in proximity to underwater video inspected areas, while validation was performed using a manual habitat map made by expert interpreters. Three marine habitat classification schemes have been examined separately, namely NATURA, EUNIS and a custom one, successively including more Habitat types in a hierarchical manner, as to validate the method under different complexity levels. The SSS mosaic, as well as an independent data-set acquired using RoxAnn acoustic ground discrimination system, were also used, each individually, to classify Lourdas Gulf in yet again an object-based manner. The latter showed that SBP derivatives led to an equally significant and in most cases better classification of benthic habitats, compared to those produced by the widely tested and documented SSS and RoxAnn systems, implying that they deserve further exploitation.
1. Introduction Benthic habitat maps are an important means of providing the basis for coastal management and ecological analysis. Habitat mapping of protected areas in EU is not only an obligation of the NATURA 2000 (Council Directive 92/43/EEC on the Conservation of natural habitats
∗
1
Corresponding author. E-mail address:
[email protected] (E. Fakiris). Currently at: School of Earth and Environment, University of Leeds, UK.
https://doi.org/10.1016/j.ecss.2018.04.028 Received 7 November 2017; Received in revised form 24 April 2018; Accepted 25 April 2018 Available online 01 May 2018 0272-7714/ © 2018 Elsevier Ltd. All rights reserved.
and of wild fauna and flora) network members towards its solid implementation, but more importantly, it is the background for the creation of management plans and the decision of conservation priorities (Alexandridis et al., 2009). The determination of the spatial distribution of habitats and their specific characteristics is fundamental for the comprehension and reduction of the existing pressures on the
Estuarine, Coastal and Shelf Science 208 (2018) 219–234
E. Fakiris et al.
since they use single beam systems, they provide information from a rather narrow ‘footprint’ below the vessel. As such, AGDS systems do not provide detailed full area coverage, like the swath sonars do, nor do they provide high spatial resolution, since the produced maps include interpolated values among the tracks (Penrose et al., 2005). Swath sonars have taken the lead nowadays in automated habitatmapping and especially the MBES systems. Various swath-sonar seafloor classification software tools have been popular among researchers, including academic ones e. g TexAn (Blondel, 1996; Blondel et al., 1998; Micallef et al., 2012) and SonarClass (Fakiris and Papatheodorou, 2009) and commercial ones e.g. QTC Side and Multi-view (Preston et al., 2001; McGonigle and Collier, 2014), Geocoder (Rzhanov et al., 2012) as well as other novel ones (Lucieer et al., 2013). There is a growing literature that makes use of MBES for benthic habitat mapping (Hughes Clarke, 2017), taking advantage of the wide spectrum of information that it provides, including backscatter, bathymetry and angular backscatter intensity. Quantification of angular backscatter intensity is gaining popularity over the years and tends to be a standardized procedure for seafloor sediment and substrate characterization (Fonseca et al., 2009; Che Hasan et al., 2012a, b; Rzhanov et al., 2012). However, among the disadvantages of traditional MBES is the relatively low resolution that they provide, although newer systems tend to compete SSS systems in sample densities in shallow waters. The above limits severely the backscatter texture content of the recorded seafloor or even reduces the resolution of the analysis down to a full swath strip, as in the case of Angular Range Analysis (ARA) (Fonseca et al., 2009). What is more, in shallow habitats MBES systems lack in seafloor coverage, as their swath width is proportional to depth. On the contrary, SSS systems offer very high-resolution backscatter images of the seafloor, suitable for detailed habitat mapping through texture analysis (Huvenne et al., 2002; Lucieer, 2008; Le Bas and Huvenne, 2009; Kiparissis et al., 2011; Papatheodorou et al., 2012), also retaining high coverage by keeping swath ranges unchanged throughout the full survey. What is considered an important drawback of SSS is its lack of secondary information regarding bathymetry and angular dependency of returning echoes. This way, SSS sonographs, as opposed to MBES, cannot be accurately corrected for radiometric and geometric artifacts (Fakiris et al., 2012). Still, as in the case of pinger SBPs, SSS is a traditional marine remote sensing system, originated back to 60s, with huge amounts of data that need to be re-processed. Moreover, combined SSS and SBP towed systems have been and still are very common in multidisciplinary seafloor exploration tasks. Object Based Image Analysis (OBIA), has become a standard practice for gaining detailed delineations of habitats through swath sonar images. It involves similar pixels being grouped into connected segments (objects) that are classified using some intrinsic information. It has mostly been applied to MBES data (Rzhanov et al., 2012; Che Hasan et al., 2012a, b; Lucieer et al., 2013; Montereale et al., 2016), where the objects are extracted through segmentation of MBES backscatter mosaics and the available information (bathymetric, backscatter and angular backscatter intensity derivatives or acoustic modeling parameters) is averaged within each segment. Segmentation practices are also met in SSS analysis works using backscatter information for habitat mapping (Lucieer, 2008; Fakiris, 2017). OBIA has not been used yet with single-beam systems (AGDS or SBP) for habitat mapping, although Brown et al. (2005) had early noted the perspectives of using swath sonars to aid extrapolation of classification points with some spatial consistency. Inspired by the above works, in this study object-oriented classification of point data derived by SBP or RoxAnn data is pursued using objects extracted from SSS backscatter mosaics. This work is an effort to exhibit how high frequency SBP systems (in this case a 3.5-kHz one), properly processed, can successfully be used for acoustic ground discrimination and how their low spatial coverage issue can be treated by means of object based analysis relied on sidescan sonar (SSS) data. To support the efficiency of the proposed method, a thorough comparison between benthic habitat classification results
ecosystem (Henriques et al., 2015). Developing optimal methods for rapid, cost-effective, multi-purpose mapping, can aid the management needs of the marine environment. The preferred procedure nowadays for seafloor characterization is to combine ground-truthing and acoustic remote sensing methods, with the latter ones tending to be Acoustic Ground Discrimination Systems (AGDS) (e.g. Hamilton et al., 1999) and Multi Beam Echo Sounders (MBES) (e.g. Rzhanov et al., 2012; Che Hasan et al., 2012a, b). However, little work is available regarding automated benthic habitat characterization through SBPs. SBPs are likely to reveal meaningful information about habitats, by linking them to substrate characteristics that favor their development or even to discriminate them through discovering their unique acoustic seismic signatures. SBPs provide insights into the physical properties of the seabed and subsurface that aids the interpretation of other remote sensing data, such as SSS, single and multibeam echosounder data, video and satellite imagery. Sub-bottom reflectors provide a basic measure of the bottom depth to the bedrock, which indicates sediment accumulation or erosion. They can also discriminate relatively hard sedimentary bottoms from bedrock reefs, which may not be visually discerned when overlaid by benthic organisms. The dynamics of benthic environments can also be assessed by surface and subsurface bedforms, impossible to be discerned by other means of geoacoustical exploration. Damuth (1975) developed an empirical surface sediment classification system for 3.5-kHz echograms based on simple echo characteristics of the seafloor. This regards the clarity and continuity of echoes and includes, among others, terms such as “distinct”or “prolonged” echoes and “hyperbolas”. Alevizos et al. (2017) used a SES-2000 parametric sonar to aid benthic habitat classification via visual interpretation of the SBP data. Quantitative work on the physical properties of the seabed can be achieved by the analysis of the acoustic reflection response with much information gained through the characteristics of subsurface reflectors and the thickness of surficial sediments (Penrose et al., 2005). Studies attempting to quantitatively discriminate bottom types from profiling data involve model based and phenomenological approaches. Model-based methods (Pouliquen and Lurton, 1992) include sediment coefficients' extraction from the first returns or the full SBP echoes, such as the reflection (Kim et al., 2002; Saleh and Rabah, 2016), the impedance and the attenuation (LeBlanc et al., 1992; Kim et al., 2002) coefficients as well as seismic inversion (Davis et al., 2002), all attempting to directly model sediment characteristics without the need of extensive ground-truthing. Phenomenological approaches involve classification of the bottom types by correlating them to statistically derived parameters of the seismic data, and need extensive training samples to build accurate classification models. Examples include cluster analyses of whole datasets (Milligan et al., 1978), statistical properties of the bottom type based on time-frequency analysis (Andrieux et al., 1995), application of a similarity index to the uncorrelated principal components of the echo signature (Lee et al. 2009; Kim et al., 2002) and application of image based analysis using texture (Yegireddi and Thomas, 2014). All aforementioned methods have been applied to shallow, high frequency, seismic systems, such as chirp and parametric SBPs, rather than to pinger (i.e. 3.5-kHz) ones, due to the reduced noise and the increased resolution the first ones offer. Still, 3.5-kHz SBP retain adequate levels of information to achieve habitat discrimination (Penrose et al., 2005). 3.5-kHz systems have been widely used since the 1960's, to gain seafloor penetration of 50 m or greater and so they constitute a significant source of information that needs to be reprocessed under new perspectives. As opposed to SBP systems, there is extensive work regarding acoustic benthic habitat mapping employing single beam AGDS systems and swath sonars. RoxAnn is the most broadly used AGDS system and it has extensively been studied for its efficiency, benefits and limitations during the previous years (Hamilton et al., 1999; Brown et al., 2005; Henriques et al., 2015). AGDS systems have in general low operational cost and high discrimination ability (Le Bas and Huvenne, 2009), but 220
Estuarine, Coastal and Shelf Science 208 (2018) 219–234
E. Fakiris et al.
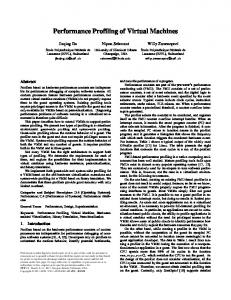
Fig. 1. The study area in the Western part of Lourdas Gulf MPA and the survey lines conducted using SSS, SBP, RoxAnn and tow camera systems.
the conservation of habitat types 1110 (sandbanks), 1120 (Posidonia beds) and 1170 (reefs) along with the species Caretta caretta sea turtle, Monachus monachus monk seal and Tursiops truncatus bottlenose dolphin which are present in the area and protected by various national and international laws and agreements. The only available spatial information in Lourdas Gulf regarding benthic habitats can be derived from a recent work of Topouzelis et al. (2018), who published a map of P. oceanica meadows in the Greek territorial waters as resulted through semi-automated supervised classification of Landsat-8 satellite images. However, this map exhibits poor accuracy in Lourdas Gulf, as indicated by a less than 60% precision when compared to the ground truth data of the present study. Some general geological and morphodynamical settings of the study area are discussed below in regard to Fig. 2, which provides three characteristic seismic sections and the SSS mosaic. The seismic stratigraphy of the area is divided in two major units. The upper unit (Unit A) refers to a hemi-pelagic sedimentation regime, thickening with depth. This sedimentary unit consists of parallel, continuous, weak reflectors of medium frequency. The NW shallow part of the gulf is covered by sand and seagrass (P. Oceanica, C. Nodosa), the latter being a strong reflector and thus preventing further penetration of the acoustic energy in the sediments. In seismic line 2, the sedimentary sequence of Unit A exhibits a “wavy” character (as defined by Mitchum et al., 1977),
derived by SBP, SSS or RoxAnn in a shallow water habitat in Lourdas Gulf, Kefalonia, Greece is presented and discussed. The remainder of this paper is organized as follows: Section 2 describes the materials and methods, including an overview of the data acquisition and preprocessing methods, as well as the principles for manual and automated seafloor characterization. Section 3 provides the benthic habitat mapping results as well as a thorough evaluation of the proposed automated seafloor characterization techniques. Finally, Section 4 provides an in-depth analysis of the results along with a discussion for general guidelines and future perspectives. 2. Materials and methods 2.1. Study area The study area is located at the southern part of Kefalonia Island (Ionian Sea, Greece) in the open Lourdas Gulf (Fig. 1). Lourdas Gulf has been included in the NATURA 2000 network as a marine site of Community Importance (SCI) in 2006 and as a Special Area of Conservation (SAC) in 2011 under the code GR2220004. The total surface of the protected area is 37.36 km2 and is almost exclusively marine extending between the coastline and the isobath of 35 m, approximately 1–1.5 nm from the coast. The area was included in the NATURA 2000 network for 221
Estuarine, Coastal and Shelf Science 208 (2018) 219–234
E. Fakiris et al.
Fig. 2. The SSS mosaic, processed with Geocoder overlaid with the general bathymetry of the area (left) and three indicative seismic profiles (right).
the RoxAnn survey. The ground-truth surveys were planned so that all distinct seafloor types, having been recognized through interpreting either the SSS or the RoxAnn data, have been inspected (Fig. 1). In the lack of an underwater positioning system, adequate positioning of the underwater imagery was performed in the post processing stage through landmarks, by collecting salient bottom features, evident both in the video and in the SSS mosaic, calculating the layback of the towcamera to the vessel and accounting for the mid-distances using splines interpolation.
following the morphology of the seabed and implying intense coastal circulation patterns and particularly sea currents of cyclonic direction causing differential sedimentation. Similarly, a deepening at the foot of the SW rocky outcrop (reef), suggests current erosion. Intense hydrodynamics in the area are also clearly revealed through the presence of two irregularly wedge-shaped sand-ripple regions on the NW shallower parts of the study area, one shown in detail in Fig. 3 and corresponding to custom class C5 of Table 2. A semi-continuous, opaque reflector of low to medium backscatter strength, representing the acoustic basement (bedrock) of the area, is defining the top boundary of Unit B. Unit B is characterized by high reflectivity in the SW at the SSS mosaic, where it outcrops forming a rocky reef. The above findings define a high energy marine environment, with steep changes of sedimentation rates and erosional patterns, constituting a seafloor with frequent changes in benthic habitat types.
2.3. Data preparation 2.3.1. SSS data processing 2.3.1.1. SSS data mosaicking. Acoustic returns from SSS produce intense geometric and radiometric artefacts in the created backscatter mosaics, which in turn affect the accuracy of facies delineation. Although Geocoder has mainly been designed for use with MBES backscatter data (e.g. Rzhanov et al., 2012; Fakiris et al., 2012), it can be used as well for raw SSS data, allowing the creation of more visually consistent mosaics. Specifically, application of its advanced slant range correction, beam pattern compensation, speckle removal, overlap and feathering options led to a drastically improved SSS mosaic in Lourdas Gulf. SSS time series have been slant-range corrected based on a coarse bathymetric model of the survey area, replacing the flat bottom assumption through an estimation of the average slope in the across-track direction of each ping. The effective incident angle (based on the bathymetric model) was used for adjusting the Lambert's law correction, taking in account the changes in footprint area and slope. A residual beam pattern correction was removed by calculating a moving average of angular responses (in our case 100 pings). Overlapping took into account a data quality indicator, attributing low values in samples
2.2. Data acquisition During the coupled SSS - SBP survey, 19 survey lines, having a total length of 94.2 km, were carried out using an EG&G 272-TD SSS, transmitting at 100-kHz and a Geopulse Pinger SBP transmitting at 3.5kHz. The SSS towfish was constantly towed at about 5 m behind the research vessel, operated at a slant range of 100 m per channel, finally insonifying a total area of 16.4 km2. During an independent survey, a RoxAnn system, attached to a 200-kHz single beam transducer, was used, sharing 65 km long survey lines within the extent of the SSS-SBP survey. In the above field-works, a 7.2 km long ground truthing survey was conducted using a SeaViewer underwater tow-camera for the needs of the coupled SSS-SBP survey, while video footages had also been collected from other 7 sites, using a JW Fishers TOV-1 tow-camera, during 222
Estuarine, Coastal and Shelf Science 208 (2018) 219–234
E. Fakiris et al.
Fig. 3. The final SSS mosaic segmentation map (right) and details from the two SSS segmentation scales: 1. Mean shift segmentation through EDISON (fine scale) and 2. Fuzzy c-means clustering of patch textural features with 9 classes through SonarClass (merged segments - coarser scale).
Table 1 The 26 SBP derivatives along with their short description. No
SBP derivative
First return (bottom reflector) 1,2 MnB,StdB 3
Ratio
4
Knee
Description
The value of μs, n and CVs, n along the tracked seabed. The ratio between the grey-level of the first reflection zone (estimated by Knee) and a 2 m thick zone below it. It is an estimation of how sharp the first seismic return is. An estimation of how prolonged (thick) the first seismic return is. It is calculated by extracting the cumulative sum of the seismic signal (in greyscale values) at a 2 m thick region below the seabed and finding its knee point (where the curve is approximated by a pair of lines).
Uppermost 2.5m of bottom sediments 5,6,7 MnS, StdS, CVS
The mean, std and coefficient of variation of μs, n within the first 2.5 m below the seabed.
8,9,10
The mean, std and coefficient of variation of μs, n peak values (detected seismic reflectors) within the first 2.5 m below the
11 Full penetration 12 13 14,15,16,17,18 19,20,21,22,23
MnSR, StdSR, CVSR NoSR zone Pen NoR MnPR, StdPR, CVPR, KurtPR, SkewPR MnP, StdP, CVP, KurtP, SkewP
Bathymetry 24
Depth
25 26
Rugosity Curvature
seabed. The number of detected seismic reflectors within the first 2.5 m below the seabed. The distance between the seabed and the deeper detected seismic reflector (penetration zone). The number of the detected seismic reflectors under the seafloor at the analyzed sample. The mean, std, coefficient of variation, kurtosis and skewness of μs, n at the tracked reflectors within the penetration zone. The mean, std, coefficient of variation, kurtosis and skewness of μs, n within the penetration zone. The depth at each analyzed sample. The seabed tracking was performed using the depth of the first higher peak of CVs, n for the considered sample. The rugosity, defined as the variance of the depth over a window of 50 m, extending both sides the analyzed sample. The local curvature, calculated as 1/r, where r is the radius of a circle, fitted through least squares at a bathymetric profile 50 m long, extending both sides the analyzed sample.
223
Estuarine, Coastal and Shelf Science 208 (2018) 219–234
E. Fakiris et al.
Table 2 Description and example images from the SSS, SBP and ground truth data for each Custom bottom type, linked in a hierarchical manner to the EUNIS and NATURA benthic habitat typologies.
based seafloor characterization is well demonstrated.
closer to and far off the nadir and high values in the midranges, allowing selection of the highest quality samples of all acquisition lines, in their overlapping area. A speckle noise filter and a feathering algorithm, both being phenomenological approaches without any solid physical foundation, were used to reduce nadir artifacts and the seam artifact between overlapping acquisition lines. All the above processes led to a drastically corrected mosaic (Fig. 2), having a pixel size of 50 × 50 cm, suitable for producing spatially consistent results through any image segmentation or classification approach. Further details about the processes implemented in Geocoder can be found in Fonseca and Calder (2005), while in Fakiris et al. (2012), the importance of Geocoder's acoustic backscatter corrections for texture-
2.3.1.2. SSS derivatives - segmentation of the SSS mosaic. A set of 11 SSS derivatives, used for the supervised classification process, was extracted through SonarClass, a Matlab tool that has recently been used with success in various benthic habitat mapping and target detection works (Fakiris and Papatheodorou, 2009; Kiparissis et al., 2011; Papatheodorou et al., 2012; Fakiris et al., 2012; Porpilho et al., 2013; Geraga et al., 2015; Fakiris et al., 2016; Fakiris et al., 2017). SonarClass employs three feature extraction algorithms, namely first order greylevel statistics, grey level co-occurrence matrices (GLCMs) and 2D power spectrum specifications, constituting feature vectors of 11 224
Estuarine, Coastal and Shelf Science 208 (2018) 219–234
E. Fakiris et al.
Table 3 The geo-acoustical derivatives, listed by the dataset they are extracted from, along with their relevant significance for the classification process, as estimated with the Information Gain feature evaluator. A separate grouping, according to the physical entity they describe, is provided. Tick-marks indicate which derivatives have been selected for each one of the 6 data models (m1-m6). Model classification performances are provided per data model and per classification scheme, using the Kappa coefficient evaluator, comparing the classified points to the manual classification maps using the custom classification scheme.
225
Estuarine, Coastal and Shelf Science 208 (2018) 219–234
E. Fakiris et al.
algorithm uses three-dimensional feature space, consisting of the grey value and the corresponding pixel coordinates (X and Y). The input image was a ten times downsampled version of the original SSS mosaic, in 8-bit greyscale *.tif format. Three main parameters are needed in the EDISON tool to run mean shift segmentation, the spatial resolution, the color resolution and the minimum region, which for this application were set to 7, 0.5 and 300 pixels respectively. The spatial resolution was set to its default value, color resolution was set quite low to allow the detailed segmentation of neighboring areas with slightly different backscatter intensities to be separated, while the minimum region was given a quite high value to avoid generating too many small segments At this stage, the segmented sub-regions, usually called superpixels, were quite small and thus few of them coincided with the SBP waylines. A larger scale segmentation was necessary, with most of the segments coinciding with a considerable number of SBP and RoxAnn derivatives’ points. For this, clustering of the SSS mosaic was applied via the textural parameters that had been extracted in the previous processing stage. Clustering (unsupervised) process also took place through SonarClass software, using the fuzzy c-means algorithm. The optimal number of classes was decided upon the Calinski-Harabasz (CZ) internal clustering validation index (Dudoit and Fridlyand, 2002). CZ, as all similar indices, is a phenomenological approach that quantifies the compactness of individual clusters in comparison to their separation in the Euclidean space. Comparison of CZ values between clustering results generated by c-means with gradually increasing number of classes, clearly suggested 9 classes. For each superpixel created in the fine scale segmentation stage, the majority class of the underlying SonarClass patch classes was estimated. The 2nd segmentation scale was then constructed by merging neighboring areas that shared common classes, ending up to a consistent segmentation map, based on both image boundaries and textural content of the SSS mosaic (Fig. 3).
textural features, fully described in Fakiris and Papatheodorou (2007, 2012) and provided namely in Table 3. The textural features were extracted from the SSS mosaic utilizing 30 × 30 m (60 × 60 pixels) image patches (windows), with a 20 m (40 × 40 pixels) sliding step, leading to 11 feature maps of 10 m spatial resolution each. The 30 × 30 m patch size was decided upon visual interpretation of the main image textures in the SSS mosaics, so that primitive texture elements from different bottom types (e.g. seagrass patches, sand ripples, small coralligenous reefs) could completely fit in a single image patch. Smaller image patches would lead to incomplete analysis of bottom textures while bigger patches would increase the likelihood that different bottom types are included in a single patch. Fakiris and Papatheodorou (2007) provide some experiments and discussion about the influence of patch size in the classification accuracies of SSS imageries. The patches corresponding to the nadir zone were excluded from analysis as they are known to be affected by strong acoustic artifacts, making them inappropriate for use in automated classification processes. An example showing the spatial distribution of the textural features is later provided in Fig. 5 (SSS column). The segmentation of the mosaicked SSS data, as needed for the object-oriented analysis objective, was performed in two different scale steps (Fig. 3). The first involved fine scale segmentation using the mean shift algorithm, as implemented in the EDISON software (http:// coewww.rutgers.edu/riul/research/code/EDISON), which has already been successfully used for benthic habitat classification in Che Hasan et al. (2012a,b). Mean shift segmentation uses a kernel density estimation towards nonparametric feature space analysis. A spatial parameter is used to determine the radius of the density estimation iterative process until the mean shift vector is converged (Christoudias et al., 2002). In case of greyscale (8-bit) images, the mean shift segmentation
Fig. 4. A raw SBP image example, its corresponding μs, n and CVs, n filtering results, and the detected reflectors (including seabed). The color-bar on the top left corresponds to 8-bit grayscale nuances. 226
Estuarine, Coastal and Shelf Science 208 (2018) 219–234
E. Fakiris et al.
Fig. 5. Top row: examples of derivatives regarding all 3 geoacoustical systems (SSS, RoxAnn, SBP). Bottom row: final point classification results corresponding to data models m1, m3 and m5.
spatial units, giving the Ca,k local contrast. Contrasts are further normalized by taking their ratio to their maximum possible value, which normally is the range (R) of data values (e.g. 256 in the case of 8bit images). In this way, local contrast take values between 0 and 1, with unity implying the maximum contrast possible. According to the above, the normalized local contrast (Ca,k) for a fixed rotation k and scale a, is defined as:
2.3.2. Sub-bottom profiler data processing 2.3.2.1. SBP data preparation. The raw SBP records have undergone Automatic Gain Control (AGC) and swell filtering to undo any manual gain changes applied during the data acquisition stage and to correct any distortions caused by the sea waves and swell. Data processing was realized through the SB-I (Triton Elics Inc.) software, from which full resolution grey-scale images of each record were exported in common binary image data format (TIFF) for further analysis. The exported SBP images had undergone 8 times vertical exaggeration and their pixel size was 25 cm and 3 cm in the horizontal vertical dimension respectively. GPS fixes were exported for all processed SBP records, along with their corresponding ping number (x-axis pixel number), shooting rate, recording length and recording delay information, in common ASCII formats. The above information was necessary for the accurate georeferencing of the SBP images during the extraction stage of the SBP derivatives.
Ca,k (x , y ) =
Ca,k (x , y ) R
(1)
Rotation invariant normalized local contrast of a given scale (a) is defined as the average (μa,n) of local contrast along a set of n directions (equation (2)). This defines a rotational invariant boundary enhancement filter. An additional elementary statistics parameter derived in the context of this work is the standard deviation (σa,n) of the contrasts along the n directions (equation (3)):
2.3.2.2. Automated detection of seismic reflectors. The automated detection of the seismic reflectors within the SBP image records was performed through a modified rotation and scale invariant edge enhancement image filtering procedure, introduced in Fakiris et al., (2013). A set of local grey-scale contrasts (cw,h,k) are defined, each extracted using couples of adjacent rectangular features of width w and height h, rotated at direction k. Filtering an image using such rectangular features of a single direction, results in a directional boundary enhancement filter. In this work, where the enhancement of prolonged seismic reflectors is sought, the features’ dimension was set to a fixed w to h ratio, equal to 1:16. Thus, from now on, a certain filtering scale a refers to a feature of dimensions w=a and h=a/16
μ a, n (x , y ) =
1 n
k (n)
∑k =k (1) Ca,k (x , y),
(2) 2
σa, n (x , y ) =
k(n) 1 ⎡ k(n) ⎤ Ca,k (x, y)2 − ⎜⎛∑ Ca,k (x, y) ⎟⎞ ⎥ ∑ k= k(1) n−1 ⎢ k= k(1) ⎝ ⎠ ⎣ ⎦
(3)
The above boundary enhancement filters are dependent on the scale under consideration, which can decrease their efficiency against reflectors of different thicknesses. For this, μa,n and σa,n are averaged over a number of s successive scales, finally providing rotation and scale invariant boundary enhancement filters μs, n , σs, n (eq. (4) and (5)).
227
Estuarine, Coastal and Shelf Science 208 (2018) 219–234
E. Fakiris et al.
μs, n (x , y ) =
1 s
∑a=a (1)
σs, n (x , y ) =
1 s
∑a=a (1) σa,n (x , y),
a (s )
(μa, n (x , y )),
(4)
RoxAnn system and Rugosity and Curvature estimated using the same formulas as in the seismic derivatives case (no 24–26 in Table 1).
(5)
2.4. Manual and automated seafloor characterization
a (s )
Another statistic measure is the coefficient of variation (CV), which proved beneficial for accurate automated tracking of the seabed (see Fig. 4).:
CVs, n = σs, n/ μs, n ,
2.4.1. Classification schemes In the context of the present work, three classification schemes, each one grouping in different hierarchical levels distinct bottom types, have been employed. Two of them, namely the NATURA and the EUNIS (EUropean Nature Information System) ones, represent established Habitat classification typologies, that meet European managerial standards in increasing number of hierarchical categories. The third classification scheme, referred to as “custom”, represents a Habitat classification scheme composed by all visible bottom types recognized through available ground-truth data by expert interpreters. Going in succession from the custom to the EUNIS and NATURA Habitat classification schemes, the number of bottom types decreases, as a result of merging similar subcategories. While the custom classification scheme, based upon the interpreter's experience and judgement (sometimes separating even slightly different bottom types), have ended up exhaustively in many bottom typologies, EUNIS offered a quite extensive but still manageable list of bottom typologies while NATURA offered a quite narrow one but useful for taking management decisions regarding any habitat conservation planning.
(6)
In the context of the present work, four feature scales were chosen in a quadratic fashion, namely a(1–4) = 4, 8, 16 and 32 m and four rotations, k(1–4) = 0, 45, 90, 135°. In order to achieve maximum computational speed, the above filters were implemented using Haarlike features and integral images, as described in Fakiris et al. (2013) and used in Williams and Fakiris (2014). After filtering an SBP image, detection of the seismic reflectors was performed by finding the peaks in μs, n as a function of depth, for equidistant pings. An example of applying boundary enhancement filtering, bottom detection and seismic reflectors’ detection on a characteristic SBP image is shown in Fig. 4. 2.3.2.3. Seismic derivatives. In this work, a set of seismic derivatives have been designed and implemented, aiming to extract as much information as possible, in a meaningful way, from the edge enhancement filtering results as well as from the raw SBP images themselves. SBPs are usually un-calibrated systems and also researchers tend to adjust parameters like transmit power and pulse cycles while on a survey, in order to meet their needs in a case-by-case manner. Thus, in the context of the automated classification case, where consistent statistical features need to be derived through the whole data set, effort must be put to extracting quantitative descriptors that are as invariant as possible to SBP system operation setups. This assumes extracting statistical features of the seismic data that are as normalized as possible. The estimation of μs, n , that is the basis for most statistical derivatives in this work, is inherently normalized, though effort needs to be put to the design of any other descriptor that makes use of the raw seismic image greyscale values. A total number of 26 features have been designed and extracted from equidistant points (pingwise) of the seismic profiles (Table 1). Among those, some describe the local bathymetric profile using rugosity and curvature definitions, others use μs, n to quantify the distinctness and density of the seismic reflectors, some regard simple counting of the detected reflectors while finally some use the raw greyscale intensity changes. The seismic profiles have been examined under three zones, (a) the bottom reflection zone, quantifying its sharpness, prolongation and rugosity, (b) the uppermost 2.5 m zone, examining the sound attenuation rate within the uppermost sediment layers (if any) and (c) the full penetration zone, describing its extent and reflectors’ content. Table 1 gives a brief description for each extracted seismic derivative.
2.4.2. Feature selection and data models For each one of the 3 acoustic systems, all related derivatives (including bathymetric indices) were evaluated against their importance in the classification process as to perform feature selection. In machine learning and statistics, feature selection is the process of selecting a subset of relevant features (variables, predictors) for use in model construction. Feature selection techniques are used to: (a) simplify models to become interpretable by researchers, (2) reduce training times, (3) avoid classification overfitting due to high dimensionality of the data and (4) enhance model generalization by reducing its variance (avoid overfitting). In this study, it was also interesting to find out which features have been more useful for benthic habitat mapping and try to understand why, according to their physical meaning. To accomplish the above, the training sets were submitted to a feature evaluation technique, namely the Information Gain algorithm (Azhagusundari and Thanamani, 2013) through the WEKA software (Hall et al., 2009). Information Gain ratio (IGR), evaluates the worth of a feature by measuring its mutual dependence (the amount of information obtained about one variable, through another variable) with all other features and ranking its relative importance in separating the classes in the Euclidean space. Table 3 reports the results of this process, accounting for the data points evaluated using the manual benthic habitat map and following the custom classification scheme. Given that most bathymetric indices took high ranks at every individual acoustic system, it intuitively seemed reasonable to explore how well classification would have performed without any bathymetric information, in order for instance to evaluate the worth of the newly implemented SBP derivatives. For each one of the 3 geoacoustic systems, the bathymetric indices were turned on and off, to finally build 6 data models, so that each could be evaluated against its suitability for benthic habitat mapping. In these models, only the most important derivatives, having IGR above 0.5, were selected. The final data models are presented in Table 3.
2.3.3. RoxAnn derivatives RoxAnn habitat classification is based upon the integration of two seabed echoes, namely E1 and E2, that are associated with seafloor ‘roughness’ and ‘hardness’ respectively (Chivers et al., 1990). Traditionally, these two parameters are displayed on a Cartesian plot, which is divided in user-defined square regions, each representing a specific seabed type (Greenstreet et al., 1997) which has been calibrated through ground truthing techniques such as grab samples or video footage. In this study the E1 and E2 values, are used as independent derivatives and are engaged in the data pool to be validated against more sophisticated supervised classification techniques. In addition to E1 and E2, three bathymetric indices i.e. Depth, Rugosity and Curvature, have also been considered, with Depth readily provided from
2.4.3. Supervised classification, training & validation datasets, object based analysis The Random Forest (RF) classifier (Breiman, 1999), as implemented in WEKA data mining software, was employed for the supervised classification of the data models. RF is a powerful class learning method that operates by constructing a multitude of decision trees and
228
Estuarine, Coastal and Shelf Science 208 (2018) 219–234
E. Fakiris et al.
Fig. 6. Object based classification results regarding each data model (m1-m6), classified using each one of the 3 classification schemes. The manual classification maps, used in this study for the validation of the results, are provided on the first image column.
229
Estuarine, Coastal and Shelf Science 208 (2018) 219–234
E. Fakiris et al.
shallower parts, usually organized into well shaped groups of patches. Cymodocea beds were filling almost all areas not covered by Posidonia beds, down to 25 m - 30 m depth, with the denser presence being on its W parts. Reefs were present on the SW part of the survey area, between 35 m and 50 m depth. A brief presentation of the various benthic habitat types is provided in Table 2, where characteristic data samples are provided for each one of the three main interpretation-aiding datasets, namely SSS, SBP and seafloor video footage, along with their classification and description in regard to the custom, NATURA and EUNIS habitat classification schemes.
outputting the majority (mode) of the individual trees’ classes. RF has recently been used in acoustic benthic habitat mapping applications (e.g. Che Hasan et al., 2012b; Seiler et al., 2012; Fakiris et al., 2017), due to its robustness and its high accuracies in comparison to other classifiers. In the context of the present study, RF decision trees were trained using data points of each acoustic system that were in proximity (within an 100 m radius buffer) to the manually classified ground truthing points. Thus, for each one of the 6 data models and for each one of the 3 classification schemes, a different classification model was built, finally constituting 18 classification models, with an equal number of classification results. Validation of the 18 classification models took place using either the classified points (SBP samples, SSS mosaic image patches or RoxAnn samples) or the classified segments (taking the majority class of the included classified points) all flagged in accordance to the manual classification maps (see Figs. 5 and 6). This way, 36 evaluations were performed, corresponding to the 18 classification models, with the classified data having been considered as individually classified points or as classified segments. A parallel objective of this procedure was to investigate which classification model suits best for each acoustic system and how much classification accuracies are improved when using object based analysis or not. The accuracy for each model was assessed by means of forming cross-tabulations matrices between the predicted and the actual (based in the manual classifications) classes and computing its Kappa coefficient. Evaluations have also been performed regarding the classification accuracy of each individual class, using the F-measure metric, in order to investigate which classification model performed better for each bottom type.
3.2. Geo-acoustic derivatives. Evaluation and selection During the feature selection stage, all derivatives were ranked in regard to their individual capability to discriminate between all bottom types, the latter having been separated manually according to the custom classification scheme. Feature selection was applied to the derivatives of each one of the three geoacoustic system, and the IGR metric revealed the ratio of improvement when using one derivative or another. The importance of the bathymetric derivatives (and especially depth) was high for all geoacoustic systems. This can be considered a case sensitive finding, and thus it should not be generalized. The relative importance of all other derivatives is provided namely in the following. SBP derivatives with significant performances were found regarding each one of all three analyzed seismic zones, with the most important ones being the “MnB”, “StdB” and “Ratio” from the first return zone, the “StdS” and “StdSR” from the uppermost 2.5 m of sediments zone and the “Penetration”, “StdPR”, “MnP”, “StdP” and “CVP” from the full penetration zone, all exhibiting IGR above 0.5 (see Table 3) and thus being selected for the classification process. The highest rankings were assessed to “MnB” and “StdB”, with information gains around unity, as well as to “Ratio”, “Penetration”, “StdSR, “StdP” and “CVP”, with IGR close to 0.6. Regarding the significances of the textural derivatives extracted from the SSS mosaic, they almost all exhibited high IGR (around unity). Those with the poorest performance were the 3rd moment invariant from the 1st order grey level statistics and the GLCM Correlation, the FFT Directionality and the FFT Texture Strength from the 2nd order (textural) grey level statistics, sharing IGR below 0.5 and being the only ones not selected for the classification process. Finally, both E1 and E2 RoxAnn derivatives exhibited average to low IGR, with E1 being considered as quite significant (IGR = 0.5) and E2 as poor (IGR = 0.26) against benthic habitat classification. The latter findings are most likely related to the increased noise that is inherently included in the RoxAnn data which severely decreased the consistency of the classified data. However, given the bibliographically recognized significance of those two derivatives, they were both selected for the classification process.
3. Results 3.1. Sea-floor characterization/classification schemes The present study at Lourdas Gulf showed that it exhibits a complex seafloor with frequent changes in sediment and habitat types, making it a really challenging environment for automated benthic habitat mapping. Manual characterization of Lourda's seafloor (see manual classifications in Fig. 6), having been performed taking in account all available geoacoustical and ground-truth data, revealed the presence of three main habitat types, namely Posidonia beds, sandbanks and reefs, corresponding to the NATURA codes 1120, 1110 and 1170 respectively. Posidonia beds were further branched into two subtypes, namely dense P. oceanica meadows and well-shaped seagrass patches within a uniform sandy area, corresponding to the codes C1 and C2 of the custom classification scheme. Sandbanks, being a generic NATURA code, could be further split into three EUNIS classes, according to having any seagrass presence or distinct sediment type changes, namely the Mediterranean Cymodocea nodosa phanerogam beds (A55313), circalittoral fine sand (A525) and circalittoral sandy mud (A535). Circalittoral fine sand actually corresponded to areas with rippled sand of distinct boundaries with the surrounding vegetated bottom. In addition, C. nodosa beds were further split into dense and sparse (C3 and C4 custom classification codes) ones, as they both had distinct signatures in the geoacoustical and visual census data. Circalittoral sandy mud was branched into two classes, in regard to having any presence of algae (C6) or not (C7). Finally, the reefs class, being a generalistic NATURA code, was separated into coralligenous communities and maerl beds, taking the codes A426 and A551 respectively in the EUNIS typology. Careful interpretation of the available data, allowed the separation of maerl beds into two last custom classes, the first one (C9) corresponding to maerl beds with strong presence of coralligene fragments and the second one (C10) to maerl beds with high content in rhodoliths. The spatial extent of the above habitat types seems to be mostly governed by the general bathymetry of the area, the sea currents and the outcropping or sub-cropping of the bedrock. Dense Posidonia beds were found shallower than 35 m depth on the W and E parts of the study area, while Posidonia patches were scattered in the middle
3.3. Supervised classification and validation results Concerning point classes’ accuracies, when using all selected derivatives per system (including bathymetric ones), i.e. data models m2, m4 and m6 (see Table 3), SSS and SBP exhibited the best results, as indicated by their 85% Kappa coefficient (as an average over all classification schemes), on the contrary to RoxAnn system, which reached just 66%. Breaking down the results by classification scheme, the custom one showed better results for SBP (83% vs 78% and 61% for SSS and RoxAnn respectively) while the EUNIS and the NATURA for SSS (87% and 91% respectively vs 85% and 86% for SBP and 72% and 66% for RoxAnn). When not accounting for any contribution of the local bathymetric information to the classification process (i.e. data models m1, m2, m3 and m5), which is fairer in terms of comparing the three systems about 230
Estuarine, Coastal and Shelf Science 208 (2018) 219–234
E. Fakiris et al.
diversity of the reflectors' sharpness within the uppermost 2.5 m of sediments, indicate a rough seafloor that forms a chaotic acoustic attenuation pattern within the first meters of the seismic section. In the same manner, high values of StdP and CVP, derivatives that quantify the diversity of the reflectors’ sharpness and continuity within the full penetration seismic zone, suggest a layered substrate with sharp sedimentary facies, indicating a seafloor of loose sediments, having been deposited in a quite low energy environment. It is worth noting that at least one SBP derivative per analyzed seismic zone (seafloor, uppermost 2.5 m of sediments and full penetration) have been chosen as significant for habitat classification through the feature evaluation/selection stage. This supports the view that although benthic habitat mapping refers to characterizing the superficial features of the seabed, some shallow substrata properties seem to contribute in a significant way to better discriminating them. Comparison of the SBP based classification results to both SSS and RoxAnn based ones, indicated that it had equivalent and in most cases even better performance, and thus it may deserve further attention by researchers active in the topic of benthic habitat mapping. An evident reason for the better performance of SBP, especially in the more exhaustive custom classification scheme, is that its derivatives could capture more information about the seafloor including both its surface and its upper stratigraphic composition, aspect often strongly interlinked. Although of low resolution, SBP data may contain more information about the seafloor, especially when slightly different seabed types are considered which are not otherwise well separated using textural criteria (i.e. using SSS data). On the contrary, SSS performed better in the EUNIS and especially in the NATURA classification schemes, which inherently include less bottom types of higher divergence between them, each one having its own textural signature and backscatter strength. Regarding RoxAnn system, although it exhibited the worst results in comparison to SSS and SBP, it did well regarding the NATURA classification scheme, as well as regarding all bottom types that are characterized by rough changes in material rather than in texture or substrate structure, such as A5535, A55313 and A535. The SSS data was used to provide the object based perspective in this work, as it was the only system to offer full coverage surveying of the seafloor. The value of object based analysis is mostly drawn by that it is a convenient way to extrapolating sparse point classification results, like those produced by SBP and RoxAnn systems, into segments bordering on each other and covering the whole survey area. Moreover, assessment of the rate of classification accuracy improvement when employing object based analysis clearly showed that it is a key processing stage for improved classification results, even regarding dense SSS data. This is in view of reducing the noise that it is always evident in the point classification results, through a local (segment-wise) majority class consideration. The latter effect was especially evident in the RoxAnn system, the classification results of which were inherently much noisier and thus the accuracy improvement with object based analysis exceeded 25% in all classification schemes (see Fig. 7). On the contrary, the classification accuracy improvement was always less than 10% concerning the SBP derived results. This implies that SBP derivatives suffered from much less noise thus producing spatially consistent classification results (see Fig. 8). Bathymetric derivatives have been shown to be an important auxiliary means for producing more accurate benthic habitat classification results. This was true regarding all acoustic systems and all classification schemes. Yet again, this finding had minimum effect on SBP data models, offering insignificant accuracy improvement especially with object based analysis consideration. This is an important verdict, implying that SBP derivatives are alone sufficient for accurate benthic habitat classification, even without any contribution of the bathymetric information. On the contrary, bathymetric derivatives seemed to be beneficial when integrated in SSS and especially in RoxAnn data models (see Fig. 7). Analysis of the classification accuracies on the basis of each
their individual efficiencies towards benthic habitat classification, SBP derivatives clearly outperformed the ones of the other two systems. This was especially evident in the most demanding case of using the custom classification scheme, where the SBP system provided 57% and 23% better results than RoxAnn and SSS systems respectively, reaching a Kappa coefficient of 76% (see Table 3). Regarding object based analysis, the classification accuracies were in general higher when using the classified segments rather than the classified points. This was true for all systems, but notably in less effect for SBP, where the accuracy improvement was very slight when validating the segments' classes rather than the points’ ones. On the contrary, this difference was particularly evident regarding RoxAnn data, as its point classes were notably noisy and the majority class consideration of the point classes within each segment greatly reduced the problem (see Figs. 5 and 6). It was also evident when turning on and off the bathymetric derivatives, which were found to significantly contribute to the extraction of more spatially consistent and less noisy point classes, thus minimizing the rate of improvement with object based consideration. Regarding the rate of improvement in the classification accuracy of each individual benthic habitat type when using one or another data model, it was made evident that SBP derivatives outperformed SSS and RoxAnn ones. This applies for all classification schemes whether bathymetric derivatives were set on or off. The value of SBP derivatives were particularly evident in the classes related to Reefs, where they clearly exhibited much better performance regarding almost all relevant NATURA, EUNIS or custom classification scheme classes. NATURA class 1170, EUNIS classes A426 and A551 as well as custom classes C8 and C10, were better classified through SBP derivatives, followed by SSS and RoxAnn ones. However, Maerl beds with corraligene fragments (C9) were better discriminated through SSS derivatives, especially when bathymetric derivatives where set on. On the contrary, maerl beds with rhodoliths (C10) were better separated through SBP derivatives. C. nodosa beds (C4) were much better separated using SBP derivatives. Similarly, P. oceanica related classes were in general adequately separated using SBP, but not Posidonia meadows, which was about 10% better separated using SSS. Sand ripples (C5) were also better separated using SBP rather than SSS. Finally, it is worth mentioning that although RoxAnn system exhibited the worst results in comparison to SSS and SBP, it did well with the NATURA classification scheme, as well as with all bottom types described by changes in material rather than in texture or substratum, such as A5535, A55313 and A535. 4. Discussion The suggested seismic data quantification methodology proved to be suitable for supervised classification of benthic habitats, as indicated by that at least some of the extracted SBP derivatives were found to have high discrimination powers through the feature evaluation/selection stage. Although this study suggests a phenomenological approach towards benthic habitat characterization, mostly based in statistically derived descriptors, the implemented SBP derivatives were intended to be meaningful. Meaningfulness was not sought by applying any kind of model inversion but by trying to quantify some empirical rules that marine geoscientists employ to visually interpret the shallow seismic records, such as the transparency, continuity and density of the seismic reflectors. This way, for instance “Ratio” describes how sharp the first return is and “Knee” how prolonged (thick) it is, both parameters being related to the superficial composition of the seabed. Similarly, “Pen” gives an estimation of the maximum penetration of the acoustic waves into the sediments, while “StdP” intents to quantify the diversity of seismic sound scattering within the penetration zone, parameters that are both linked to the physical characteristics of the sediments, such as their compactness, porosity, density and grain size. Moreover, high values of StdSR and StdS, derivatives that quantify the 231
Estuarine, Coastal and Shelf Science 208 (2018) 219–234
E. Fakiris et al.
Fig. 7. Bar-charts comparing the validation results of all 18 classification models, organized by classification scheme, geoacoustic system and bathymetric (topo) derivatives being turned on or off. Results regarding either the classified data points or the classified segments are provided separately. Kappa coefficient is the basis for the accuracy measures.
Fig. 8. Bar-charts, one for each classification scheme, comparing the classification accuracies of benthic types when using each one of the 6 data models. F-measure concerning point classes is the basis for the accuracy measures. 232
Estuarine, Coastal and Shelf Science 208 (2018) 219–234
E. Fakiris et al.
Physical Oceanography (LMGPO) for the invaluable contribution during data collection and especially Dr. D. Christodoulou, Dr. M. Iatrou and S. Kordella who were among the leading surveyors for most aspects of the field work. EF conceptualized and guided the study, prepared the computer codes, analyzed the results and wrote most parts of the paper. DZ processed the seismic data and wrote parts of the paper. EF, DZ, AR and ES contributed equally to the manual benthic habitat classification of the ground truth data using expert decision. AR prepared the RoxAnn data and wrote parts of the paper. NG performed the geological analysis of the seismic records and wrote parts of the paper. GP contributed to the discussion of the results. EF would also like to thank Philippe Blondel (U. Bath, UK) for supporting this work through constructive comments on the methods used.
individual habitat type revealed that SBP derivatives offered overall superior performances but it also indicated some restrictions for which swath sonars may be more suitable. For instance, although maerl beds with rhodoliths (custom class C10) were better separated through SBP derivatives, maerl beds with corraligene fragments (C9) were much better discriminated through SSS derivatives, especially when bathymetric derivatives where set on. The above finding is due to that both custom classes C9 and C10 have a strong but similar textural signature in the SSS mosaic, making it easy for the classifier to better outline their general boundaries but hard to tell them apart, which led C10 to be confused for C9. What made C10 better separated through SBP derivatives, is that C9 is located within the extent of the sub/outcropping bedrock while C10 is in its outer boundaries, where the topmost sedimentary layer is getting thicker, things that only SBP could parameterize. In the same manner, although all seaweed habitat types (C1, C2, C3 and C4) were adequately separated using SBP derivatives, P. oceanica related classes were in general better separated through SSS derivatives and especially Posidonia meadows. The latter is in view of that Posidonia meadows develop a rather uniform seafloor layer of strong acoustic backscatter which is impenetrable by sound waves. Thus, it shows a characteristic homogenous texture of high backscatter in SSS while in SBP records it appears as an acoustically opaque seafloor cover, very much alike (and confused with) any rocky outcrop. On the other hand, sand ripples (C5) were better separated using SBP rather than SSS, which is a paradox given their strongly oriented texture which should be well seen through SSS. However, their short wavelength and elevation and the high flight of the SSS towfish about the seafloor made them not clearly visible in the SSS mosaic. As a conclusion, this work represents a convincing evidence that shallow seismic data, such as 3.5-kHz pingers and chirps, can be successfully used alone or supplementary with other systems for automated benthic habitat mapping. In this work, the suggested SBP derivatives led in general to better classification accuracies than when employing traditional descriptors derived by SSS and RoxAnn, suggesting that SBP derivatives are alone capable of separating between diverse seafloor types as they can aid in gaining a multi-view perspective of both the seafloor and its substrate. If quantitative seafloor discrimination methods based on SBP data are standardized, automated systems could reinforce new or past shallow-seismic surveys, by adding benthic-habitat discrimination as a supplementary product of substratum exploration. Especially, reusing historical seismic data sets for seafloor characterization could fill important gaps in existing knowledge of habitat distributions. Nonetheless, analysis of newly acquired and the large volumes of historical sub-bottom profiling data is a relatively underutilized source of information about seafloor sedimentary environments that needs to be further exploited. Although multi-system surveying is a prerequisite for the presented methodology to take place, assessing the rate of classification improvement when using some combination of all considered systems was out of the scopes of this study. However, the high classification accuracies of both SSS and SBP derivatives indicate that some direct integration between them could be beneficial and worth further studying. Future work on the proposed methodological approach should also regard its application in datasets from other areas as to validate its repeatability.
References Alevizos, E., Snellen, M., Simons, D., Siemes, K., Greinert, J., 2017. 2017. Multi-angle backscatter classification and sub-bottom profiling for improved seafloor characterization. Mar. Geophys. Res. 1–18. http://dx.doi.org/10.1007/s11001-017-9325-4. Alexandridis, T.K., Lazaridou, E., Tsirika, A., Zalidis, G.C., 2009. Using Earth Observation to update a Natura 2000 habitat map for a wetland in Greece. J. Environ. Manag. 90, 2243–2251. Andrieux, N., Delachartre, P., Vray, D., Gimenez, G., 1995. Lake-bottom recognition using a wideband sonar system and time-frequency analysis. J. Acoust. Soc. Am. 98 (1), 552–559. Azhagusundari, B., Thanamani, A., 2013. Feature selection based on information gain. Int. J. Innovative Technol. Explor. Eng. 2, 18–21. Blondel, Ph, 1996. Segmentation of the Mid-Atlantic Ridge south of the Azores, based on acoustic classification of TOBI data. In: Tectonic, Magmatic and Biological Segmentation of Mid-ocean Ridges, vol. 118. Geological Society Special Publication, pp. 17–28. Blondel, P., Parson, L.M., Robigou, V., 1998. TexAn: textural analysis of sidescan sonar imagery and generic seafloor characterisation. In: Oceans ’98 IEEE/OES Conference Proceedings, pp. 419–423 Nice, France. Breiman, L., 1999. Random forest. Mach. Learn. 45 (5), 1–35. Brown, C.J., Mitchell, A., Limpenny, D.S., Robertson, M.R., Service, M., Golding, N., 2005. Mapping seabed habitats in the Firth of Lorn off the west coast of Scotland: evaluation and comparison of habitat maps produced using the acoustic grounddiscrimination system, RoxAnn, and sidescan sonar. ICES J. Mar. Sci. 62, 790–802. Che Hasan, R., Ierodiaconou, D., Laurenson, L., 2012a. Combining angular response classification and backscatter imagery segmentation for benthic biological habitat mapping. Estuar. Coast Shelf Sci. 97, 1–9. Che Hasan, R., Ierodiaconou, D., Monk, J., 2012b. Evaluation of four supervised learning methods for benthic habitat mapping using backscatter from multi-beam sonar. Rem. Sens. 4 (11), 3427–3443. Chivers, R.C., Emerson, N.C., Burns, D., 1990. New acoustic processing for underway surveying. Hydrogr. J. 56, 9–17. Christoudias, C., Georgescu, B., Meer, P., 2002. Synergism in low-level vision. In: 16th International Conference on Pattern Recognition, vol. IV. pp. 150–155 Quebec City, Canada. Damuth, J.E., 1975. Echo character of the western equatorial Atlantic floor and its relationship to the dispersal and distribution of terrigenous sediments. Mar. Geol. 18 (2), 17–45. Davis, A., Haynes, R., Bennell, J., Huws, D., 2002. Surficial seabed sediment properties derived from seismic profiler responses. Mar. Geol. 182 (1–2), 209–223. Dudoit, S., Fridlyand, J., 2002. A prediction-based resampling method for estimating the number of clusters in a dataset. Genome Biol. 3 (7), 1–21. Fakiris, E., Papatheodorou, G., 2007. Calibration of textural analysis parameters towards valid classification of sidescan sonar imagery. In: Proceedings of the 2nd International Conference & Exhibition on “Underwater Acoustic Measurements: Technologies & Results” Papadakis and Bjorno, vol. III. pp. 1253–1264. Fakiris, E., Papatheodorou, G., 2009. Sonar Class: a MATLAB toolbox for the classification of sidescan sonar imagery, using local textural and reverberational characteristics. In: In: Papadakis, Bjorno (Eds.), Proceedings of 3rd International Conference on Underwater Acoustic Measurements: Technologies & Results, vol. III. pp. 1445–1450 Nafplion Greece. Fakiris, E., Papatheodorou, G., 2012. Quantification of regions of interest in swath sonar backscatter images using grey-level and shape geometry descriptors: the TargAn software. Mar. Geophys. Res. 33, 169–183. http://dx.doi.org/10.1007/s11001-0129153-5. Fakiris, E., Rzhanov, Y., Zoura, D., 2012. On importance of acoustic backscatter corrections for texture-based seafloor characterization. In: Proceedings of the 11th European Conference on Underwater Acoustics (ECUA'12). Fakiris, E., Williams, D., Couillard, M., Fox, W., 2013. Sea-Floor acoustic anisotropy and complexity assessment towards prediction of ATR performance. In: Proc International Conference on Underwater Acoustics (UAC), (Corfu Isl., Greece). Fakiris, E., Papatheodorou, G., Geraga, M., Ferentinos, G., 2016. An automatic target detection algorithm for swath sonar backscatter imagery, using image texture and independent component analysis. Rem. Sens. 8 (5), 373. Fakiris, E., Dimas, X., Georgiou, N., Christodoulou, D., Rzhanov, Y., Papatheodorou, G., 2017. Integrating dual frequency side-scan sonar data and multibeam backscatter,
Acknowledgements - Author contributions The SSS, SBP and most parts of the towed camera datasets have been collected in the context of the ETCP “Greece – Italy 2007–2013” interdisciplinary Aquaria for the Promotion of Environmental and History « APREH » program, coordinated by Prof. GF (Geology Dpt., Patras Univ., Greece). The RoxAnn and parts of the towed camera datasets were collected for the purposes of a feasibility study for the construction of an artificial reef in southern Kefalonia, coordinated by Dr. A. Kallianiotis (Fisheries Research Centre, Kavala, Greece). We thank all the members of the Laboratory of Marine Geology and 233
Estuarine, Coastal and Shelf Science 208 (2018) 219–234
E. Fakiris et al.
community structure. Estuar. Coast Shelf Sci. 147, 123–136. Micallef, A., Le Bas, T.P., Huvenne, V. a I., Blondel, P., Hühnerbach, V., Deidun, A., 2012. A multi-method approach for benthic habitat mapping of shallow coastal areas with high-resolution multibeam data. Continent. Shelf Res. 39–40, 14–26. Milligan, S.D., LeBlanc, L.R., Middleton, F.H., 1978. Statistical grouping of acoustic reflection profiles. J. Acoust. Soc. Am. 64 (3), 795–807. Mitchum Jr., R.M., Vail, P.R., Sangree, J.B., 1977. Seismic stratigraphy and global changes of sea level, part 6: seismic stratigraphy interpretation of seismic reflection patterns in depositional sequence. In: PAYTON, C.E. (Ed.), Seismic Stratigraphy – Applications to Hydrocarbon Exploration. AAPG Memoir 26. Edwards Brothers Inc, Ann Arbor, Michigan, pp. 117–133. Montereale Gavazzi, G., Madricardo, F., Janowski, L., Kruss, A., Blondel, P., Sigovini, M., Foglini, F., 2016. Evaluation of seabed mapping methods for fine-scale benthic habitat classification in extremely shallow environments – application to the Venice Lagoon, Italy. Estuar. Coast Shelf Sci. 170, 45–60. Papatheodorou, G., Avramidis, P., Fakiris, E., Christodoulou, D., Kontopoulos, N., 2012. Bed diversity in the shallow water environment of Pappas lagoon in Greece. Int. J. Sediment Res. 27 (1), 1–17. Penrose, J.D., Siwabessy, P.J.W., Gavrilov, A., Parnum, I., Hamilton, L.J., Bickers, A., Brooke, B., Ryan, D.A., Kennedy, P., 2005. Acoustic Techniques for Seabed Classification. Cooperative Research Centre for Coastal Zone Estuary and Waterway Management Technical Report 32, 130 pp. Porpilho, D., Klein, A.H.F., de Camargo, R.S.V., Prado, M.F.V., Bonetti, J., Short, A., Fakiris, E., 2013. Automatic classification of bedforms using phase differencing bathymetric sonar. In: Proc. International Conference on Underwater Acoustics (UAC), (Corfu Isl., Greece). Pouliquen, E., Lurton, X., 1992. Identification de la nature du fond de la mer à l'aide de signaux d'écho-sondeurs. J. Phys. IV 2 (C1), 941–944. Preston, J.M., Christney, A.C., Bloomer, S.F., Beaudet, I.L., 2001. Seabed classification of multibeam sonar images. In: Oceans, 2001. MTS/IEEE Conference and Exhibition, vol. 4. IEEE, pp. 2616–2623. Rzhanov, Y., Fonseca, L., Mayer, L., 2012. Construction of seafloor thematic maps from multibeam acoustic backscatter angular response data. Comput. Geosci. 41, 181–187. Saleh, M., Rabah, M., 2016. Seabed sub-bottom sediment classification using parametric sub-bottom profiler. NRIAG J. Astron. Geophys. 5 (1), 87–95. Seiler, J., Friedman, A., Steinberg, D., Barrett, N., Williams, A., Holbrook, N., 2012. J.Image-based continental shelf habitat mapping using novel automated data extraction techniques. Continent. Shelf Res. 45, 87–97. Topouzelis, K., Makri, D., Stoupas, N., Papakonstantinou, A., Katsanevakis, S., 2018. Seagrass mapping in Greek territorial waters using Landsat-8 satellite images international. J. Appl. Earth Obs. Geoinf. 67, 98–113. Williams, D.P., Fakiris, E., 2014. Exploiting environmental information for improved underwater target classification in sonar imagery. IEEE Trans. Geosci. Rem. Sens. 99, 1–14. Yegireddi, S., Thomas, N., 2014. Segmentation and classification of shallow subbottom acoustic data, using image processing and neural networks. Mar. Geophys. Res. 35, 149–156.
angular response and bathymetry, for benthic habitat mapping in the Laganas Gulf MPA, Zakinthos Isl., Greece. J. Acoust. Soc. Am. 141 (5), 3949. Fonseca, L., Brown, C., Calder, B., Mayer, L., Rzhanov, Y., 2009. Angular range analysis of acoustic themes from Stanton Banks Ireland: a link between visual interpretation and multibeam echosounder angular signatures. Appl. Acoust. 70 (10), 1298–1304. Fonseca, L., Calder, B., 2005. Geocoder: an efficient backscatter map constructor. In: Proceedings of the US Hydrographic Conference 2005, San Diego (CA). Geraga, M., Papatheodorou, G., Ferentinos, G., Fakiris, E., Christodoulou, D., Georgiou, N., Dimas, X., 2015. The study of an ancient shipwreck using marine remote sensing techniques, in Kefalonia Island (Ionian Sea), Greece. Archaeol. Maritima Mediterr. 12 (12), 183–200 (Fabrizio Serra). Greenstreet, S.P.R., Tuck, I.D., Grewar, G.N., Armstrong, E., Reid, D.G., Wright, P.J., 1997. An assessment of the acoustic survey technique, RoxAnn, as a means of mapping seabed habitat. ICES J. Mar. Sci. 54, 939–959. Hall, M., Frank, E., Holmes, G., Pfahringer, B., Reutemann, P., Witten, I.H., 2009. The WEKA data mining software: an update. SIGKDD Explor. 11 (1). Hamilton, L.J., Mulhearn, P.J., Poeckert, R., 1999. Comparison of RoxAnn and QTC-View acoustic bottom classification system performance for the Cairns area, Great Barrier Reef, Australia. Continent. Shelf Res. 19 (12), 1577–1597. Henriques, V., Guerra, M.T., Mendes, B., Gaudêncio, M.J., Fonseca, P., 2015. Benthic habitat mapping in a Portuguese Marine Protected Area using EUNIS: an integrated approach. J. Sea Res. 100, 77–90. Hughes Clarke, J.E., 2017. Multibeam echosounders, chapter 3. In: Micallef, Krastel, Savini (Eds.), Submarine Geomorphology. Springer Publishing, pp. 25–41. Huvenne, V.A.I., Blondel, P., Henriet, J.P., 2002. Textural analyses of sidescan sonar imagery from two mound provinces in the Porcupine Seabight. Mar. Geol. 189, 323–341. Kim, H.-J., Chang, J.-K., Jou, H.-T., Park, G.T., Suk, B.-C., Kim, K.Y., 2002. Seabed classification from acoustic profiling data using the similarity index. J. Acoust. Soc. Am. 111 (2), 794–799. Kiparissis, S., Fakiris, E., Papatheodorou, G., Geraga, M., Kornaros, M., Kapareliotis, A., Ferentinos, G., 2011. Illegal trawling and induced invasive algal spread as collaborative factors in a Posidonia oceanica meadow degradation. Biol. Invasions 13 (3), 669–678. Le Bas, T.P., Huvenne, V.A.I., 2009. Acquisition and processing of backscatter data for habitat mapping - comparison of multibeam and sidescan systems. Appl. Acoust. 70 (10), 1248–1257. LeBlanc, L.R., 1992. Marine sediment classification using the chirp sonar. J. Acoust. Soc. Am. 91 (1), 107. Lee, G.H., Kim, H.J., Kim, D.C., Yi, B.Y., Nam, S.M., Khim, B.K., Lim, M.S., 2009. The acoustic diversity of the seabed based on the similarity index computed from Chirp seismic data. ICES J. Mar. Sci. 66 (2), 227–236. Lucieer, V.L., 2008. Object-oriented classification of sidescan sonar data for mapping benthic marine habitats. Int. J. Rem. Sens. 29 (3), 905–921. Lucieer, V., Hill, N.a., Barrett, N.S., Nichol, S., 2013. Do marine substrates ‘look’ and ‘sound’ the same? Supervised classification of multibeam acoustic data using autonomous underwater vehicle images. Estuar. Coast Shelf Sci. 117, 94–106. McGonigle, C., Collier, J.S., 2014. Interlinking backscatter, grain size and benthic
234