Target Classification and Pattern Recognition Using Micro-Doppler Radar Signatures
Yinan Yang, Jiajin Lei, Wenxue Zhang and Chao Lu Computer and Information Sciences Department Towson University, 8000 York Road, Towson, MD 21252, USA. Email:
[email protected] Abstract Micro-motions, such as vibrations or rotations of an object or structures on the object, induce additional frequency modulations on returned radar signal, which generates sidebands about the object’s Doppler frequency, called micro-Doppler [1,2,4]. In this paper, we investigated statistical classification methods for target classification using their micro-Doppler signatures. At this stage only simulated data are studied, and two models are used to generate simulation data: point scatter model and RCS model. Both models are tested and compared for their performance on target classification.
1. Introduction
also a simplified model compared to real objects, instead using point scatter, it treats an object as a sum of a few main radar cross section. The RCS model is more complex than the point scatter model but still simple enough. The complete target classification includes preprocessing of observed data (segmentation, noise removal, filtering, spatial or temporal localization, and normalization of patterns), feature extraction and selection, learning, and classification. Feature extraction is accomplished with the principal component analysis (PCA) and independent component analysis (ICA) [5, 7, 8]. Learning and classification are accomplished with Bayes classifier, k-nearest neighbor (k-NN) classifier, linear discrimination classifier (LDC) or support vector machine (SVM) [5].
2. Data Description
Recent research showed that by using micro-Doppler techniques, a target can be recognized or classified by its micro-Doppler features [1, 2]. To explore an object’s micro-Doppler features, time frequency analysis is used to provide information about these localized features in the joint time and frequency domain [3, 4]. In most cases, an object’s micro-motion has a unique signature. For example, the micro-motion of a rotor on a helicopter and a turbofan on a jet plane will have very different signatures. Micro-motion is caused directly by an object’s dynamic motion properties and micro-Doppler features are direct reflection of micro-motion, thus we can classify an object with unique dynamic motion properties using its micro-Doppler signatures [4]. In this paper we tested this concept using simulated radar signals with two different simulation models. One is point scatter model and the other is RCS (Radar Cross Section) model. The point scatter model treats an object as a sum of a few main scattering points on the object, it is the simplest simulation model, easy to implement, but sometimes it may be just too simple. The RCS model is
We demonstrate the application and effectiveness of the micro-Doppler analysis with two set of simulated radar data. In this paper, we are using a simple cylinder with length of 1 meter, and radius of 0.125 meter as our target. The radar will be a X-band pulse radar operating at 10GHz, with 2.5 us pulse width and 1KHz pulse repetition frequency.
2.1 Point Scatter Model One approach to simulate the radar signal is to assume that most of the energy of the signal reflected from the target is scattered by a few dominating elements. In another words, if we assume that the target is composed of a small number of discrete scattering points, we can calculate or simulate radar reflection signals by simply adding together radar reflections from these points. When an object is indeed composed by a number of point scatters, this model can work well and it is simple, but the biggest difficulty is how to define these point scatters for
Proceedings of the Seventh ACIS International Conference on Software Engineering, Artificial Intelligence, Networking, and Parallel/Distributed Computing (SNPD’06) 0-7695-2611-X/06 $20.00 © 2006
IEEE
1
a given target. For a simple object, people can define its point scatter by experience, which is the case here. Our target is a simple cylinder, so we treat it as composed by three scatters: one at the center to act as the
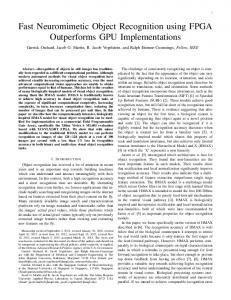
surface of the cylinder, and two at the center of each end plate to replace two circular end plates. Figure 1 to Figure 4 show the simulated micro-Doppler signatures for this three scatters models with four different micro-motions:
Figure 1. Vibration
Figure 3. Coning In all above 4 figures micro-Doppler signatures can be clearly identified. It proves that target recognition based on its micro-Doppler signatures is possible, and it also proves that point scatter model is suitable for demonstrating micro-Doppler signatures for a simple object.
2.2 RCS (Radar Cross Section) Model Another approach to simulate radar signal is to assume that most of the energy of the signal reflected from the target is reflected from a few dominating surfaces. In other words, if we assume that the target is composed of a small number of surfaces, we can calculate radar reflection signal by adding together reflections from each
Figure 2. Rotation
Figure 4. Tumbling surface, and the reflection from each surface is calculated based on its RCS. The term RCS refers to the amount of scattered power from a target towards the radar, when the target is illuminated by RF energy. RCS is a function of surface shape, aspect angle and radar frequency. RCS model can represent the original object more closely with moderate complexity, but it is difficult to decompose an object into simple surfaces and it is hard to calculate exact RCS for a given surface. Most RCS calculation is done by approximation. For our simple cylinder target, it can be decomposed into three surfaces, one cylinder surface and two circular flat plate surfaces. Figure 5 to Figure 8 show the simulated micro-Doppler signatures using RCS model for the exact same micro-motions in Figure 1 to Figure 4:
Proceedings of the Seventh ACIS International Conference on Software Engineering, Artificial Intelligence, Networking, and Parallel/Distributed Computing (SNPD’06) 0-7695-2611-X/06 $20.00 © 2006
IEEE
2
Figure 5. Vibration
Figure 6. Rotation
Figure 7. Coning
Figure 8. Tumbling
Figure 9 to Figure 12 show RCS values in log scale for each corresponding micro-motion:
Figure 9. RCS in vibration
Proceedings of the Seventh ACIS International Conference on Software Engineering, Artificial Intelligence, Networking, and Parallel/Distributed Computing (SNPD’06) 0-7695-2611-X/06 $20.00 © 2006
IEEE
Figure 10. RCS in rotation
3
Figure 11. RCS in coning The biggest difference between scatter model and RCS model is the several vertical lines appeared in RCS model. Compare RCS value with radar image, it is clear that the vertical line is corresponding with strong reflection on certain aspect angles. For example, cylinder surface will have a very strong reflection when aspect angle is 90 degrees and flat plate will have a strong reflection signal at 0 degree. These sudden surges of signal strength will act as an impulse signal, and its energy will spread across full spectrum in frequency domain, thus cause these vertical lines. For vibration and coning, there are no such surges within their signals, so
Figure 13. Real rotation signature no noticeable vertical lines appear. Besides these vertical lines, we still can identify microDoppler signatures. For vibration, both models have the same results. Notice that although the RCS plot for vibration shows a sinus shape, it actually is a magnified plot, the RCS value in vibration actually changes only a tiny bit, since the aspect angle will change a little bit as the target vibrates. For rotation motion, since the RCS for flat plate has a comb shape that causes three lines appeared in radar image instead of one line in scatter model. Notice that for rotation, coning and tumbling, RCS model only show a portion of image compared with that
Figure 12. RCS in tumbling showed in scatter model, this is because one of the two end plates is under the shadow of the cylinder surface, thus no radar signal for that part. Figure 13 shows a rotation micro-Doppler signature obtained from a real radar signal, compare it with Figure 6, it is clear that our RCS model closely assembled real radar signal, except the vertical line is much stronger. In our RCS model, we assume a perfect surface, which generates a stronger signal. A refined RCS model would give us a better result.
3. Target Recognition We simulated 50 different images for each micromotion of each model, which gave us a total of 400 images. For each micro-motion, we randomly choose a motion parameter for each image. For vibration, different vibrating direction, magnitude and frequency were selected. For rotation, coning and tumbling, we used different rotation axis and speed. We used 30 images from each micro-motion as training set and the remaining as testing set. Feature extraction is accomplished by using the principal component analysis (PCA) or independent component analysis (ICA). PCA is the best-known unsupervised linear feature extraction algorithm; it is a linear mapping which uses the eigenvectors with the largest eigenvalues. ICA is also a linear mapping but with iterative capability. It decomposes a set of features into a basis whose components are statistically independent. Learning and classification are accomplished by using Bayes classifier, k-nearest neighbor (k-NN) classifier, linear discrimination classifier (LDC) or support vector machine (SVM). For applications where the global properties such as width and length are more important, PCA is more suitable than ICA. If features such as time-frequency signatures are more spatially localized, ICA is better than PCA. Theoretically, for micro-Doppler signatures, where
Proceedings of the Seventh ACIS International Conference on Software Engineering, Artificial Intelligence, Networking, and Parallel/Distributed Computing (SNPD’06) 0-7695-2611-X/06 $20.00 © 2006
IEEE
4
the localized spatial time-frequency features are more important, the ICA should perform better. Table 1. Point scatter model Feature Classifier Error rate selection PCA
ICA
37.5% 8.75% 7.5%
We would like to thank Dr. Victor C. Chen of NRL, who has made many suggestions and provided support and advice.
3-NN LDC SVM
36.25% 15% 15%
References
Table 2. RCS model
PCA
ICA
Acknowledgements
3-NN LDC SVM
Table 1 and Table 2 show the results from target classification for both models.
Feature selection
saw tooth waveform. When more experimental data using this radar is collected, we will analyze RCS model and its micro-Doppler signatures against the measured experimental radar data.
Classifier
Error
3-NN LDC SVM
2.5% 15% 17.5%
3-NN LDC SVM
2.5% 22.5% 21.25%
The best result for the scatter model is 2.5% error rate (3-NN) and for RCS model is 7.5% (SVM), which proves that a target with different micro-motion can be clearly classified by using its micro-Doppler signatures. The ICA performs as same as the PCA for point scatter model (2.5%), but much worse for RCS model (15% vs. 7.5%). It is understandable that since the target is a simple cylinder, its length is still the major factor. We can expect that the ICA will perform better when we analyze more complex target.
4. Future Work At this stage, only a simple object is studied, and the simulated results are analyzed. Currently, research for more complex object is underway, such as RCS model for a human body. We are also doing experiments with a FMCW radar. This micro-Doppler radar is designed to collect radar data for micro-Doppler signature analysis. The radar is a bi-static FMCW design with a linear FM
[1] V.C. Chen and H. Ling, Time-Frequency Transforms for Radar Imaging and Signal Analysis, Artech House, 2002. [2] J. Lei, and C. Lu, “Target Classification Based on MicroDoppler Signatures”, pp179-183, Proceedings of 2005 IEEE International Radar Conference. [3] L. Cohen, Time-Frequency Analysis, Prentice Hall, 1995. [4] V.C. Chen, F. Li, S.S. Ho, H. Wechsler, “Analysis of MicroDoppler Signatures, IEE Proc-Radar Sonar Navig.”, Vol. 150, No. 4, August, 2003. [5] Duin Robert P.W., PRTools: A Matlab Toolbox for Pattern Recognition, Juanary 2002. [6] Kaufman, Radar System Analysis and Design Using Matlab, 2000. [7] A. Hyvarinen and E. Oja, “Independent component analysis: Algorithms and Applications”, Neural Networks, 13(4-5), pp.411-430, 2000. [8] C.J.C. Burges, “A tutorial on support vector machines for pattern recognition”, Data Mining and Knowledge Discovery, 2, pp.121-167, 1998. [9] Q. Zhao and J. Principe, “Support vector machines for SAR automatic target recognition”, IEEE Trans. on AES, vol.37, no.2, pp.643-654, 2001. [10] Marek Natecz, Rafal Rytel-Andrianik, and Andrzej Wojtkiewicz, “Micro-Doppler Analysis of Signal Received by FMCW Radar,” 2003 International Radar Symposium, Germany, 2003. [11] T. Thayaparan, S. Abrol and E. Riseborough, “MicroDoppler Radar Signatures for Intelligent Target Recognition”, http://www.ottawa.drdc-rddc.gc.ca/html/TM2004-170_e.html
Proceedings of the Seventh ACIS International Conference on Software Engineering, Artificial Intelligence, Networking, and Parallel/Distributed Computing (SNPD’06) 0-7695-2611-X/06 $20.00 © 2006
IEEE
5