Seventh South African Conference on Computational and Applied Mechanics SACAM10 Pretoria, 10–13 January 2010 © SACAM
OBSERVATIONS ON THE SELECTION OF OBJECTIVE FUNCTION FOR THE OPTIMISATION OF TURBINE ENDWALLS USING COMPUTATIONAL FLUID DYNAMICS G Snedden*,1, D Dunn*,2, TW von Backström† and G Ingram‡ *
Aeronautical Systems/DPSS CSIR, PO Box 395, Pretoria, 0001, South Africa, 1
[email protected],
[email protected]. †
Dept. of Mechanical and Mechatronic Engineering University of Stellenbosch, Private Bag X1, Matieland, 7602, South Africa,
[email protected].
‡
School of Engineering and Computing Sciences University of Durham, South Road, Durham, DH1 3LE, UK,
[email protected].
Keywords: turbine, non-axisymmetric, profiled, end wall, secondary flows Abstract The profiling of turbine end walls has gained widespread acceptance as a means to reduce the adverse effects of secondary flows on the overall efficiency of gas turbines via two mechanisms: Firstly the reduction of secondary kinetic energy directly and in the improvement of the flow quality and consistency (both in pressure profile and angle) entering downstream turbine stages. Nearly all major engine manufacturers are involved in the research and development of optimisation techniques as a means of generating these threedimensional and sometimes quite un-intuitive end wall design, but Rolls-Royce were the early leaders in that they were the first patent and introduce to service (in the Trent 500) end walls that had been profiled. At first the emphasis was on the reduction of tangential variation in the exit pressure profile and later, they predicted and proved a 0.5% improvement in efficiency for the Trent 500 HP stage. Since then a rash of researchers have been involved in the development of similar technology for competing engine manufacturers, using similar approaches in terms of the design methodology (mostly based on constrained splines), and the CFD tools used to evaluate the design. However the success of the design is often more a result of the objective function chosen to evaluate the design than it is of the design or analysis methodology. This study examines the results of a CFD and rotating experiment, comparing an annular and a generic end wall design for a model turbine rotor in a 1½ stage turbine at the CSIR, in an attempt to draw some conclusions regarding the proper selection of objective functions during the optimisation process. Nomenclature α β B-L CFD Cske Cx NGV
Outlet flow angle Relative Flow Angle Baldwin-Lomax Computational Fluid Dynamics Coefficient of secondary kinetic energy Axial Velocity Nozzle Guide Vane
RANS Reynolds Averaged Navier-Stokes SST Shear Stress Transport T Temperature U Wheel Speed V Absolute Flow Velocity W Relative Flow Velocity X0, X1, X2, X3, X4 Traverse positions (see Figure 3)
y+
Near wall Reynolds Number
Subscripts: 2 Rotor entrance 3 Rotor exit r radial sec Secondary m mean
Introduction Losses in a turbine can be attributed to three sources, historically identified as: profile loss, leakage loss and end wall loss. Denton [1] states that approximately one third of the end wall loss in high pressure turbines can be attributed to entropy generation in the annulus boundary layers within, upstream and downstream of the blade row. Additional losses are caused by mixing of the inlet boundary layer and the mixing out of secondary kinetic energy which can be of the order of ¼ of the total loss. Local flow separations, early transition and compressible effects may also contribute to the loss.
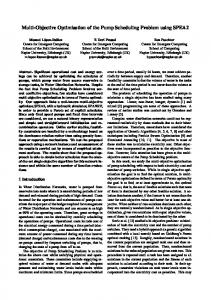
Figure 1: Turbine secondary flows
To illustrate the complexity of the flows concerned, Figure 1 shows the secondary flows computed as part of this study. Coloured streamtubes are used to indicate the suction side leg of the horseshoe vortex (blue) which remains close to the suction surface, held there by the pressure gradient, and the pressure side leg of the horseshoe vortex (red). The pressure side leg of horseshoe vortex is driven across the passage by the pressure gradient in the same direction as the end wall cross flow (green streamlines). The pressure side leg of the horseshoe vortex is then observed to collide and combine with or wrap around the suction side leg of the horseshoe vortex and together climb the suction surface and grow in physical size with the further combination of the passage cross flow. The passage vortex results from low momentum flow on the blade and end wall boundary layer being driven across the passage by the pressure difference between pressure and suction surfaces of adjacent blades. More details regarding the nature and understanding of secondary flows and losses can be found in [2, 3, 4], although the topology is similar in different cases the strength of the secondary flows crucially depends on the magnitude of the flow turning induced by the blades. As turbine manufacturers strive to develop machines that are more efficient, one area of focus has been the control of secondary flows through the use of non-axisymmetric end walls. This involves aerodynamically shaping the platform between the blades, so to profile the blades in Figure 1 a series of “humps” and “dips” would need to be added to the lower surface. This idea dates from the 1960’s but Durham University together with Rolls-Royce and Alstom were amongst the first to study non-axisymmetric end wall contouring for the reduction of secondary flows using modern CFD. This work consists largely of CFD design and highly detailed measurements of the linear rotor cascade dubbed the ‘Durham Cascade’
which has become an industry test case [5]. Brennan and Harvey et al. [6] & [7] claim a onethird reduction in end wall loss or a 0.59% increase in stage efficiency for the high pressure turbine, and even 0.9% efficiency improvement in the intermediate pressure turbine of the Rolls-Royce Trent 500 engine, using non-axisymmetric contouring. ITP [8] have also shown contoured end wall to have a distinct advantage over annular end walls. Rolls-Royce have tended to use objective functions based on the dot product of the coefficient of secondary kinetic energy and helicity (the latter being utilised to more strongly identify the vortical components of the flow at the blade exit) [6, 7]. One of the strongest effects of end wall contouring has however been consistently reported as an improvement in the consistency of the exit flow angle and a suppression of highly over-turned flow to the hub. One of the arguments for using an objective function based on secondary kinetic energy is that the level of accuracy required from CFD is not fine enough to differentiate between candidate designs, quite dramatically Ingram et al. [27] reported that even a secondary kinetic energy based design could produce a profiled end walls that performed worse than a planar one. In contrast Praisner et al. [12] report using the calculated loss increase as part of their objective function so this view is not universally shared. In the absence of transonic flow the basic profiled end wall design is aimed at reducing the end wall cross flow by affecting the pressure gradient. The design consists of a “hill” which reduces the local passage area in an attempt to increase the flow speed and hence decrease the pressure against the pressure surface of the blade, and a “valley” strategically placed close to the suction surface reduces the velocity, increasing the local pressure, see Figure 2. Another way to look at this is that the blades become effectively aft loaded in the vicinity of the contoured end walls. The latter description is what best describes the thrust of research presented by various authors from Carleton University and Pratt and Whitney [9-14] who, using cascade tests and CFD, have studied a series of increasingly more highly loaded blade profiles together with end wall contouring. This has been in an effort to exploit the inherently low mid-span loss of forward loaded blades profiles in low pressure turbines while exploiting non-axisymmetric end wall technology on the hubs to mitigate the associated increased secondary flows resulting from forward loading. These end walls were designed with total pressure loss as the objective function.
Figure 2: Stream line curvature - the basic idea [15]
Relatively few detailed measurements have been made of rotating turbines with and without non-axisymmetric end walls. An exception is Germain et al. [16] and Schuepbach et al. [17], they show a 1% improvement in stage efficiency for a turbine with contoured end walls on both stator and rotor. This latter detailed study indicated that end wall contouring could affect secondary losses but also had a strong effect on midspan loss, significantly most of the
improvement was found to result from the first vane passage. Only a limited amount of information on the design process is available but the process most likely employs objective functions similar to those of Rolls-Royce. To a large extent end walls have been designed through optimisation methods using a variety of objective functions derived from computational fluid dynamics generated data. Some of these parameters are: • Rotor outlet angle • Coefficient of secondary kinetic energy • Helicity • Pressure loss coefficient • Rotor efficiency • Stage efficiency The purpose of this paper is to examine objective functions that could be used during the optimisation process. The CSIR has a rich body of experimental and computational data from a rotating test rig with both profiled and planar end walls, which provides an ideal opportunity to examine the validity of various objective functions. Experimental and computational method Experimental setup A 1½ stage, low speed, turbine test rig, originally of the University of Natal [18], where it was used for tip loss measurements, has been installed and refurbished at the CSIR in Pretoria, South Africa. Figure 3 indicates the general layout and instrumentation of the test rig. The test rig has a hub and tip radius of 0.142 m and 0.203 m respectively and is designed for a maximum wheel speed of 3000 RPM. A radial fan draws atmospheric air through the rig, inducing a pressure drop of 4.8 kPa for a mass-flow of 3.39 kg/s, corresponding to an inlet velocity of about 30 m/s. The radial fan is driven by an electric motor with variable speed control. The turbine power is absorbed by a hydraulic motor, giving independent rotor speed control. More detail on the test rig and blading design can be found in [19, 20]. Inlet turbulence intensity was measured to be less than 1%. The test rig’s blading can be rapidly changed, redesigned and manufactured. This is in part due to the low speed operation of the rig, which allows for the chosen, direct laser sintering, manufacturing technique for the blades and the simple attachment method utilising a helical t-slot. Figures 4 and 5 show details of the blades and their attachment method. The hub Reynolds number based on axial chord at rotor exit is approximately 127 500 compared to the Durham cascade at 400 000. The rotor tip gap is relatively large at 1.7% of span, while that for the stators is 0.8% of span. Fillet radii of 1mm are used at the junction between blade and end wall. Blade numbers were selected to ensure direct comparison to CFD using the Domain Scaling method required for unsteady CFD analysis, and to restrict axial chord length to that available in the test rig while maintaining a sufficient gap to accommodate the 5-hole probe with a 1.6 mm tip diameter. The resulting blade numbers were 30 stators and 20 rotor blades. Area
traverses are performed using a traverse for radial movement and null yawing (used behind the rotor). Tangential movements are made by rotating a section of the casing via a stepper drive; this necessitates a tip clearance for both the stator and rotor rows. Pitchwise average results are the results of 33 measurements 0.5˚ apart behind the stator and 3 measurements 9˚ apart behind the rotor. 5-Hole probe measurements followed the methodology of Ingram and Gregory-Smith [21]. The test rig allows for independent control of the rotor wheel speed and the inlet mass flow or axial velocity. For the purposes of these tests the inlet axial velocity was held constant at 21.38m/s, while the wheel speed was set to 1907, 2300 and 2820 RPM to give approximately +5° incidence in the highly loaded case, 0° at design, and -5° incidence in the reduced loading case at the hub, respectively, see Figure 7. In essence the flow coefficient is controlled throughout a given traverse. Most of the results presented here will be for the design case, however. Computational fluid dynamics The CFD code chosen for this work was Numeca FineTM/TURBO v8 [22], which is dedicated for turbomachinery use and includes the capability to distort the mesh onto non-axisymmetric end wall geometries. Three stator passages and two rotor passages were modelled to enable domain scaling to be utilised during unsteady CFD computations on the same mesh at a later date. For the steady state solutions presented here a mixing plane with conservative coupling is located at the stator/rotor and rotor/stator interfaces. Although the 2nd Stator is not the focus of this study it was retained in the test rig for practical reasons and in the CFD mesh to ensure consistency with the experiments. The mesh used for the CFD computations is a fully structured hexagonal mesh consisting of in excess of 5 million cells which approached the hardware memory capacity available at the start of this work. There are 49 cell rows in the radial direction for the NGV and the 2nd stator and 81 cell rows for the rotor. The cells are given a parabolic distribution to increase mesh density in the boundary layer region at the end walls. The cell width at the hub and at the shroud (casing) is set at 0.5 mm. The tip gaps each contain 17 cells, also distributed in a parabolic manner like those in the blade passage. Images of the final mesh are to be found in Figure 6. The average y+ for the domain is less than 1 with a maximum of 2.2 on the blade surface. Interrogation of the multigrid results shows the results in the boundary layer to be grid independent. In the midspan where the greatest physical size changes to the mesh take place between multigrid levels, the results differ by as little as 0.5° in rotor relative outlet angle and 1m/s on velocity for the Baldwin-Lomax CFD results and 1.5° and 1.5 m/s for the SST k-ω case, with the finest mesh results tending towards the experimental results. Both the Baldwin-Lomax and SST k-ω models were used throughout this study as per Dunn et al. [23] and are implemented as standard in FineTM/TURBO v8, without custom coefficients.
Airflow
Intake X0, radial only
Intake Strut
8 Way Slip Ring
Pstatic and Tstatic rings
X1, radial only X2
Rotor X3 22ndndStator Stator
X4
radial and circumferential
1st Stator
Axial Traverse Positions
Surface Gauges via Slip ring
(a)
(b)
Figure 5: Rendered representations of the CSIR rotor blades (a) Annular rotor and (b) Contoured rotor
Speed (RPM), Torque Flow straightener and support
Dynamometer Control valve
Figure 6: CFD mesh
Frequency control
Figure 3: Schematic of 1½ stage turbine and control and measurement instrumentation
Figure 4: Direct laser sintered rotor blade with end wall contouring
Figure 7: Flow triangles for on- and off-design operation
The fillets between the blade and end wall are not modelled. This is contrary to the recommendations of Germain et al. [16], a study that indicated the importance of modelling the fillets, but which emerged after completion of the CFD mesh for this case. Results and Discussion The results presented take three forms, mass averaged results for quantities at rotor exit, graphs of the spanwise distributions of these and other quantities aimed at investigating the source of differences and similarities between experimentally measured and numerically generated results, and 2D contour plots of CFD generated quantities where no experimental comparison is possible. Firstly Figure 8 and 9 show some of the more fundamental quantities at rotor exit, relative flow velocity and angle as a function of span. The design values are generated using a streamline throughflow code which included empirical loss models [24]. In Figure 8 the relative outlet velocity from the rotor shows a region of over sped flow between 0 and 25% span the region is marginally reduced in span-wise influence and velocity with the introduction of contoured end walls. The CFD results mimic the experimental results but the lower order Baldwin-Lomax results capture the absolute values more accurately than those of the 2 equation SST model. Figure 9 shows the dramatic overturning of flow in the lower 25% of span and the clear suppression of this overturning towards the hub with contouring of the end walls. Again the CFD quite clearly mimic the experimental results although the SST model again overestimates the span-wise extent of the secondary flows, particularly in the annular case. Similar observations can be made with regard to the underturned flow between 25 and 70% span. Efficiency improvement is the ultimate goal of any turbine optimisation attempt. Figures 10 and 11, read in conjunction with Table 1, show the small improvements indicated by the experiments in both stage and rotor efficiency for the current turbine design, while the CFD results are less convincing. Furthermore, the figures and table show the clear differences between the absolute values of efficiency predicted and measured. The trends are well predicted but insensitive in terms of producing clearly recognisable secondary flow features. The absolute values from CFD are far from that of the experiment and without any comparison available in the literature of efficiency levels rather than differences it is hard to evaluate this result objectively. Furthermore a quick analysis reveals that as little as a 0.25˚C error in temperature can affect as much as a 10% change in predicted efficiency. In addition the results are clearly sensitive to the turbulence model chosen. Total pressure loss, another common measure of loss and Figure 12 and Table 1 show the results found as part of this study. The total pressure loss increases in all measurements and predictions which suggests that the turbine is less efficient with the addition of contoured end walls. However an examination of the spanwise profiles suggests that this increase is more due to the tip clearance flows (which are influenced by the secondary flows, Snedden et al. [19]) and the effect the end walls have of unwrapping the various components of the secondary vertical structures (Snedden et al. [19]), which is seen at 40 to 70% span. Ultimately this parameter therefore indicates the opposite result to than found in the efficiency results. The next parameter commonly used in an attempt to isolate only the secondary flow loss components is that of the Coefficient of Secondary Kinetic Energy, which is defined below: V 2 +V 2 Cske = sec 2 r (1) Cx where Vsec = V ⋅ sin(α − α m ) (2)
Contoured
100
100
90
90
80
80
70
70
60
60
Span (%)
Span (%)
Annular
50 40
50 40
30
30
20
20
10
10
0
0 35
40
45
50
55
60
65
35
40
45
50
W3 (m/s)
55
60
65
W3 (m/s)
0˚ incidence Experimental
Design
Baldwin-Lomax SST k-ω Figure 8: Pitch averaged relative rotor outlet velocity
Contoured
100
100
90
90
80
80
70
70
60
60
Span (%)
Span (%)
Annular
50 40
50 40
30
30
20
20
10
10
0
0 55
60
65
70
75
80
55
60
β3 (°)
65
70
75
80
β3 (°)
0˚ incidence Experimental
Design
Baldwin-Lomax SST k-ω Figure 9: Pitch averaged relative rotor outlet angle
Although Cske does not predict the reduction of secondary flows in terms of the mass averaged numbers at design, it does so well at higher loading (Table 1), and the experiment shows a clear reduction in both loading cases. An examination of the span wise profiles (Figure 13) of the coefficient of secondary kinetic energy shows that the coefficient clearly isolates the secondary flows in the region 0-40% span very well, an effect that is greatly exaggerated in the CFD results, which, far from detracting from the use of this quantity should attract one to its use as a quantity particularly sensitive to end wall driven secondary flows. Rolls-Royce in particular use a further quantity in conjunction with Cske in order to better identify the positions of vortices, this quantity is known as helicity. Helicity can be described as the dot product of the velocity and vorticity fields and gives an indication of the sense and strength of vortices in the flow direction. Unfortunately due to the planar nature of five hole probe steady state measurement technique, vorticity was not an output of the experiments and henceforth only CFD results were available. Table 2 indicates that these quantities (mass averaged by a different method to those in Table 1) are equally as unsuccessful as all the preceding quantities in predicting the outcome of the optimisation. However Figure 14, showing a contour map of these quantities indicates that the tip clearance flows are dominating the mass averaged numbers, and that in the bottom half of the span there is a clear reduction in overall
H.Cske. A sensitivity analysis indicates that these quantities are less prone to inaccuracies than the efficiency calculation, a difference in velocities in the second order (solver accuracy) yielding just a ±1.5% change in these terms. Summary and conclusions The dilemma facing the turbine designer is that during the optimisation process using CFD a good prediction of loss is required, however CFD does not yet give results that are sufficient for the prediction of loss or efficiency. This is a fundamental problem of RANS solvers as due to the formation of a new boundary layer underneath the passage vortex whatever the nominal Reynolds number some transitional flow will always be present in high turning turbine flows. As has been shown in the previous section, not one of the parameters chosen by other researchers in this field gives results consistent between experiment and CFD as well as turbulence model. For example although the Baldwin-Lomax CFD predicts the stage efficiency rise it does not predict the rotor efficiency rise. The ultimate goal is to find an indication for loss that: 1. Acts as a proxy for loss or entropy gain 2. Has a wide range of applicability or easily defined limits of applicability 3. Can locate sources of loss within a blade passage 4. Is computationally cheap.
Table 1: Mass averaged Quantities
Model (repeatability) Stage Efficiency
Rotor Efficiency
Pressure Loss Coefficient
Cske Design point
Cske
Annular (%)
Profiled (%)
∆
Experiment (