Thayer School of Engineering, Dartmouth College, Hanover, New Hampshire, USA, ... is a computer program that simulates human experts to assist people in decision .... to maintain a list of conditional probability, since all the probability ...
On Deception Detection in Multi-Agent Systems and Deception Intent Eugene Santos Jr., Deqing Li, Xiuqing Yuan Thayer School of Engineering, Dartmouth College, Hanover, New Hampshire, USA, {Eugene.Santos.Jr, Deqing.Li, Xuiqing.Yuan}@dartmouth.edu ABSTRACT Deception detection plays an important role in the military decision-making process, but detecting deception is a challenging task. The deception planning process involves a number of human factors. It is intent-driven where intentions are usually hidden or not easily observable. As a result, in order to detect deception, any adversary model must have the capability to capture the adversary’s intent. This paper discusses deception detection in multi-agent systems and in adversary modeling. We examined psychological and cognitive science research on deception and implemented various theories of deception within our approach. First, in multi-agent expert systems, one detection method uses correlations between agents to predict reasonable opinions/responses of other agents (Santos & Johnson, 2004). We further explore this idea and present studies that show the impact of different factors on detection success rate. Second, from adversary modeling, our detection method focuses on inferring adversary intent. By combining deception “branches” with intent inference models, we can estimate an adversary’s deceptive activities and at the same time enhance intent inference. Two major kinds of deceptions are developed in this approach in different fashions. Simulative deception attempts to find inconsistency in observables, while dissimulative deception emphasizes the inference of enemy intentions. Keyword: deception detection, multi-agent system, Bayesian network, Bayesian knowledge base, deception intent, adversary intent inference model
1. INTRODUCTION Deception has been defined in many different ways. Two of the most commonly accepted definitions come from Whaley and Burgoon (Santos, 2004). According to Whaley (1991), deception is “information designed to manipulate the behavior of others by inducing them to accept a false or distorted presentation of their environment- physical, social, or political”. Burgoon (1994) defines deception as a “deliberate act perpetrated by a sender to engender in a receiver’s beliefs contrary to what the sender believes is true to put the receiver at a disadvantage”. Moreover, Whaley and Burgoon also classified deception as either simulative or dissimulative. More details about the classification will be discussed in the next section. Simulation tools have long been used to help people in decision making. For example, an intelligent system is a computer program that simulates human experts to assist people in decision making. For deception detection, a multi-agent intelligent system can be used to model a group of experts, who share information from several different sources, communicate and cooperate with each other to reach a conclusion. Without such a model, when deception is introduced into the decision making process, it is difficult to verify the information provided by the experts and thus incorrect decisions may result (Santos & Johnson, 2004). Another example is the simulation tools developed for war-gaming environments. In order to model the adversaries effectively, it is necessary to detect human deceptions since many military tactics involve
Modeling and Simulation for Military Operations III, edited by Dawn A. Trevisani Proc. of SPIE Vol. 6965, 696502, (2008) · 0277-786X/08/$18 · doi: 10.1117/12.777639
Proc. of SPIE Vol. 6965 696502-1
deception operations. However, deception detection is a very challenging job. Psychological studies show that only 60% of deception in face-to-face interaction is detected (Depaulo, 1988), and the probability is even lower in interaction through electronic media (George, 2003). Therefore, an effective way to determine deceptive information is not only important but also urgently needed (Santos and Negri, 2004). There are several approaches to detecting deception. For multi-agent systems, Santos and Johnson (2004) proposed a method to compare opinions between experts who share similar knowledge. This method is able to identify possible deceptions if an expert provides opinions far from the expectation. For adversary modeling, Yuan (2007) proposed a framework that combines a deception detection mechanism with an adversary intent inference model. The purpose is to detect any deceptive action based on an adversary’s intent. We will investigate these two ideas in this paper. In Section 2, we introduce the background information applied in deception detection. In Section 3, we study the performance of Santos and Johnson’s method through a detailed parametric study. To be more specific, we explore which factors of the system have the most significant impacts on detection success rate. In Section 4, we explore a deception intent model which is based on the innovative idea that human deceptions are always intent-driven1. Lastly, we present our conclusions and future work in Section 5.
2. BACKGROUND Here we will introduce deception detection theories including the classification of deception and the process to detect deceptions. Moreover, knowledge based systems used to represent the multi-agent systems will also be described. As mentioned above, deception can be classified as either simulative or dissimulative (Whaley, 1991). Since the aim of simulative deception is to create false beliefs, it is further split into Mimicking, Inventing, and Decoying. In mimicking, an attempt is made to simulate other things; in inventing, an attempt is made to create a new reality that is different from the actual reality; and in decoying, an attempt is made to lure the target of the deception away from discovering the real truth. On the other hand, dissimulative deception focuses on hiding the truth. Similarly, it is divided into Masking, Repackaging, and Dazzling. In masking, one attempts to hide the real by blending it with the background or making the real invisible; in repackaging, one attempts to hide the real by repackaging it in an irrelevant appearance; and in dazzling, one attempts to hide the real through causing uncertainty when there is no hope of invisibility and repackaging (Bowyer, 1982). These theories of classification of deception are very important. We can detect deception by observing the patterns featured by any kind of the deception, which is applied in the deception intent model to be discussed later. Deception detection is not an easy job. Johnson and Grazioli (2001) suggest the use of four processes to detect deceptions. Firstly, we should attempt to observe misattributions in the environment. If any misattribution is identified, further detection processes will then be activated. Secondly, we attempt to generate deception hypotheses about suspected manipulations in the environment in a process called “Hypothesis Generation”. Thirdly, in order to evaluate the hypothesis, the representation of the environment which is observed is edited so that it is consistent with the hypothesized manipulations. Finally, all the accepted hypotheses are combined to produce a final outcome. As mentioned earlier, we can mimic the decision making process of human experts using a multi-agent intelligent system, so naturally the agents we use is knowledge based. There are two components in a knowledge based system: a knowledge base and an inference engine. The knowledge base stores all the knowledge in an organized data format, while the inference engine reasons through the information in the
1
A preliminary version of this idea can be found in (Yuan, 2007)
Proc. of SPIE Vol. 6965 696502-2
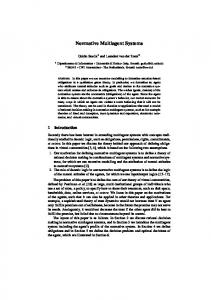
knowledge base in order to reach a conclusion. Among the many knowledge based systems, Bayesian Networks are commonly used to represent uncertain expert knowledge (Pearl, 1988, Santos, 1991). A Bayesian network (BN) is represented by a directed acyclic graph. Each node in the graph represents a concept in the expert’s knowledge, and each edge denotes the relationship between the two nodes it connects with. Figure 2.1 shows an example of a Bayesian network. It is a BN fragment that describes the causes and consequences of bronchitis and cancer. As shown in this image, each node has two states. It maintains a conditional probability distribution P(xi | Parents(xi)) given the states of all its parents. In this way, a Bayesian network encodes a structural relationship between each concept. P (Gender=male) = 0.6
Gender
P (Smoking=yes | Gender=male) = 0.6 P (Smoking=yes | Gender=female) = 0.2 P (Bronchitis=yes | Smoking=yes) = 0.7
Smoking
P (Bronchitis=yes | Smoking=no) = 0.001 Bronchitis
Fatigue
Cancer
P (Cancer=yes | Smoking=yes) = 0.3 P (Cancer=yes | Smoking=no) = 0.1 P (Fatigue=yes | Bronchitis=yes, Cancer=yes) = 0.9 P (Fatigue=yes | Bronchitis=yes, Cancer=no) = 0.1 P (Fatigue=yes | Bronchitis=no, Cancer=yes) = 0.8 P (Fatigue=yes | Bronchitis=no, Cancer=no) = 0 Figure 2.1 Fragment of Bayesian network
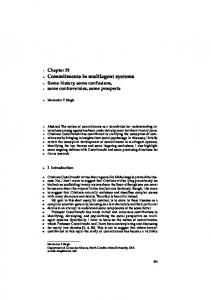
The purpose of a BN is to perform inference, which is to calculate the probability of each state of some nodes while the states of other nodes are known. To infer the network, the states of some nodes are pre-set, which we call “set as evidence”. Then, using the conditional probability distribution, the probability of each state of the unknown nodes can be computed. Although the BN is a commonly accepted data structure, we use another knowledge based representation called Bayesian Knowledge-Bases (BKBs) in the deception intent model (Santos & Santos, 1999, Santos, Santos, & Shimony, 2003). Similar to BNs, BKBs are also directed graphical representations of information. The difference between BNs and BKBs is that BKBs accommodate incomplete information. In a BKB network, nodes are divided into instantiation nodes (I-nodes) and support nodes (S-nodes). An Inode contains a concept, and an S-node contains the conditional probability of its head I-node given the state(s) of its tail I-node(s). Figure 2.2 shows a comparison between a BN and a BKB fragment. White nodes in the BKB fragment denote I-nodes, and black nodes denote S-nodes. Note that BKB does not need to maintain a list of conditional probability, since all the probability information is represented in the Snodes. Therefore, the BKB fragment supports information incompleteness by allowing nodes without requiring all the conditional probabilities under all the states of their parents. Moreover, it is not necessary for an I-node to have a prior probability due to unavailable information. For example, the I-node A=a’ does not need to have its S-node 0.6 to support it if the information is not accessible.
Proc. of SPIE Vol. 6965 696502-3
PIAa) 0.4
0.6
0.4
0.7
P(6b} = 0.7
P(Cc14a.Bb} = 0.5
0.5
P(CcIAa,Bb) 0.3
P(CcIAa.Bb) = 0.15
P(Cc14a,Bb) 0.05 Bayesian Network
Bayesian KnowLedge Base
Figure 2.2 Comparison of Bayesian network and Bayesian knowledge base
3. DECEPTION DETECTION IN MULTI-AGENT SYSTEMS The simple idea behind deception detection in multi-agent expert systems is that if several experts share similar knowledge, their opinions are expected to be similar. Therefore, if any of the experts’ opinions is far from expectation, a possible deception may have been identified. There are three processes in this method. At first, we assume that all the intelligent agents share the same structure and similar background knowledge, so that it is reasonable to predict one agent’s opinion based on all other agents’ opinions. However, in order to predict one agent’s opinion, we need to know its relation to other agents. Therefore, the first process is to compare the agents. Since the correlation is based on an agent’s past opinions, random test cases were executed on the system to produce several sets of responses. This process is called training. Next, we use every agent’s opinions from the training process to calculate the Pearson Correlation between them. The correlation values show the linear dependence between the agents. We then we proceed to the second process which is prediction. The GroupLens prediction technique (Resnick et al., 1994) is used to give an estimation of one agent’s opinion based on its correlations with all other agents and their opinions. This process is called testing. The final process is to identify potential deceptions. Depending on how far away one agent’s opinion is from others’, we determine whether to activate further detection processes. In practice, we assume that the error between the predicted opinion and the exact opinion has a normal distribution. If the difference between the exact opinion and the predicted opinion is more than three times the standard deviation, then we say that a possible deception has been detected (Santos and Johnson, 2004). The effectiveness of this method has been shown in Santos and Johnson’s study, which employed a virtual multi-agent system testbed (Santos and Johnson, 2004). The system testbed was constructed with the alarm network (Beinlich et al., 1989) which was originally used to monitor patients in intensive care. The alarm network is chosen as the initial testbed because of its moderate size and structure. In the experiments, we explore various factors in detail that may potentially influence the performance of the method. The parameters that we investigated are the number of agents used in the multi-agent system, the perturbation value that determines the similarity between the agents, the number of random variables that are set as evidence, and the number of standard deviations within which the difference between predicted and exact opinions is accepted. To explore the parameters’ influence, we performed random test cases on the system while varying each of the parameters. The mean detection rates resulting from the experiments were recorded and analyzed. In the first experiment, we varied the number of agents used to predict opinions. By having more agents, we may expect the decision making process to be influenced by more participants. In the mean time, we
Proc. of SPIE Vol. 6965 696502-4
changed the perturbation value for each experiment. The perturbation value is represented by an interval within which the states of each node in the network can be perturbed. Its function is to control the similarity in the knowledge shared by the agents. If the agents have similar knowledge, they tend to agree with each other and give similar opinions, and the prediction on one’s opinion is expected to be more precise. Table 3.1 shows the result of varying the number of agents and the perturbation value. It is obvious that as the perturbation value increases, the detection rate decays. The reason is that when there is more noise in the system, the agents will be less accurate, and therefore, fewer deceptions will be identified. However, as this table indicates, the number of agents does not seem to influence the result significantly since the detection rates are little changed even as the number of agents changes. Table 3.1 Mean detection rates on different agent number and perturbation value
Agents 3 10 30 100
(-0.1, 0.1) 0.936 0.9022 0.8902 0.8923
Perturbation Interval (-0.2, 0.2) (-0.3, 0.3) 0.7843 0.7285 0.7433 0.6261 0.7455 0.6396 0.747 0.637
(-0.4, 0.4) 0.6088 0.5878 0.5692 0.5792
In the second experiment, we varied the number of evidence. Before each inference is conducted, we fixed the state of different numbers of nodes, and then calculated the probabilities of states of other nodes. The number of evidence denotes the amount of fact in the environment, and the amount of fact may affect how well we can observe the inconsistency. To be more specific, the more we know about the environment, the more capable we are to detect any unusual observables. Table 3.2 presents the result of the experiment. We can see that the more evidence that is set, the more deceptions the system is able to detect. The reason is intuitive. More evidence indicates that we have more information about the environment, and therefore, it is easier for us to identify any unusual opinions. Table 3.2 Mean detection rates on different evidence number
Evidence 1-10 11-20 21-30
(-0.1, 0.1) 0.9066 0.955 0.9829
Perturbation Interval (-0.2, 0.2) (-0.3, 0.3) 0.7715 0.638 0.8922 0.8404 0.9716 0.9435
(-0.4, 0.4) 0.5568 0.7723 0.9359
The last experiment worked on the number of standard deviations. Different number of standard deviations denotes how much error we accept in the responses of experts. To be more intuitive, it determines how sensitive we are about the error, which naturally affects the detection rates. Table 3.3 shows the result of the experiment. As shown in the result, as the number of standard deviations shrinks, the detection rate increases. It is because if the error that we can accept between predicted and exact opinions is small, more opinions will fall out of this range and be regarded as potential deceptions, which increases the detection rate. On the other hand, since we are more sensitive to error, some correct responses which are accidentally not within our strict expectation will be regarded as deceptions. Therefore, the false detection rate also increases as the number of standard deviations decreases. Table 3.3 Mean detection rates on different number of std
# of STD 4 3 2 1
(-0.1, 0.1) 0.8496 0.9037 0.9383 0.9885
Perturbation Interval (-0.2, 0.2) (-0.3, 0.3) 0.6403 0.5195 0.7748 0.6163 0.8529 0.7445 0.9556 0.9181
Proc. of SPIE Vol. 6965 696502-5
(-0.4, 0.4) 0.4349 0.5327 0.6858 0.859
Table 3.4 concludes the experimental results by suggesting which parameters affect the detection rate of our method. ANOVA analysis was used to produce the statistics. ANOVA analysis is a commonly used technique that calculates whether differences exist between groups. By comparing four groups with different numbers of agents, four groups with different perturbations, three groups with different numbers of evidence, and four groups with different numbers of standard deviations, we obtained an F value and an F critical value for each parameter. If an F value is higher than its corresponding F critical value, then it means that the parameter makes a difference in the detection rate, otherwise the parameter does not have significant influence. The following table suggests that perturbation value, number of pieces of evidence and number of standard deviations all have strong impact on the system, while the number of agents does not. The F values of the number of pieces of evidence and the number of standard deviations are especially higher than their F critical values. Again, it can be explained that the more we know about the truth, and the less forgiving we are about the errors, the more deceptions we will be able to detect. Table 3.4 ANOVA analysis of parameter influence
Parameter F Value F Critical P Value Significance
Agents 2.5 3.1 0.09 Not
Perturbation 346.3 2.68