Keywords: continuous media, storage servers, price-performance, disk storage. ..... a brute-force approach and examine the entire solution space to choose the.
On Evaluating the Cost-Performance Characteristics of Disk Storage Systems Supporting Continuous Media1 D. Venkatesh and T.D.C. Little
Multimedia Communications Laboratory Department of Electrical and Computer Engineering 44 Cummington Street, Boston University, Boston, Massachusetts 02215, USA (617) 353-9877, (617) 353-6440 fax {dinesha,tdcl}@bu.edu MCL Technical Report 04-06-96 Abstract–Disk based storage systems serving continuous media content are evaluated using metrics such as startup latency, buffer size, and the number of concurrent streams. The design of a practical system must evaluate the tradeoffs among these parameters to achieve a target system performance while minimizing operational costs. In this paper, we describe a generic model that can be used for characterizing the performance of disk based storage systems. We subsequently develop a formulation that relates the performance of the storage system to the cost of implementation. The model is evaluated using current disk and memory prices to determine the cost per unit bandwidth and cost per session and evaluate the best operating point for a given session bandwidth and latency requirement. The results demonstrate the utility of the proposed method in designing video servers. We believe this technique to be essential to evaluate the feasibility of building economical storage architectures. Keywords: continuous media, storage servers, price-performance, disk storage.
1
In Proc. 6th Intl. Workshop on Network and Operating System Support for Digital Audio and Video, Zushi, Japan, April 1996. This work is supported in part by EMC Corporation and the National Science Foundation under Grant No. IRI-9502702.
1
Introduction
Disk based storage architectures are among the most popular for building interactive multimedia information systems. This is primarily due to the relatively high price-performance ratio for disk systems in comparison with other forms of storage such as magnetic/optical tape drives and solid state memory devices. Existing disk architectures provide sustained data transfer rates of the order of 4-6 MB/s which is sufficient to support tens of concurrent MPEG-I sessions. Disk based storage architectures serving continuous media have been evaluated based upon their startup latency, buffering requirement, throughput, capacity utilization, and the number of concurrent streams supported. Most studies evaluate these performance measures in isolation and neglect to consider the effects of the design on the cost of building the system. Moreover, most multimedia storage server designs have focused on the requirements of serving video to the home. The recent growth of the Internet has renewed interest in building systems that can serve a diverse user population and support a heterogeneous media set. As a result, media servers will be required to handle the bandwidth requirements of several media types. Considering only single data types (such as MPEG-I) makes it difficult to visualize the implications of implementing an identical architecture with different system requirements. It is apparent that storage servers must be evaluated on a case-by-case basis, i.e., a single architecture cannot meet the requirements of a generic application set. In this paper, we propose a more general methodology for evaluating the performance of disk-based storage architectures for multimedia data. The proposed technique allows a designer to examine the tradeoffs among the different performance parameters that can be used to build a system that minimizes the operational cost for a desired level of performance. This goal is achieved by analyzing the price-performance behavior of a disk storage system at several operating points and selecting one that meets all the performance criteria while simultaneously minimizing the cost. We can apply this model to available disk and storage costs to evaluate the performance of disk architectures for many scenarios. The results demonstrate the significance of evaluating disk based storage architectures from a cost-performance perspective. They also demonstrate the utility of the techniques developed in this paper to the designers of video server systems. The issue of reducing the cost of implementation of a multimedia server has received attention only in the recent past. In early studies of video server design, the main focus 2
was to improve system throughput. More recently Stoller and DeTreville considered the cost implications of providing video-on-demand services to a large user population [14]. Chen and Zakhor [3], Ozden, Rastogi and Silberschatz [9] and Chervenak, Patterson and Katz [6] have examined cost models for supporting video on demand. However, their studies examine the cost-performance behavior for a single bandwidth. The main contribution of this paper its examination of the cost-performance behavior of disk storage across a range of bandwidth requirements. To our knowledge, this effort is the first to address the issues of price-performance tradeoffs for a range of session requirements. The rest of the paper is organized as follows. In Section 2, we discuss existing models for evaluating disk system performance and develop a function that allows us to predict the performance of a storage system. In Section 3 we consider the tradeoffs among these parameters and map them to a cost function. We subsequently describe the implications of the proposed cost function using available disk and buffer price and performance attributes in Section 4. Conclusions and future work are presented in Section 5.
2
Disk Performance Characterization
A single disk system can support multiple user sessions when the disk I/O bandwidth is greater than the per session bandwidth requirement by multiplexing the disk I/O bandwidth among the users. This is achieved by retrieving data for a user session at the disk transfer rate, buffering them, and delivering them to the user at the desired rate. Continuous data delivery is ensured by guaranteeing that the buffer neither overflows nor underflows during the session’s duration [1]. The use of parallel disk arrays as a mechanism for aggregating the bandwidths of several disk devices is also prevalent. In disk array systems, data are retrieved in parallel from multiple disks for delivery. Combining the bandwidths of multiple disk units increases the I/O capacity and adding redundancy can improve the system reliability [5]. Achieving perfect disk bandwidth utilization is a difficult task. The electro-mechanical nature of the disk precludes the instantaneous switching of the disk retrieval mechanism among user sessions. The latency is primarily due to the head-switch, seek, and rotational latencies that a disk incurs when it tries to position its heads on the relevant data [11, 13]. Furthermore, the disk geometry results in bands of different data transfer rates. As a result, it is not possible to perfectly map user sessions to the data organization unless the requests are known a priori [8].
3
Available disk bandwidth is shared among concurrent sessions by specifying an operational period called the scheduling interval [4, 10]. Within each interval, sufficient data are retrieved for each user session for delivery in the subsequent retrieval period. The order of retrieval among sessions depends on the disk scheduling mechanism [13]. The number of concurrent sessions a disk can support is thus a direct function of the scheduling interval, the disk transfer rate, the session consumption rate, and any additional protocol overheads. For disk arrays, the number of concurrent sessions depends on the method used to stripe data. The techniques that are available include bit interleaving and block interleaving. From a practical standpoint, a disk array can be visualized as equivalent to a disk supporting substreams whose bandwidth requirements are a fraction of the original stream. In other words, if D is the number of disks in an array and R is the stream bandwidth, each disk in the array can be visualized as supporting sub-streams with bandwidth requirements of
D . R
Based on
this discussion, it is clear that it must be possible to develop a model that can characterize the performance of disk storage systems. If B is the amount of data that is retrieved for a session within a scheduling interval, the duration of the scheduling interval Tc is given by
B . R
If individual sessions are assumed to
be independent, each disk retrieval involves an overhead Tlat consisting of seek (Tseek ) and rotational (Trot ) latencies. If Rd represents the average disk transfer rate, the time taken by the disk to transfer the data for a session is given by Td = Tlat +
B Rd
where Tlat = Tseek + Trot . In this paper we approximate the disk transfer rate Rd as constant. In reality, Rd is a function of the recorded bit density and the disk rotation speed. (Techniques such as track pairing can achieve disk transfer rates that are almost constant [2].) Of these overheads, Tseek is difficult to estimate. If we assume that the disk scheduler ensures that the entire disk surface is swept only once during each scheduling interval and that this time is shared uniformly among all sessions,2 an estimate for Tseek is Tseek = Tmin +
Tmax . N
Here, N is the number of concurrent sessions whose data are retrieved within each scheduling interval from the disk, Tmin is the seek time between adjacent tracks, and Tmax is the endto-end track seek time. We also approximate Trot to be one half disk rotation time. 2
The approximation is a simplification of the preseeking algorithm proposed in [7].
4
The number of concurrent sessions that can be supported from a disk for a given session bandwidth can be then estimated as b TTdc c or
B R
− Tmax , N= B Tmin + Rd + Trot
N≤
�
Rd . R �
(1)
Similarly, the dependency of the number of sessions that can be supported for a given Tc can be computed using the relation B = Tc R as
Tc − Tmax , N= RTc Tmin + Rd + Trot
N≤
�
Rd . R �
(2)
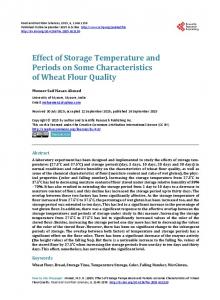
The inequality in Eq. 1 ensures that the cumulative session bandwidth never exceeds available disk bandwidth. Fig. 1 illustrates the variation of N with Tc for a single disk with Rd 4.5 MB/s and display rates of 1.5, 3, 4.5, 6, and 7.5 Mb/s. We also assume that Tmax = 24ms, Tmin = 1.7ms, and Trot = 5.55ms.3 The effects of B on N are illustrated by the dotted lines and the effects of Tc on N are illustrated by the solid lines. 18
100 kB 80 kB
16 14
Number of Sessions
1.5 Mb/s
60 kB
12
40 kB
10
3.0 Mb/s 8
20 kB
6
4.5 Mb/s
4
6.0 Mb/s 7.5 Mb/s
2 0 0
0.1
0.2
0.3
0.4
0.5
0.6
Cycle Time
Figure 1: Effects of Tc and B on N 3
These values are obtained from the specifications of the Seagate ST410800N/ND Elite disk drive [12].
5
The figure shows that as the amount of data retrieved within a scheduling interval for a session B increases, the number of concurrent sessions increases, although at higher startup latencies. Additionly, high bandwidth sessions can be supported with lower startup latencies. The fractional gains due to increasing the stream buffer capacity decrease with increasing Tc and these gains are minimal for high bandwidth streams. Fig. 2 illustrates the fraction of disk bandwidth that can be effectively utilized. The achievable disk utilization is highest for the low bandwidth streams and less for the high bandwidth streams. However, the curve is not smooth because a fraction of the disk bandwidth is wasted by supporting an integral number of sessions. The fraction of wasted bandwidth can be minimized by increasing Tc to accommodate an additional session especially when
Rd R
is close to an integer. 1 1 Disk 8 Disks
Maximum Achievable Disk Utilization
0.9
0.8
0.7
0.6
0.5 3 10
4
10
5
6
10 10 Session Bandwidth
7
10
8
10
Figure 2: Disk Utilization versus R
Fig. 3 illustrates the value of Tc necessary to achieve the highest disk utilization (i.e., support a maximum number of sessions) for a given session bandwidth. It can be seen that trying to achieve high disk utilization results in prohibitively high values of Tc for several bandwidths. Thus, there is a tradeoff between the per-session cost and the disk bandwidth utilization which in turn has a direct bearing on the system cost. For block interleaved disk arrays, we can develop a similar performance model by replacing R with R/D. Thus, the number of sessions that can be supported by an array with D 6
10
10
1 Disk 8 Disks
Scheduling Interval to Achive Maximum Utilization
8
10
6
10
4
10
2
10
0
10
-2
10
3
4
10
10
5
6
7
10 10 Session Bandwidth (b/s)
8
10
10
Figure 3: Tc to Support Maximum N
disks can be estimated as
BD R
− Tmax , N= Tmin + RBd + Trot
N≤
�
Rd D . R �
(3)
For a disk array, the size of the buffer required to support a given scheduling interval depends on whether the stripe is block interleaved or bit interleaved. Systems that use block interleaving result in reduced buffering requirements if the storage system can ensure data delivery for each session request within a sub-interval. In other words, when the session switches between disks, data must be retrieved from the second disk before the data from the first disk are consumed. The availability of such bounds on scheduling allows the array to perform efficiently with the same buffer sizes as a single disk requires. However, if data are bit interleaved and must be retrieved in parallel from all the disks, the buffering requirements increase by a factor equal to the number of disks in the array. One fallout of data striping is the resulting increases in the scheduling intervals to achieve high disk utilization. To take advantage of available disk bandwidth, sessions must be scheduled further apart in time, resulting in a net increase in the buffering costs. In other words, achieving high disk utilization comes at a cost of increased buffering requirements. We now consider a cost model based on the aforementioned discussion that helps us evaluate 7
the tradeoffs in storage cost that affect the performance of the storage system.
3
A System Cost-Performance Model
Let Cr be the cost for buffer memory and Cd the cost of disk storage. We approximate the disk storage costs to increase linearly with storage capacity. As described earlier, the buffer size per session is twice the block size, one for reading data from disk and the other to output data to the network. The cost of buffering per user connection is therefore given by 2BCr and the cost of disk storage is given by DdCd where d is the disk capacity. The storage cost per user session is then given by
Cu = 2BCr +
DdCd . N
(4)
For disks with identical I/O performance the behavior of Cu is primarily affected by the choice of d. In this model, we neglect the disk connectivity cost assuming that is is incorporated within Cd . It is also clear that Cu can be biased by the choice of D, Cr , and Cd . A more interesting cost measure is the price per unit bandwidth CB = Cu /R. From Eq. 4, we can derive CB as
CB =
2BCr DdCd + . R NR
(5)
The objective of our design is to minimize CB subject to the condition that B (and hence Tc ) is below a given value. Eq. 5 can be rewritten by replacing N with Eq. 1. In this case, CB is dependent on B only. However, N must always be an integer which complicates the optimization problem. Furthermore, it is not clear whether the solution space is bounded. Instead, we use a brute-force approach and examine the entire solution space to choose the best operating point. For a block interleaved disk array, the cost function can be used exactly as shown, without any penalty. However, for a bit interleaved system, the cost function must be rewritten as
CB =
2BDCr DdCd + R NR
(6)
to account for the fact that the buffer size must be atleast twice the amount of data retrieved 8
in one scheduling interval. From these models, it appears that the buffering costs dominate the behavior of the cost function. However, this is not true for all bandwidths. When the optimal point from a cost-performance perspective is evaluated, the buffer costs are not as dominant as expected.
4
Results
To understand the implications of the proposed cost model, we evaluated the performance of several disk organizations assuming a Cr of $33/MB and a Cd of $0.25/MB. The cost model was evaluated for a wide range of session bandwidth requirements and disk scheduling intervals using the disk parameters described earlier. The results presented herein are for 4 GB drives and configurations of 1, 4, and 8 disks. The maximum number of users that can be supported (estimated using b RRd c) at a given session bandwidth and the corresponding CB are illustrated in Fig. 4. The figures show the disadvantages of a scheme that tries to utilize the disk bandwidth by increasing Tc . For sessions in which Rd /R is close to integer values, the buffer costs dominate. As a result, the overheads in trying to maximize the disk utilization result in a significant increase in user costs. 9
10
1 Disk 8 Disks
8
10
7
Cost Per Unit Bandwidth ($)
10
6
10
5
10
4
10
3
10
2
10
1
10 3 10
4
10
5
6
10 10 Session Bandwidth (b/s)
7
10
Figure 4: Cost to Support Maximum N
9
8
10
The cost per unit bandwidth as a function of session rate and scheduling interval is illustrated in Fig. 5. The cost function exhibits a nonlinear, non-monotonic behavior. It is typically high for low values of R and Tc , drops and begins to rise for high values of Tc .
−4
x 10 1.4
Cost Per unit BW (b/s)
1.2 1 0.8 0.6 0.4 0.2 0 3 2
2
1.5
7
x 10
1
1 0.5 Session Rate
0
0
Cycle Time
Figure 5: CB versus R and Tc Fig. 6 illustrates the behavior of the cost curve for session bandwidths of 2, 7.75, and 17.75 Mb/s. The cost function is convex for low bandwidth streams and nearly linear for the high bandwidth streams in the range evaluated. Thus, it is possible to tradeoff latency with utilization to find an operating point that minimizes CB . The minimum cost per unit bandwidth for each session bandwidth as determined by the cost function is illustrated in Fig. 7. The corresponding scheduling intervals, disk utilization, and the resulting concurrent sessions that can be supported are illustrated in Figs. 8, 9, and 10 respectively. The figures demonstrate that disk based server architectures are most often better for serving high bandwidth sessions. This is because at high bandwidths fewer streams can be served, which lowers the frequency of disk seeks. As a result, overheads are reduced and sessions can be supported for low values of Tc , thereby reducing the buffering requirements. Another observation is that available disk bandwidths are poorly utilized at low bandwidths. Moreover, the scheduling intervals are extremely high even at the operating points for which the operational cost is a minimum. This leads us to an interesting observation that under high loads, the storage system is able to respond much more quickly to user interactions 10
-5
x 10
7
2.0 Mb/s 7.75 Mb/s
6
17.75 Mb/s
Cost per unit BW
5
4
3
2
1
0 0
0.2
0.4
0.6
0.8 1 Cycle Time
1.2
1.4
1.6
1.8
Figure 6: CB versus Tc
3
10
1 Disk 4 Disks
Cost Per Mb/s ($)
8 Disks
2
10
1
10 3 10
4
10
5
6
10 10 Session Bandwidth (b/s)
7
10
Figure 7: Minimum Cost versus Bandwidth
11
8
10
when serving high bandwidth sessions. 2
10
1 Disk 4 Disks 8 Disks 1
Scheduling Interval
10
0
10
-1
10
-2
10
3
10
4
10
5
6
10 10 Session Bandwidth (b/s)
7
10
8
10
Figure 8: Latency for Minimum Cost
The results of our analysis and cost models illustrate the pitfalls of assuming that storage performance characteristics scale linearly with session bandwidth and latency requirements. Buffering costs are small for low bandwidth streams, however they increase with reduced latency requirements. High bandwidth streams can be served at low latencies without significantly changing the buffering and cost parameters. The fraction of system cost due to buffering for the minimum cost operating point is illustrated in Fig. 11. The buffering costs are dominant for high bandwidth sessions. Due to the high latency and poor disk utilization at low bit rates, the system requires a very small buffer to schedule sessions at low bandwidths. Another conclusion that we draw from the aforementioned discussion is that achieving a fast, high throughput system is impossible at low bandwidths. To determine the tradeoffs, we bounded our system to a maximum scheduling interval of 5 seconds and recomputed the minimum cost values. For this scheduling constraint, the corresponding values are illustrated in Figs. 12 – 15. The minimum cost function for this constrained operation is illustrated in Fig. 12. The cost curve demonstrates that it is possible to chose a disk architecture to minimize operational 12
1 1 Disk 4 Disks 8 Disks
Disk Utilization
0.8
0.6
0.4
0.2
0 3 10
4
10
5
6
10 10 Session Bandwidth (b/s)
7
8
10
10
Figure 9: Disk Utilization for Minimum Cost
4
10
1 Disk 4 Disks 8 Disks
Number of Sessions
3
10
2
10
1
10 3 10
4
10
5
6
10 10 Session Bandwidth (b/s)
Figure 10: N for Minimum Cost
13
7
10
8
10
0
10
Fraction of Total Cost due to Buffering
1 Disk 4 Disks 8 Disks
-5
10
3
4
10
10
5
6
10 10 Session Bandwidth (b/s)
7
10
8
10
Figure 11: Fraction of Cost from Buffering
cost by trading utilization with latency. For low bandwidth streams, the single disk scheme best meets the scheduling, utilization, and cost constraints. However, there is a crossover point at which striping is more efficient. Fig. 13 shows that a crossover point also exists for determining the best scheduling interval. Similar observations can be made for the behavior of the utilization function (Fig. 14) and the number of sessions that can be supported (Fig. 15). It is apparent that based on an operating cost it is possible to specify scheduling intervals and disk layout policies that can best utilize available resources and satisfy the requirements of a maximum number of users. This knowledge can be used to develop a scalable disk scheduling policy where the user may benefit from a better quality of service at lower costs. The effects of changing the disk cost in our analysis are illustrated in Fig. 16 where we show the number of sessions that can be accommodated at the minimum cost for disk sizes of 1, 2, 4, 9, and 18GB. The general behavior of the minimum cost function is not significantly affected by disk costs. This is because buffering costs do not dominate the behavior of the cost function as much as expected. Therefore, the observations in this paper are scalable to a general disk architecture.
14
4
10
Minimum Cost per Mbps
1 Disk 4 Disks 8 Disks
1. Striping is cheaper at high bandwidths 2. Tradeoff striping with replication
3
10
2
10
1
10 3 10
4
5
10
6
10 10 Session Bandwidth (b/s)
7
10
8
10
Figure 12: Minimum Cost for Tc < 5s
1
10
0
Scheduling Interval
10
striping provides acceptable latency at high bandwidths -1
10
1 Disk 4 Disks 8 Disks -2
10
3
10
4
10
5
6
10
10
7
10
Session Bandwidth (b/s)
Figure 13: Minimum Latency for Tc < 5s
15
8
10
1 1 Disk 4 Disks 8 Disks
Disk Utilization
0.8
0.6
0.4
0.2
0 3 10
4
10
5
6
10
10
7
8
10
10
Session Bandwidth (b/s)
Figure 14: Disk Utilization for Tc < 5s
4
10
Number of Sessions
1 Disk 4 Disks 8 Disks
3
10
2
10
1
10 3 10
4
10
5
6
10 10 Session Bandwidth (b/s)
Figure 15: N for Tc < 5s
16
7
10
8
10
5
Conclusion and Future Work
In this paper we have developed a model to evaluate the cost-performance characteristics of disk based storage systems for serving continuous media data. We applied the model to existing disk and RAM storage characteristics to evaluate the performance of a disk system for a number of bandwidth and scheduling intervals. The results demonstrate that the choice of session bandwidth and cycle time impact the cost per unit bandwidth.
5
10
4
Number of Sessions
10
x 18 disk x 9 disk x 4 disk x 2 disk x 1 disk
3
10
2
10
1
10 3 10
4
10
5
6
10 10 Session Bandwidth (b/s)
7
10
8
10
Figure 16: Effects of Disk Cost on N
Our analysis encompasses the effects of varying the disk capacity and the tradeoffs due to varying disk parameters. We also address the scale-up of this approach to parallel disk architectures and the effects of the trends in storage architectures on the cost-performance model. Such a scheme is useful to identify an operating region for a disk serving video to multiple user sessions at a specific cost. Our results demonstrate that achieving high disk utilization with low bandwidth streams is possible when data is streamed from a single disk instead of disk arrays. This suggests that there is a need to choose a system architecture with care, as a disk based replication scheme might perform better in comparison to striping. It may be possible to design a memory hierarchy in which low bandwidth objects are treated as simple files. We can subsequently apply traditional memory management principles to support their delivery. High bandwidth 17
sessions can be served from a disk array. Such an architecture would combine the benefits of traditional file systems and satisfy the requirements of continuous media. We propose to investigate such an architecture in future work. In future work, we will present techniques to apply these observations to design general purpose storage systems. We also plan to address the implications of disk interface hardware (e.g., SCSI and Fiber Channel) on the cost and performance of the system.
Acknowledgments This work is supported in part by EMC Corporation and the National Science Foundation under Grant No. IRI-9502702.
References [1] D. P. Anderson and G. Homsy, “A continuous media I/O server and its synchronization mechanism,” Computer, October 1991, Vol. 24, No. 10, pp. 51–57. [2] Y. Birk, “Track-pairing:
a novel data layout for VOD servers with multi-zone-
recording disks,” Proc. 2nd. IEEE Intl. Conf. on Multimedia Communication Systems (ICMCS’95), Washington D.C., May 1995, pp. 248–255. [3] E. Chang and A. Zakhor, “Cost analyses for VBR video servers,” Proc. IS&T/SPIE Intl. Symposium on Electronic Imaging: Science and Technology, San Jose, California, January 29-31 1996, Vol. 2667. [4] H.-J. Chen and T.D.C. Little, “Storage allocation policies for time-dependent multimedia data,” to appear in IEEE Trans. on Knowledge and Data Engineering, 1996. [5] P.M. Chen, E.K. Lee, G.A. Gibson, R.H. Katz, and D.A. Patterson, “RAID: HighPerformance, Reliable Secondary Storage,” Technical Report TR-CS-93-778, University of California, Berkeley, 1993. [6] A.L. Chervenak, D.A. Patterson, and R.H. Katz, “Choosing the best storage system for video service,” Proc. 3rd ACM Intl. Conf. on Multimedia (ACM Multimedia’95), San Francisco CA, November 1995, pp. 109-119.
18
[7] D.J. Gemmell, J. Han, R.J. Beaton, and S. Christodoulakis, “Delay-sensitive multimedia on disks,” IEEE Multimedia, Vol. 1, No. 3, Fall 1994, pp. 56–67. [8] T.D.C. Little and D. Venkatesh, “Popularity-based assignment of movies to storage devices in a video-on-demand system,” Multimedia Systems, Vol. 2, No. 4, Jan 1995, pp. 280–287. [9] B. Ozden, R. Rastogi, and A. Silberschatz, “On the design of a low-cost video-ondemand storage system,” Multimedia Systems, Vol. 4, February 1996, pp. 40-54. [10] P. V. Rangan, H. M. Vin, and S. Ramanathan, “Designing an on-demand multimedia service,” IEEE Communications Magazine, July 1992, Vol. 30, No. 7, pp. 56–64. [11] C. Ruemmler and J. Wilkes, “An introduction to disk drive modeling,” Computer, March 1994, pp. 17–28. [12] Seagate Corp., “Product specification for the ST410800N/ND Elite 5.25 disk drive, 10.8 GB, SCSI interface,” Document Number 64403801, September 1994. [13] R. Steinmetz, “Multimedia file systems survey: Approaches for continuous media disk scheduling,” Computer Communications, March 1995, Vol. 18, No. 3, pp. 133–144. [14] S. Stoller and J. DeTreville, “Storage replication and layout in video-on-demand servers,” Lecture Notes in Computer Science, Vol. 1018, (Proc. of the 5th International Workshop on Network and Operating System Support for Digital Audio and Video), T.D.C. Little, R. Gusella, Eds., Springer-Verlag, November 1995, pp. 330-341.
19