4 Formalizing A Correspondence Rule for Automotive Architecture Views 55 ...... had a Master of Science (MSc) degree in mechanical or electrical engineering ...
On the Design of an Architecture Framework and Quality Evaluation for Automotive Software Systems
PROEFSCHRIFT
ter verkrijging van de graad van doctor aan de Technische Universiteit Eindhoven, op gezag van de rector magnificus, prof.dr.ir. F.P.T. Baaijens, voor een commissie aangewezen door het College voor Promoties, in het openbaar te verdedigen op dinsdag 26 mei 2015 om 14.00 uur door Yanjindulam Dajsuren geboren te Taishir soum, Mongoli¨e
Dit proefschrift is goedgekeurd door de promotoren en de samenstelling van de promotiecommissie is als volgt: voorzitter: promotor: copromotor: leden:
prof.dr. E.H.L. Aarts prof.dr. M.G.J. van den Brand dr. A. Serebrenik dr.ir. R.J. Bril prof.dr.ir. M. Steinbuch prof.dr.dr.h.c. M. Broy (Technische Universit¨at M¨ unchen, Germany) prof.dr. R.H. Reussner (Karlsruhe Institute of Technology, Germany) prof.dr. M.R.V. Chaudron (Chalmers and Gothenburg University, Sweden)
On the Design of an Architecture Framework and Quality Evaluation for Automotive Software Systems
Yanja Dajsuren
Promotor:
Prof. Dr. M.G.J. van den Brand (Eindhoven University of Technology)
Copromotor: Dr. A. Serebrenik (Eindhoven University of Technology) Additional members of the reading committee: Dr. ir. R.J. Bril Prof. Dr. ir. M. Steinbuch Prof. Dr. Dr. h.c. M. Broy Prof. Dr. R.H. Reussner Prof. Dr. M.R.V. Chaudron
(Eindhoven University of Technology) (Eindhoven University of Technology) (Technische Universit¨at M¨ unchen, Germany) (Karlsruhe Institute of Technology, Germany) (Chalmers and Gothenburg University, Sweden)
The work in this thesis has been carried out under the auspices of the research school IPA (Institute for Programming research and Algorithmics). IPA dissertation series 2015-12.
The work in this thesis has been carried out as part of the Hybrid Innovations for Trucks (HIT) project with DAF Trucks NV as the industrial partner. The HIT project (HTASI10002) is supported by the Netherlands Ministry of Economic Affairs under the High Tech Automotive Systems (HTAS) programme.
A catalogue record is available from the Eindhoven University of Technology Library ISBN: 978-90-386-3831-7
Cover design: Telmen Dzjind, Delft, the Netherlands. Printed by: Print service, Eindhoven University of Technology.
c
Y. Dajsuren, 2015.
All rights reserved. No part of this publication may be reproduced, stored in a retrieval system, or transmitted, in any form or by any means, electronically, mechanically, photocopying, recording or otherwise, without prior permission of the author.
Acknowledgments
Pursuing my PhD studies has been a great journey. I would like to express my gratitude to the following people, each of whom has contributed in a valuable way to the completion of this thesis. Firstly, I would like to express my sincere gratitude to my promotor Mark van den Brand for offering me an opportunity to do a PhD in his Software Engineering and Technology (SET) group and believing in me. His honest, a priori advice that “You would be the first PhD student in the area of automotive software engineering at TU/e and it may not be that easy” prepared me to take on the challenges that lay ahead. I am forever grateful for his guidance and support over the years. I would also like to convey my sincere gratitude to my co-promotor Alexander Serebrenik, who spent every week, together with Mark, discussing my research and collaborating on papers. I learned so much from his devotion and commitment to the success of his students. I am very grateful for his continuous support during my PhD years. I would like to use this opportunity to thank the HTAS programme for funding this research. I would also like to thank everybody at DAF Trucks N.V., whom I had the pleasure of working with, for their cooperation and assistance. In particular, I would like to thank Rudolf Huisman for being my company supervisor and supporting me in all areas including finding contacts, collaborating on papers, technical reports, evaluating my research results and providing me with fruitful feedback. I want to thank Loek van Seeters for welcoming me to his department and for always being full of enthusiasm and support, Coco Jongerius for making me feel part of his group Vehicle Control, Guus Arts for being a driven and kind project leader. Also, Michiel Pesgens, Rene Vugts, Christiaan Kruiskamp, Rutger-Jan Kolvoort, Giel van de Wijdeven, John Kessels, Frank Soeterboek and Rob Janssen for their precious time and collaboration on my research. Thanks also goes to Vital van Reeven, Emilia Silvas, and Thinh Pham, the HIT PhD students with whom I had many interesting discussions, exchange of ideas, and peer support. During my PhD research I had the privilege of collaborating and coauthoring papers with a number of people. The collaboration with them contributed greatly to my research and this thesis eventually. Besides Mark and Alexander, I would also like to thank Serguei Roubtsov, Christine Gerpheide, Hamid Abdul Basit, Marta Olszewska (Plaska), Anton , Wijs, Marina Wald´en, Rudolf Huisman, and Bogdan Vasilescu. Thanks also goes to Marina and Marta for welcoming me to their group at the ˚ Abo Akademi University in
ii Finland. It was a fruitful collaboration in a short period of time. I also would like to thank Ralf Reussner for inviting me to give a talk at his group, Karlsruhe Institute of Technology (KIT). Following my visit, I started a stimulating collaboration with the PhD researchers from Ralf’s group with Max Kramer, Erik Burger, and Michael Langhammer. Thank you to Max, Erik, and Michael again for their shared research interests and collaboration. I have also had fruitful collaborations with Harald Altinger from Audi AG and Eric Bouwers from SIG B.V. I thank them for their great team work. Besides doing research, I had a privilege to (guest) lecture and tutor Bachelor and Master students at the TU/e. I would like to convey my gratitude to Wil Post, Johan Paulides, Ion Barosan, Sjoerd Cranen, and Ramon Schiffelers for (co-) supervising and tutoring very interesting projects and to my students from “Cars in Context” projects for their enthusiasm. Thank you Christine Gerpheide, Alexandru Dinu, Frank Razenberg, and Samir Hadji for carrying out their internship/graduate projects with me. I would also like to express my deep gratitude to the members of my reading committee for reviewing this thesis and their valuable comments: Manfred Broy from Technische Universit¨ at M¨ unchen, Ralf Reussner from Karlsruhe Institute of Technology, Michel Chaudron from Chalmers and Gothenburg University, Maarten Steinbuch and Reinder Bril from Eindhoven University of Technology. I immensely enjoyed the time spent with my colleagues from TU/e. I would like to thank my former office mates Luc Engelen, Marcel van Amstel, Zvezdan Proti´c, and Arjan van der Meer and current office mates Ulyana Tikhonova, Ana-Maria S ¸ utˆıi, Dan Zhang, Neda Noroozi for creating a very pleasant working environment. Thank you to all the other past and current colleagues, especially (in no particular order) Bogdan Vasilescu, Luna Luo, Maarten Manders, Maciej Gazda, Sarmen Keshishzadeh, Sander de Putter, ¨ Raquel Alvarez Ramirez, Jaewon Oh, Harold Weffers, Maggy de Wert, Onder Babur, Sacha Claessens, Margje Mommers-Lenders, Tineke van den Bosch, and Dragan Bosnacki. The cover of this thesis was designed by Telmen Dzjind and it is an abstract representation of my work. Thank you very much Telmen for his time and effort. I want to thank my paranymphs and dear friends, Nadia Grossiord and Raluca Frunza, and all the other friends who are not explicitly mentioned here. My deep thanks go to my family, especially my brothers Lkhagvadorj, Budkhuu, Baasandorj, my beloved niece Lkhamsuren, and my family-in-law for their unconditional love and continuous support through the years. Finally, I would like to thank my dear husband R˘ azvan for his love and patience. You have brought another dimension of happiness and a beautiful meaning in my life. Mul¸tumesc, dragostea mea! Te iubesc. Yanja Dajsuren Eindhoven, March 2015
Table of Contents
Acknowledgments
i
Table of Contents
iii
List of Acronyms
v
1 Introduction 1.1 Background . . . . . . 1.2 Project Objectives . . 1.3 Research Questions . . 1.4 Research Methodology 1.5 Thesis Outline . . . .
. . . . .
. . . . .
. . . . .
. . . . .
. . . . .
. . . . .
. . . . .
. . . . .
. . . . .
. . . . .
. . . . .
. . . . .
. . . . .
1 1 4 4 5 6
2 Architecture Framework for Automotive Systems 2.1 Introduction . . . . . . . . . . . . . . . . . . . . . . . 2.2 Automotive AFs and Viewpoints . . . . . . . . . . . 2.3 Automotive ADLs and Viewpoints . . . . . . . . . . 2.4 Architecture Framework For Automotive Systems . . 2.5 Conclusion . . . . . . . . . . . . . . . . . . . . . . .
. . . . .
. . . . .
. . . . .
. . . . .
. . . . .
. . . . .
. . . . .
. . . . .
. . . . .
. . . . .
. . . . .
. . . . .
9 9 11 17 26 30
3 Automotive Architecture Modeling 3.1 Introduction . . . . . . . . . . . . . . . . 3.2 Architecture modeling requirements . . 3.3 Evaluation of Automotive ADLs . . . . 3.4 Modeling Automotive Systems in SysML 3.5 Conclusion . . . . . . . . . . . . . . . .
. . . . .
. . . . .
. . . . .
. . . . .
. . . . .
. . . . .
. . . . .
. . . . .
. . . . .
. . . . .
. . . . .
. . . . .
31 31 32 34 38 52
. . . . .
. . . . .
. . . . .
. . . . .
. . . . .
. . . . .
. . . . .
. . . . .
. . . . .
. . . . .
. . . . .
. . . . .
. . . . .
. . . . .
. . . . .
. . . . .
. . . . .
. . . . .
. . . . .
. . . . .
. . . . .
. . . . .
. . . . .
4 Formalizing A Correspondence Rule for Automotive Architecture Views 4.1 Introduction . . . . . . . . . . . . . . . . . . . . . . . . . . . . . . . . . . . 4.2 Architectural Notations . . . . . . . . . . . . . . . . . . . . . . . . . . . . 4.3 Architecture Correspondence . . . . . . . . . . . . . . . . . . . . . . . . . 4.4 Tool Development . . . . . . . . . . . . . . . . . . . . . . . . . . . . . . .
55 55 59 61 67
iv
Table of Contents 4.5 4.6 4.7
Evaluation . . . . . . . . . . . . . . . . . . . . . . . . . . . . . . . . . . . . Related Work . . . . . . . . . . . . . . . . . . . . . . . . . . . . . . . . . . Conclusion and Future Work . . . . . . . . . . . . . . . . . . . . . . . . .
71 73 74
5 Modularity Analysis of Automotive Control Software 5.1 Introduction . . . . . . . . . . . . . . . . . . . . . . . . . 5.2 Related work . . . . . . . . . . . . . . . . . . . . . . . . 5.3 Modularity Metrics in Simulink . . . . . . . . . . . . . . 5.4 Metrics tool and evaluation . . . . . . . . . . . . . . . . 5.5 Visualization tool . . . . . . . . . . . . . . . . . . . . . . 5.6 Conclusion and future work . . . . . . . . . . . . . . . .
. . . . . .
. . . . . .
. . . . . .
. . . . . .
. . . . . .
. . . . . .
. . . . . .
. . . . . .
. . . . . .
. . . . . .
75 75 80 81 89 94 97
6 Complexity Metrics Suite for Simulink Models 6.1 Introduction . . . . . . . . . . . . . . . . . . . . . 6.2 Background . . . . . . . . . . . . . . . . . . . . . 6.3 Motivation . . . . . . . . . . . . . . . . . . . . . 6.4 Simulink Complexity Metrics Suite . . . . . . . . 6.5 Evaluation . . . . . . . . . . . . . . . . . . . . . . 6.6 Discussion and Threats to Validity . . . . . . . . 6.7 Related Work . . . . . . . . . . . . . . . . . . . . 6.8 Conclusions and Future Work . . . . . . . . . . .
. . . . . . . .
. . . . . . . .
. . . . . . . .
. . . . . . . .
. . . . . . . .
. . . . . . . .
. . . . . . . .
. . . . . . . .
. . . . . . . .
. . . . . . . .
. . . . . . . .
. . . . . . . .
. . . . . . . .
. . . . . . . .
99 99 100 102 102 107 110 110 111
7 Managing Clone Mutations in Simulink Models 7.1 Introduction . . . . . . . . . . . . . . . . . . . . . 7.2 Background . . . . . . . . . . . . . . . . . . . . . 7.3 Approach . . . . . . . . . . . . . . . . . . . . . . 7.4 Validation . . . . . . . . . . . . . . . . . . . . . . 7.5 Related work . . . . . . . . . . . . . . . . . . . . 7.6 Conclusion and Future Work . . . . . . . . . . .
. . . . . .
. . . . . .
. . . . . .
. . . . . .
. . . . . .
. . . . . .
. . . . . .
. . . . . .
. . . . . .
. . . . . .
. . . . . .
. . . . . .
. . . . . .
. . . . . .
113 113 115 118 120 122 123
8 Conclusions 125 8.1 Contributions . . . . . . . . . . . . . . . . . . . . . . . . . . . . . . . . . . 125 8.2 Directions for Further Research . . . . . . . . . . . . . . . . . . . . . . . . 128 Bibliography
131
Summary
149
Curriculum Vitae
151
List of Acronyms
ADL AF AFAS AUTOSAR
Architecture Description Language Architecture Framework Architecture Framework for Automotive Systems AUTomotive Open System ARchitecture
ECU E/E
Electronic Control Unit Electrical/Electronic
FN
Functional Model
GQM
Goal Question Metric
HMI
Human Machine Interface
LOC
Lines Of Code
OEM
Original Equipment Manufacturer
SQuaRE SW
Software product Quality Requirements and Evaluation Software Model
VCL
Variant Configuration Language
Chapter
1
Introduction
1.1
Background
Automotive software engineering applies software engineering approaches to the development of automotive software and electronics systems [37, 166, 185, 208]. This has attracted the attention of automotive software researchers and practitioners worldwide [38]. It is now more than a decade, since the term “automotive software engineering” was officially introduced in the software community and the challenging research and technical issues were highlighted [37]. Among the technical issues was the complexity issue, which called for solutions to manage the increasing size and dependency of software systems. Software architecture was almost non-existent at the time, which meant that a solution other than structuring the system mainly by hardware architecture was needed. The quality of automotive software also required more attention [37]. Automotive systems are traditionally developed by mechanical engineering methods. However, increasing use of electronics and software systems in automobiles require interaction between a variety of engineering disciplines including mechanical, electrical, and software engineering [208]. Therefore, a viable solution is needed to manage this multidisciplinary engineering information in an effective way and manage its ever-increasing complexity [208]. An example of such a solution is an Architecture Description Language (ADL) [38, 166, 208] and an architecture framework [40, 92]. An ADL is used to describe and represent system and software architectures. An architecture framework provides conventions, principles and practices to describe architectures within a specific domain and/or community of stakeholders [116]. Thus, an architecture framework is usually implemented in terms of one or more viewpoints or ADLs. Automotive ADLs represent the entire vehicle architecture. This contrasts with AUTomotive Open System ARchitecture (AUTOSAR), which provides a common software infrastructure based on standardized interfaces for the different layers on an Electronic Control Unit (ECU) [206]. AUTOSAR is developed as an open and standardized automotive software architecture by automobile manufacturers (Original Equipment Manufacturers, or OEMs), suppliers, and tool developers [5]. Since 2008, when the first cars with AUTOSAR
2
Introduction
technology were launched, all major OEMs and ECU suppliers have AUTOSAR on their roadmap [8]. For example, BMW and Volvo have claimed to use AUTOSAR 4.0 [177]. However, some criticisms of AUTOSAR may be relevant for the definition of automotive ADLs. These include the lack of initial support for the timing issue (only introduced later in AUTOSAR version 4.0), unnecessary or redundant functions and elements lobbied into the standard by many OEMs participants as well as tier-one suppliers [97]. In addition to these issues, we identified that the automotive architecture description mechanisms lacks the capability to ensure architectural quality [60]. Ensuring automotive software quality is now fundamental to the automotive industry [28]. Due to software glitches and electronics defects, OEMs not only spend millions on warranty and recall costs, but these glitches can even endanger lives [11, 141]. It has even been claimed that 50% of recalls are attributed to software glitches and electronics defects [1]. In 2014, for the first time in the history of automotive system development, Honda Motor Co. recognized that a software glitch in ECUs caused cars behave unexpectedly by accelerating suddenly [244]. While there are a number of cases in which electronic defects have caused car accidents (even deaths), the underlying problems could continue without being acknowledged by the OEMs. For example, in 2004, Toyota Motor Corp. reached a confidential settlement with the victims of serious accidents in the US to avoid punitive damages [244]. This highlights that although automotive software systems enable technological innovation, it brings increased vulnerability to “hard failures” resulting from software glitches [222], which are the result of increased software complexity [182]. It is impractical to test everything at the vehicle level due to the vast number of control parameters, operating conditions, and timing sequences of events [166]. Therefore, besides using software testing to ensure quality and avoid the risk of costly recalls and delays in automotive software development, OEMs and suppliers use quality assurance methods such as coding standards and static analysis tools [28]. These included MISRA (Motor Industry Software Reliability Association) C coding standard [2] and ISO 26262 functional safety standard [114] to ensure safe automotive software. The amount of software associated with each new generation of cars is growing by a factor of ten or more [38]. In 2009, there were 10 million lines of code (LOC) in premium cars [38] and this was expected to reach 100 million LOC in 2015 [161]. In fact, today it has already reached 100 million LOC in premium cars [194]. Added to this, there is no sign of a slowing down of the amount and complexity of software in automotive systems. In fact, innovation in the global automotive industry has been intensifying, taking over consumer companies in the top 50 most innovative companies. In addition to this more OEMs than technology companies appear in the top 20 [226]. Since 90% of the innovation in the automotive industry is driven by electronics and software [37, 217], ensuring software quality has become a necessity. Although there are a plethora of source code quality analysis tools available, methods for assessing the quality of automotive software models are still limited. In addition, quality assurance techniques at code level would require more time and effort to ensure quality. Therefore, automotive quality assurance issues require additional solutions earlier in the software development cycle i.e., at the architectural and design phase for all the automotive functional domains. Automotive embedded systems are categorized into vehicle-centric functional domains (including powertrain control, chassis control, and active/passive safety systems) and passenger-centric functional domains (covering multimedia/telematics, body/comfort, and Human Machine Interface (HMI)) [166]. From these domains, powertrain, connectivity, active safety and assisted driving are considered major areas of potential innovation and may define OEMs’ success in the years ahead [226]. Ever increasing software to
1.1. Background
3 $16,000
85% % of Bugs
% Defects introduced in this phase % Defects found in this phase
$1000
$25 Coding
$100 Unit Test
Cost to repair defect in this phase
$250 Function Test
System Test
After Release
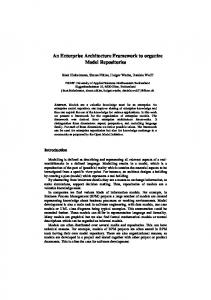
Figure 1.1: Defect detection vs. cost of repair [44] enable innovation in vehicle-centric functional domains requires even more attention to assessment and improvement of the quality of embedded automotive software. This is because software-driven innovation can come with software defects, failures, and vulnerability for hackers’ attacks [122]. Furthermore, as illustrated in Figure 1.1 it can be very costly to fix software defects in the field [44]. Moreover, automotive companies face strict fuel consumption demands from the market and emission limits from legislation. Particularly, CO2 emission reduction is considered the biggest challenge for the automotive industry in the years ahead [78]. This requirement necessitates major innovations, particularly in powertrain efficiency. The powertrain of an automotive vehicle is a set of components (e.g., the engine, transmission, drive shafts, differentials, and the drive wheels) that generates power and delivers it to the road surface. Increasing efficiency of the powertrain calls for the development of new and more efficient energy managers and software components to determine the optimal use of the available power resources [233]. The fact that energy management and functionality, which are so crucial for modern vehicles, is delegated to software is yet another imminent dependence on software in the automotive world. Indeed, since the introduction of software in vehicles thirty years ago, the amount of software has grown exponentially and nowadays is responsible for 50-70% of the total development costs of the electronics and software systems in vehicles [38]. Furthermore, given that the lifetime of a vehicle is more than two or three decades [38], having maintainable software is hugely important as this will be needed to add any new functionality or repair defects. This thesis is the result of research that is a part of the Hybrid Innovations for Trucks (HIT) project. The HIT project is carried out in a consortium of an OEM, suppliers, and research institutes with the project duration from September 1, 2010 to June 30, 2014. The HIT is financed by the Dutch High-Tech Automotive Systems (HTAS) automotive innovation programme of the Ministry of Economic Affairs, Agriculture and Innovation, the Netherlands. The ultimate goal of the project is the reduction of CO2 emissions and fuel saving for long-haul trucks. To enable the innovation in hybrid vehicles, more complex control software will be developed e.g., for engine, after-treatment, battery management and energy management systems. Therefore, in the scope of the software research work package of the HIT project, it was required to define “proper” architecture modeling and software quality techniques. In the remainder of this introduction the project objectives and research questions addressed in this thesis together with research methodology will be discussed, and it will conclude with an outline of this thesis.
4
1.2
Introduction
Project Objectives
In the scope of the software research work package of the HIT project, a definition of “proper” architecture modeling and software quality techniques was required. One of the main software research related challenges is that the industrial partners use proprietary ADLs with limited tool support. Multiple success stories of architecture modeling approaches in the automotive industry are reported in the literature [32, 137, 187, 215]. Many automotive companies recognize ADLs as a viable solution in order to reduce development costs and increase the quality of increasingly complex software [166]. However, the proprietary ADLs have a number of serious shortcomings identifying the main requirements for automotive architecture modeling. For example, they did not support traceability requirements, did not provide a means of multi-level modeling and modeling hierarchical elements. They also did not support the evolution of models or provide a means for determining their architectural quality. In addition, the tool support was limited. Therefore, the first project objective has been stated as follows: 1. Identify an existing or design a new automotive architecture description mechanism, supporting the main requirements for automotive architecture modeling. Another objective is dedicated to the study of the quality of automotive architectural models. Because of the increasing size and complexity of software systems a new technique, besides software testing, is needed to evaluate quality. 2. Identify quality attributes relevant for automotive architectural models, and propose a means of evaluating these quality attributes. This thesis presents the results obtained in achieving these objectives.
1.3
Research Questions
We formulated the following research questions to achieve the project objectives described in the Section 1.2. To complete the first research objective, we evaluated the existing architecture description mechanisms namely automotive ADLs and Architecture Frameworks (AFs). Since early 2000, a number of automotive ADLs have been defined for the automotive software and electronics systems e.g., BMW in the definition of AML [32, 189], Volvo, Fiat, and VW/Carmeq in the EAST-ADL [50] and TADL [228]. Besides the automotive ADLs, general-purpose (domain-agnostic) modeling languages as SysML [176] and MARTE [169] have also attracted considerable attention from automotive companies [16, 20, 187]. Although the foundation for the automotive AF was established within the scope of the Automotive Architecture Framework (AAF) in 2009 [40], it only in 2013 automotive companies started to take initiative in defining an architecture framework for automotive systems i.e., Architecture Design Framework (ADF) by Renault [92]. We have observed that the architecture description elements (i.e., stakeholders, concerns, architecture viewpoints, architecture views, and model kinds) of automotive AFs and automotive ADLs are not in alignment. According to the ISO 42010 standard [116], an architecture view consists of one or more architecture models and relations between them to support certain concerns of a stakeholder. An architecture viewpoint represents conventions for constructing and using an architecture view [116]. We elicited the automotive architecture modeling requirements to evaluate existing automotive ADLs and carried out a case study to define the usability of the selected ADL to model an automotive system. This led to the following research question addressing both automotive AFs and ADLs:
1.4. Research Methodology
5
RQ1 : What architecture description mechanisms can be employed to support automotive architectural modeling at different architecture viewpoints? During the literature review, while in the process of defining an Architecture Framework for Automotive Systems (AFAS), we also identified that the correspondence rules between architecture views are not formally defined in the scope of the automotive architecture frameworks. This represents a major gap in the literature on automotive architecture description mechanisms. Therefore, in search of a practical solution to this problem, we defined the following research question: RQ2 : How can we formalize the correspondence rules between automotive architecture viewpoints? In addition to architectural consistency checking, we identified that the automotive ADLs lack the capability of to ensure the architectural quality during the evaluation of automotive ADLs. Although not an explicit requirement of automotive ADLs, the support of the architectural quality is clearly advantageous to the quality of the architectural modeling. This is due to the fact that ensuring internal quality of the system (measured by looking inside the product, e.g., by analyzing the static model or source code [159]) influences the external quality (measured by execution of the product, e.g., by performing testing [159]). This led to the research question RQ3 on the quality of automotive architectural models. We consider automotive architectural models as software models in the early stages of the software development cycle. According to the IEEE standard 1061 [218], software quality is defined as the degree to which software possesses a desired combination of quality characteristics. Variety of software quality models defines software characteristics in different formats e.g., McCall’s software quality model [155] is known as the General Electrics model while Boehm’s quality model [27] defined high-level quality characteristics. In addition, ISO 25010 international standard [115] refined the ISO 9126 quality model [113] which is based on McCall and Boehm’s models. The ISO 25010 standard is also known as the Software product Quality Requirements and Evaluation (SQuaRE) model. We have defined an automotive quality model based on the SQuaRE model and a set of metrics related to the quality (sub-)characteristics for MATLAB/Simulink models [56]. In this thesis, we focus on modularity and complexity aspects of Simulink models. Modularity and complexity aspects are selected because they are considered sub-sub-characteristics of several sub-characteristics e.g., reusability, modifiability, and analysability. These sub-characteristics are part of maintainability characteristic in the ISO 25010 [115]. In the remainder of the thesis, we refer quality to either modularity or complexity if not addressed explicitly. MATLAB/Simulink is a graphical modeling language and the most widespread tool used for embedded automotive software [15]. RQ3 : How can the quality of automotive software models be defined and evaluated?
1.4
Research Methodology
As mentioned earlier, automotive software engineering applies software engineering approaches to the development of automotive software and electronic systems. The research questions are targeted to solve real problems encountering the industrial partner. Because this research is industry-driven, we adopted the “industry-as-laboratory” approach
6
Introduction
introduced by Potts [184]. The nature of this research project required close involvement with the industrial projects and results to be applied to solve practical problems. Software engineering research has failed so far to influence industrial practice and the software quality [184]. The problem is “research-then-transfer”, which fails to address significant problems. Therefore, besides literature study, we interacted closely with the industrial projects to identify the practical problems. The interactions with industry are accomplished in three ways: a survey/interview, industrial case studies, and close collaboration with the software practitioners in industry. To maximize the relevance and usefulness of our contributions to industry, the pragmatism is adopted in our research as a suitable philosophical stance point of view. In pragmatism, knowledge is judged by how useful it is for solving practical problems and a combination of methods can be used to solve a given problem [70]. This stance drives the research and evaluation approaches as we address our research questions. The exploratory character of our research and the low level control on the industrial environment make a case study a suitable research approach [243]. Therefore, we used a case study to investigate the usability of the SysML diagram types for automotive architecture modeling (RQ1 ). Given the pragmatic stance of the research, an interview is used since it is one of the most powerful qualitative methods to collect (historical) information or opinions about a topic [106]. A case study is also applied to evaluate the consistency checking approach proposed to formalize a refinement correspondence between automotive architecture views (RQ2 ). We applied the Goal Question Metric (GQM) paradigm of the software measurement field to define modularity and complexity metrics [22] (RQ3 ). The proposed metrics are evaluated based on qualitative and quantitative analyses using industrial applications.
1.5
Thesis Outline
This section outlines the remainder of this thesis. For every chapter we indicate the research question it addresses and indicates the previous publications it is based upon. Chapter 2: Architecture Framework for Automotive Systems According to the ISO 42010 international standard, Architecture Description Languages (ADLs) and Architecture Frameworks (AFs) are two mechanisms used in architecture description. However, ADLs and AFs for automotive systems have been specified with an incoherent set of architecture description elements. Therefore, this chapter presents the automotive ADLs and AFs, extracts architecture viewpoints and their respective architecture description elements, and proposes an Architecture Framework for Automotive Systems (AFAS). An overview of automotive ADLs and the earlier version of AFAS have been provided in the following publications respectively. [60] Y. Dajsuren, M.G.J. van den Brand, A. Serebrenik, and R.G.M. Huisman. Automotive ADLs: a study on enforcing consistency through multiple architectural levels. In Proceedings of the 8th international ACM SIGSOFT conference on Quality of Software Architectures (QoSA), 2012. doi:10.1145/2304696.2304710.
1.5. Thesis Outline
7
[54] Y. Dajsuren, C.M. Gerpheide, A. Serebrenik, A. Wijs, B. Vasilescu, and M.G.J. van den Brand. Formalizing Correspondence Rules for Automotive Architecture Views. In Proceedings of the 10th international ACM SIGSOFT conference on Quality of Software Architectures (QoSA), 2014. doi:10.1145/2602576.2602588. Chapter 3: Automotive Architecture Modeling To continue addressing RQ1 , we elicit automotive specific architecture modeling requirements based on interviews with automotive domain experts. Then the automotive-related ADLs, which are presented in Chapter 2, are evaluated based on the automotive specific modeling requirements. Based on the evaluation, SysML was identified as a viable modeling language for automotive architecture modeling. Although SysML has been evaluated previously by an OEM, automotive supplier, and automotive research institute, the usability of the SysML diagram types is not explicitly addressed. Therefore, we modeled a real-world automotive system to demonstrate architecture modeling in SysML and identified the diagram types considered beneficial for an automotive company. The architecture modeling requirements and the evaluation of the automotive ADLs, and the modeling of a real-world automotive system are discussed in the following publications respectively. [60] Y. Dajsuren, M.G.J. van den Brand, A. Serebrenik, and R.G.M. Huisman. Automotive ADLs: a study on enforcing consistency through multiple architectural levels. In Proceedings of the 8th international ACM SIGSOFT conference on Quality of Software Architectures (QoSA), 2012. doi:10.1145/2304696.2304710. [53] Y. Dajsuren. Evaluating benefits of SysML for DAF. DAF technical report 51050/12-333 (Confidential), 2012. Chapter 4: Formalizing Correspondence Rules for Automotive Architecture Views An architectural consistency between the different architecture views has been identified as one of the key issues during the definition of the AFAS framework. Therefore, this chapter addresses RQ2 . We formalize the notion of correspondence rule between the architecture views in the automotive domain. The approach has been implemented as a Java plugin for IBM Rational Rhapsody, a toolset for SysML. We evaluated it in a case study based on an Adaptive Cruise Control system. An ACC adjusts the vehicle’s speed to maintain a safe distance with the vehicle ahead. It is part of the “active/passive safety” vehicle-centric function domain. The following publications are used for this chapter: [60] Y. Dajsuren, M.G.J. van den Brand, A. Serebrenik, and R.G.M. Huisman. Automotive ADLs: a study on enforcing consistency through multiple architectural levels. In Proceedings of the 8th international ACM SIGSOFT conference on Quality of Software Architectures (QoSA), 2012. doi:10.1145/2304696.2304710. [54] Y. Dajsuren, C.M. Gerpheide, A. Serebrenik, A. Wijs, B. Vasilescu, and M.G.J. van den Brand. Formalizing Correspondence Rules for Automotive Architecture Views. In Proceedings of the 10th international ACM SIGSOFT conference on Quality of Software Architectures (QoSA), 2014. doi:10.1145/2602576.2602588.
8
Introduction
Chapter 5: Modularity Analysis of Automotive Control Software This is the first of three chapters in which we address RQ3 . In this chapter, we evaluate the modularity of Simulink models based on the modularity metrics. The following publications are used for this chapter. [61] Y. Dajsuren, M.G.J. van den Brand, A. Serebrenik, S. Roubtsov. Simulink models are also software: Modularity assessment. In Proceedings of the 9th International ACM Sigsoft Conference on the Quality of Software Architectures (QoSA), 2013. doi:10.1145/2465478.2465482. [59] Y. Dajsuren, M.G.J. van den Brand, A. Serebrenik. Modularity analysis of automotive control software. In ERCIM News, issue 94 (ISSN 0926-4981), 2013. [56] Y. Dajsuren, R.G.M. Huisman. Definition and evaluation of quality metrics for automotive software models. DAF technical report 51050/15-041 (Confidential), 2015. Chapter 6: Complexity Metrics Suite for Simulink Models In this chapter, we continue addressing RQ3 . Due to the increasing complexity and size of Simulink models of automotive software systems, it has become a necessity to maintain the Simulink models. We define complexity metrics for Simulink models and evaluate them on industrial control software. The following publications are used for this chapter: [57] Y. Dajsuren, A. Serebrenik, R.G.M. Huisman, M.G.J. van den Brand. A Quality Framework for Evaluating Automotive Architecture. In Proceedings of the FISITA World Automotive Congress, 2014. [56] Y. Dajsuren, R.G.M. Huisman. Definition and evaluation of quality metrics for automotive software models. DAF technical report 51050/15-041 (Confidential), 2015. Chapter 7: Managing Clone Mutations in Simulink Models This is the last of three chapters in which we address RQ3 . We present a mechanism for clone management based on Variant Configuration Language (VCL) [7] that provides a powerful variability handling mechanism. In this mechanism, the clones will be managed separately from the models in a non-intrusive way and the original models will not be polluted with extra complexity to manage clone instances. The proposed technique is validated by creating generic solutions for Simulink clones with a variety of differences present between them. The preliminary version of this chapter has appeared as: [23] H.A. Basit, Y. Dajsuren. Handling Clone Mutations in Simulink Models with VCL. In Proceedings of The 8th International Workshop on Software Clones, ISSN 1863-2122, 2014. Chapter 8: Conclusions This chapter concludes the thesis by summarizing the main contributions of this research and discussing directions for future research.
Chapter
2
Architecture Framework for Automotive Systems
Although architecture frameworks have not been standardized in the automotive industry, different types of architecture viewpoints and views have been introduced recently as part of automotive architecture frameworks. In this chapter, we first present a literature review which has been carried out to discover the existing architecture frameworks and architecture description languages for the automotive industry, as well as their benefits and gaps. We propose an Architecture Framework for Automotive Systems (AFAS) based on the extracted viewpoints from existing automotive architecture description mechanisms.
2.1
Introduction
An Architecture Description Language (ADL) is considered a viable solution to manage multi-disciplinary engineering information in an effective way [38, 166, 208]. According to the ISO 42010 international standard [116], an ADL provides one or more model kinds (data flow diagrams, class diagrams, state diagrams, etc.) as a means to frame some concerns for its stakeholders. Model kinds can be organized into architecture views, which are governed by architecture viewpoints. Recognizing the importance of ADLs, automotive companies have been actively involved in their development over the last decade. These include BMW who have been involved in developing AML [32, 189], as well as Volvo, Fiat, and VW/Carmeq who have been involved in developing the EAST-ADL [50] and TADL [228]. EAST-ADL is being extended to model the fully electric vehicle in the scope of the ICT MAENAD project, where many automotive manufacturers and suppliers are participating [147]. Besides the automotive ADLs, SysML [176] and MARTE [169] are also attracting considerable attention of automotive companies [16, 20, 187]. According to the ISO 42010 international standard [116], in addition to an ADL, an architecture framework is another key mechanism used to describe architectures. An architecture framework provides conventions, principles and practices for the description of architectures within a specific domain and/or community of stakeholders [116]. The benefits of existing architecture frameworks such as Kruchten’s 4+1 view model [133],
10
Architecture Framework for Automotive Systems
AML
EAST-ADL
AADL SysML
MARTE
EAST-ADL2
AAF 2002
2004
2006
2008
ADF 2010
2012
2014
Figure 2.1: Timeline of the automotive architecture description mechanisms Ministry of Defense Architecture Framework (MODAF) [170], The Open Group Architecture Framework (TOGAF) [6], and ISO Reference Model for Open Distributed Processing (RM-ODP) [112], drive the creation of architecture frameworks for other industries. Having a standardized architectural foundation and specifically automotive-specific architecture frameworks is very important for the automotive industry. The key elements of this proposed architecture framework was first introduced in the scope of the Automotive Architecture Framework (AAF) [40]. The AAF aimed to describe the entire vehicle system across all functional and engineering domains and drive the thought process within the automotive industry [40]. Only in recent years, automotive companies have started to take initiative in defining an architecture framework for automotive systems, for example, Architecture Design Framework (ADF) by Renault [92]. Automotive embedded systems are categorized into vehicle-centric functional domains (including powertrain control, chassis control, and active/passive safety systems) and passenger-centric functional domains (covering multimedia/telematics, body/comfort, and human machine interface (HMI)) [166]. Each functional domain needs to tackle different system concerns. For example, the powertrain control enables the longitudinal propulsion of the vehicle, body domain supports the functioning of the airbag, wiper, and lighting and other functions for the vehicle users). However, all the integrated functionalities must not jeopardize the key vehicle requirements of safety and efficiency. The automotive industry is vertically organized [38], which facilitates independent development of vehicle parts. An automobile manufacturer (called an “original equipment manufacturer”, or OEM) creates the functional architecture and distributes the development of the functional components to the suppliers, who implement and deliver the software models and/or hardware [38]. Software models for each functional component or subsystem can be developed in different ADLs or programming languages, which may make the integration process at the OEM more cumbersome. This process requires common architecture frameworks between OEMs and suppliers or at least better formalization of architecture views and consistency between them. Therefore, there needs to be a common definition of an ADL and architecture framework and these should be applicable for all functional domains. However, architecture description elements of an automotive-related ADL and architecture frameworks (i.e., architecture viewpoints, views, and correspondences) are not systematically defined. Figure 2.1 shows the timeline of the automotive architecture description mechanisms. This chapter extracts architecture elements (viewpoints, views) from automotive ADLs, compares the extracted elements with the existing automotive architecture frameworks and proposes an Architecture Framework for Automotive Systems (AFAS) with a coherent set of architecture views.
2.2. Automotive AFs and Viewpoints
11
Figure 2.2: A conceptual model of an architecture framework [116].
2.1.1
Chapter outline
Section 2.2 presents the automotive architecture frameworks and describes the architecture viewpoints defined in the automotive frameworks. Section 2.3 introduces automotiverelated ADLs and presents the extracted architecture viewpoints from the ADLs. Section 2.4 presents an Architecture Framework for Automotive Systems (AFAS), which contains architecture viewpoints and views consistent with the automotive AFs and ADLs. Section 2.5 summarizes the chapter.
2.2
Automotive AFs and Viewpoints
An architecture framework establishes a common practice for creating, interpreting, analyzing and using architecture descriptions within a particular domain of application or stakeholder community [116]. While an Architecture Description Language (ADL) is used to describe or represent an architecture, an architecture framework enables the efficient use of an ADL for a particular domain. Therefore, a standard architecture framework in the automotive industry can enable an efficient architecture description for system stakeholders. In the ISO 42010 international standard, a conceptual model of an architecture framework as shown in Figure 2.2 is almost identical to the conceptual model of an ADL as shown in Figure 3.1. The differences are as follows: • An architecture framework should provide at least a single architecture viewpoint, which is used to organize the model kinds. • An ADL should define at least a single model kind without necessarily providing a architecture viewpoint. In this section, we present the automotive architecture frameworks, extract common architecture viewpoints, and summarize other architecture viewpoints that exist only in one of the architecture frameworks.
12
Architecture Framework for Automotive Systems
Figure 2.3: A conceptual model of an architecture description language [116].
2.2.1
Automotive Architecture Frameworks
Automotive Architecture Framework (AAF) [40] is the first architecture framework for the automotive industry to pave the way for a standardized architecture description. The AAF was defined to describe the entire vehicle system across all functional and engineering domains. Since the AAF conforms to the ISO 42010 international standard [40], a set of viewpoints and views are explicitly defined. The AAF proposes two sets of architecture viewpoints: mandatory or general viewpoints and optional viewpoints. Mandatory viewpoints and their respective views include Functional viewpoint, Technical viewpoint, Information viewpoint, Driver/vehicle operations viewpoint, and Value net viewpoint. Optional viewpoints suggested by the AAF are safety, security, quality and RAS (reliability, availability, serviceability), energy, cost, NVH (noise, vibration, harshness), and weight. The general viewpoints are intended to be closer to the already proven frameworks in other manufacturing industries e.g. RASDS [227] and RM-ODP [112]. Since the introduction of the concepts in the first draft of the AAF, further research is needed to identify automotive specific architectural elements. Architectural Design Framework (ADF) [92] is developed by an OEM to support the construction of an architecture framework for the automotive industry. The ADF includes operational, functional, constructional, and requirements viewpoints. Although the AAF and ADF are constructed to provide the basis for the architecture framework for the automotive industry, architecture viewpoints and views are extracted from architecture frameworks from other industries. Furthermore, in these frameworks, the definition of architectural elements including architecture viewpoints, views, and correspondences have not been addressed consistently with automotive ADLs.
2.2.2
Extracting Viewpoints from Automotive AFs
An architecture framework may include one or more architecture viewpoints, which consist of a set of model kinds [116]. We discussed above the architecture viewpoints and views of AAF and ADF frameworks. The viewpoints are described in a similar way to the viewpoint catalog [204]. Below we extract the common viewpoints of AAF and ADF according to the following template: • Definition: Definition of the viewpoint is presented.
2.2. Automotive AFs and Viewpoints
13
• Stakeholders: Although the stakeholders are not explicitly identified for the viewpoints in the AAF and ADF, we list the stakeholders. • Concerns: Stakeholder concerns are defined. • Views: The views governed by the viewpoints are presented. • Model kinds: The model kinds used in the viewpoint are presented. Functional viewpoint Table 2.1 summarizes the functional viewpoint, which is defined both in the AAF and ADF frameworks. A function realizes a feature in a set of interacting and interdependent software and/or hardware components. The functional viewpoint extracted from automotive ADLs as discussed in Section 2.3.2 generally matches the description of the functional viewpoint in AAF and ADF frameworks. In AAF, the functional viewpoint describes vehicles in terms of vehicle functions and their logical interactions. The AAF functional viewpoint governs a functional view, which describes the functional composition of a vehicle, its functional entities, interfaces, interactions, interdependencies, behavior and constraints [40]. Although AAF does not specify a particular model kind for the functional viewpoint, it defines the functional architecture. The functional architecture describes the system from the blackbox-perspective by describing the system’s functionality that is presented to the outside world [40]. The stakeholders of the AAF are defined as OEMs, suppliers, tool vendors, and research institutes. Stakeholder concerns are not explicitly defined for the AAF functional viewpoint. Based on the description of the functional viewpoint, we defined them as functional composition and interfaces. The functional viewpoint corresponds to the technical and optional viewpoints. In ADF, the functional viewpoint supports three main views: functional breakdown structure, functional architecture, and allocation on functions [92]. ADF defines SysML model kinds for each functional views. SysML Activity Diagram (AD), Block Definition Diagram (BDD), and Internal Block Diagram (IBD) are defined for the functional breakdown structure view. In the activity diagram, the system functions are defined by regrouping or refining activities (actions) identified in the operational scenario views and allocating them to SysML blocks. In the BDD and IBD, ports and connectors conform to Table 2.1: Functional Viewpoint Functional viewpoint Definition Stakeholders
It describes the vehicle functions and their interactions. AAF: OEMs, suppliers, tool vendors, and research institutes ADF: Undefined Concerns Functional composition and interfaces Architecture views AAF: Functional view ADF: Functional breakdown structure view, functional architecture view, allocation on functions view Model kinds AAF: Functional architecture (Functional composition of a vehicle, its functional entities, interfaces, interactions, interdependencies, behavior and constraints) ADF: AD, BDD, IBD for the functional breakdown structure view; AD, BDD, IBD for the functional architecture; allocation concept for the requirements allocation on functions views Correspondence rules AAF: Correspondences to technical and optional viewpoints e.g., energy ADF: Refinement and conformance correspondence to the operational viewpoint
14
Architecture Framework for Automotive Systems
a flow type (e.g., energy, information) of external interfaces and object flows specified in ADs [92]. Although it is not explicitly mentioned in the ADF, an allocation concept is plausibly used for allocating requirements to functions (blocks). Stakeholders, their concerns, and correspondence rules are not explicitly determined in the ADF. We expect the same stakeholders and concerns for the AAF are applicable to the ADF. Regarding correspondence, the functional viewpoint conforms or refines the operational viewpoint. Technical/Constructional viewpoint Table 2.2 presents the technical/constructional viewpoint, which looks at a vehicle in terms of its physical components, their relationships and constraints. AAF refers to it as a technical viewpoint and ADF refers to it as a constructional viewpoint. In AAF, the technical viewpoint addresses a vehicle from the perspective of its physical components. This includes Electronic Control Units (ECUs), their geometry and composition within superordinate geometric structures, as well as their relationships. It also includes the vehicle’s behavior such as, physical aspects like thermodynamics, acoustics, vibrations, mechanical deformation, as well as dependencies and constraints [40]. The AAF technical viewpoint governs a technical view, which consists of runtime model view, hardware topology view, and allocation view. As in the AAF functional view, the technical view does not specify the model kinds for its constituent views, instead the definitions of what they should represent are provided. The technical architecture describes how the system can be realized into a given hardware platform [40]. It consists of the runtime model, the hardware topology, and the allocation model. The runtime model describes the behavior of the system from a physical/technical perspective. The hardware topology model describes the structure of the hardware platform using physical units, which represent hardware components (ECUs, sensors, mechanical components etc.) and their connections (buses, wires etc.) [40]. The allocation model maps the elements of the runtime model to the elements of the hardware topology model [40]. As in the functional viewpoint, all stakeholders are considered relevant to the technical viewpoint. AAF determines that the technical viewpoint has strong correspondences to the functional viewpoint and optional viewpoints e.g., energy viewpoint. Table 2.2: Technical/Constructional Viewpoint Technical/Constructional viewpoint Definition It describes vehicle physical components, their relationships, constraints, and allocation. Stakeholders AAF: OEMs, suppliers, tool vendors, and research institutes ADF: Undefined Concerns Physical component composition and their relationships Architecture views AAF: Technical architecture view consisting of runtime model view, hardware topology view, and allocation view ADF: Product breakdown structure view, organic architecture view, requirements and function allocation on components view Model kinds AAF: Technical architecture for the technical view consisting of runtime model (for the runtime view), hardware topology (for the hardware topology view), allocation model (for the allocation view) ADF: BDD, IBD for a product breakdown structure view; BDD, IBD for an organic architecture view, requirements and function allocation on components Correspondence rules AAF: Correspondences to the functional viewpoint and optional viewpoints e.g., energy viewpoint ADF: Conformance correspondence to the functional viewpoint
2.2. Automotive AFs and Viewpoints
15
The ADF constructional viewpoint supports the product breakdown structure, organic architecture, and allocation on components views. ADF also defines SysML the model kinds for each constructional view. SysML BDD and IBD model kinds are selected for the product breakdown structure and organic architecture views. The allocation concept is used for allocating requirements and function to components [92]. The product breakdown structure identifies and allocates the system functions to physical components. The organic architecture defines the components of the system, their interfaces and connections, which satisfy the system’s technical requirements (e.g., cost, weight, size, authorized/forbidden use of materials) and other criteria (e.g., performance, effectiveness) [92]. Architecture models for the allocation on components view captures the allocation and structuring of the system requirements and functions to physical components to achieve an optimal allocation. The flows between functions are associated with the interfaces/connectors (e.g., mechanic, electric, network) between components [92]. As in the functional viewpoint, all stakeholders are considered relevant to the constructional viewpoint. ADF does not specify the concerns and correspondences explicitly. However, we identified the same concerns as AAF. The conformance correspondence is detected according to the implicit description of architecture views of the ADF constructional viewpoints. Requirements viewpoint Table 2.3 presents the requirements viewpoint, which looks at the vehicle from the perspective of the vehicle stakeholders including end users (drivers and passengers) and vehicle environment. We map the AAF driver/vehicle operations mandatory viewpoint, value net mandatory viewpoint, and all the optional viewpoints i.e., safety, security, quality, RAS (reliability, availability, serviceability), energy, cost, NVH (noise, vibration, harshness), and weight viewpoints to the ADF requirements viewpoint. In ADF, requirements viewpoint captures elicitation of stakeholder requirements and elaboration of system technical requirements. ADF requirements viewpoint supports the stakeholder requirements view, high-level requirements view, and system technical requirements view. The ADF requirements viewpoint is in alignment with the AAF mandatory viewpoints driver/vehicle operations and value net viewpoints. The AAF driver/vehicle operations viewpoint looks at the interactions, interfaces, interdependencies between vehicle and its end user (driver and passengers) as well as the surrounding environment (e.g., road, other vehicles, and traffic control systems) [40]. In addition, it describes the related behavior, constraints, and priorities. The driver/vehicle operations viewpoint governs driver/vehicle operations view. Actors and system boundary are also captured as part of the ADF stakeholder requirements view. The AAF value net viewpoint is used to optimize the efficiency of the value creation process [40]. It can also be captured by the ADF stakeholder requirements view. High-level requirements are identified after the stakeholder requirements are elicited. An example high-level requirement can define measures of effectiveness or Key Performance Parameters (KPP) [92]. The technical requirements are built after the operational models are defined e.g., by defining functional requirements from operations identified in sequence diagrams in the operational view [92]. Technical requirements capture functional, performance, interface requirements or constraints [92]. What is captured in the AAF optional viewpoints depends on the vehicle system. However, ADF requirements viewpoint can support viewpoints such as i.e., safety, security, quality, RAS, energy, cost, NVH, and weight viewpoints. In AAF, no specific model kind is defined for requirements related viewpoints. In ADF, SysML requirements diagram type is selected for the requirements viewpoint [40].
16
Architecture Framework for Automotive Systems
Formalization of stakeholder and high-level requirements and elaboration of system technical requirements are captured by the SysML requirements diagram for all these views. All stakeholders, including vehicle end users (drivers and passengers), are defined for this viewpoint. Interactions, interfaces, and interdependencies between vehicle, end users, and the surrounding environment are key concerns. This viewpoint corresponds to other viewpoints to enable the requirements traceability of each viewpoint. Other viewpoints AAF information viewpoint is mandatory, but does not have a similar viewpoint in the ADF. The information viewpoint looks at the vehicle from the perspective of information or data objects used to define and manage a vehicle [40]. It governs the information view, which describes information or data objects, their metadata, properties, relationships, configurations, and configuration constraints [40]. ADF operational viewpoint is the most abstract viewpoint of the ADF framework. The operational viewpoint governs structural and behavioral operational views. The structural operational view consists of the maximal system scope, system environment, operational context, external interfaces, and use-cases views [92]. The actors, system scope, system environment and high-level interactions are identified in these structural views. The behavioral operational view consists of operational scenarios and system working modes views. These views are built from the structural operational views [92]. System use cases are used to identify actors, the system boundary and high-level interactions, which are refined in SysML sequence diagrams. Operational scenarios view addresses detailed interactions between the system and external systems/user/environment to realize the use cases. System working states view uses state machines to describe alternative conditions for operational scenarios [92]. SysML diagram types are mapped to the operational viewpoint as following: SysML internal block diagram type is selected for the maximal system scope, system environment, operational context, and external interfaces views. SysML use case diagram type is selected for the use-cases view. SysML sequence and activity diagram types are selected for the operational scenarios view. SysML state machine diagram type is selected for the system working modes view. Although these viewpoints exist only in one of the architecture frameworks, we address these viewpoints in the definition of the Architecture Framework for Automotive Systems Table 2.3: Requirements Viewpoint Requirements viewpoint Definition It captures the vehicle from the perspective of the vehicle driver and the world around the vehicle. Stakeholders AAF: All stakeholders (End users, OEMs, suppliers, tool vendors, and research institutes) ADF: Undefined Concerns Interactions between vehicle, end user, environment Architecture views AAF: Driver/vehicle view, value net view, optional views (safety, security, quality, RAS, energy, cost, NVH, and weight views) ADF: Stakeholder requirements view, high-level requirements view, system technical requirements view Model kinds AAF: Driver/vehicle operations model, value net model, models for safety, security, quality, RAS, energy, cost, NVH, and weight views ADF: Requirements diagram for the stakeholder requirements, high-level requirements, and system technical requirements views Correspondence rules AAF: Correspondences to other mandatory viewpoints ADF: Correspondence to the operational, functional, constructional viewpoints
2.3. Automotive ADLs and Viewpoints
17
Figure 2.4: ADL conceptual model [116] (AFAS) in Section 2.4 e.g., the information viewpoint of the AAF is included in the AFAS framework.
2.2.3
Discussion
Architecture framework for the automotive systems have not been standardized in the automotive industry. Automotive Architecture Framework (AAF) and Architecture Design Framework (ADF) aim to define a complete and integrated architecture framework for the automotive industry. We have identified common architecture viewpoints of these frameworks and summarized those that exist only in one of the frameworks. In the following section, we present the automotive ADLs and extract the viewpoints defined in the scope of the automotive ADLs. In Section 2.4, we then integrate the common architecture viewpoints of architecture frameworks and ADLs. Other viewpoints are also considered in the definition of the architecture framework.
2.3
Automotive ADLs and Viewpoints
According to the ISO42010 international standard for systems and software engineering [116], an Architecture Description Language (ADL) is any form of expression used to describe an architecture. As illustrated in Figure 3.1, an ADL provides one or more model kinds (data flow diagrams, class diagrams, state diagrams etc.) as a means to frame some concerns for its stakeholders [116]. In the case of several model kinds provided by an ADL to capture complex architectural representations, architecture viewpoints can be used to organize them. Correspondence rules can be used to express and enforce architecture relations e.g., refinement, composition, and traceability. In this section, we present the automotive architecture ADLs, extract common architecture viewpoints, and summarize other architecture viewpoints that exist only in one of the ADLs. We apply the same template followed in Section 2.2.2, when describing the architecture viewpoints.
2.3.1
Automotive ADLs
EAST-ADL [50] (Embedded Architectures and Software Technologies–Architecture Description Language) is an architecture description language for automotive domain. It
18
Architecture Framework for Automotive Systems
has been defined in the scope of an European research initiative, ITEA project EASTEEA since 2001 [50]. The EAST-EEA project aimed to reduce automotive software’s dependency on hardware, allowing more flexibility regarding the allocation of software [166]. The EAST-ADL has been refined in the ATESST project to EAST-ADL2 [225], which was extended further to support modeling of fully electric vehicles in the scope of the MAENAD project to EAST-ADL2.1.12 [146]. In the remainder of the chapter, EASTADL refers to the EAST-ADL2.1.12. The main purpose of EAST-ADL is to capture engineering information of automotive Electrical/Electronic (E/E) systems to enable modeling of the entire system development lifecycle. The language consists of four main abstraction levels, which can be considered architecture viewpoints of the ISO 42010 standard. The highest level is called a Vehicle level, where the basic vehicle features, requirements and use cases are captured. The abstract functionalities based on the requirements and features are further defined in the Analysis level and further refined as the concrete functionalities in the Design level. The design level also contains functional definitions of application software, hardware components, and middleware. It also covers function to hardware (e.g., ECU) allocations. The lowest abstract level, Implementation level, uses AUTOSAR [5] concepts to realize the higher level models. Requirements, variability, timing, dependability, and environment models are captured in parallel with these abstraction levels. TADL [228] (Timing Augmented Description Language) is originated from EAST-ADL, AUTOSAR, and MARTE. It was developed by the TIMMO project. TADL addresses timing issues early in the development cycle by standardizing specification, analysis and verification of timing constraints in all levels of abstraction of EAST-ADL2. AADL [82] (Architecture Analysis and Design language) was developed to model software, hardware, and system architecture of real-time embedded systems such as aircraft, motorized vehicles, and medical devices. The Society of Automotive Engineers (SAE) defined the AADL as SAE AS5506 Standard based on the MetaH ADL [237]. Initially AADL was known as the Avionics Architecture Description Language. In AADL, a system is constructed as a composite component consisting of application software and execution platform. AADL enables a system designer to perform analyses of the composed components such as system schedulability, sizing analysis, and safety analysis. The focus of AADL is on task structure and interaction topology, although generalization to more abstract entities is possible. It supports the definition of mode handling, error handling, inter process communication mechanisms. As such, it acts as a specification of the embedded software, which can be used for automatic generation of an application framework where the actual code can be integrated smoothly. The language supports different types of analysis mechanisms e.g., for safety and timing analysis. Further, a behavioral annex is proposed, to allow a common behavioral semantics for AADL descriptions. AML [189] (Automotive Modeling Language) is developed in the scope of the FORSOFT project, which defined an architecture centric language to analyse and synthesize automotive embedded systems. Similar to other ADLs, it offers commonly accepted modeling constructs to specify the software and hardware parts of the system architecture. The architecture is described by using components, in- and out-ports, and connectors. The abstract syntax of the AML provides a conceptual and methodological framework as
2.3. Automotive ADLs and Viewpoints
19
SysML diagram
Requirement diagram
Structure diagram
Behavior diagram
Figure 2.5: SysML structure a prerequisite for well-defined semantics of the offered modeling constructs. The usage of different kinds of textual, graphical, or tabular notations for a concrete model representation is supported. AML models can be represented by various notational elements offered by wide spread modeling languages and tools such as ASCET-SD1 , UML 1.4/2.0 and UML-RT. SysML [176] (Systems Modeling Language) of OMG is a general purpose graphical modeling language to support specification, analysis, design and verification of complex systems. It is sponsored by INCOSE/OMG with broad industry and vendor participation and adopted by the OMG in 2006 as OMG SysML. The SysML adjusts UML2 [175] to system engineering by excluding unrelated diagrams and including new modeling concepts and diagrams for systems engineering. The SysML concepts concern requirements, structural modeling, and behavioral constructs. New diagrams include a requirement diagram and a parametric diagram and adjustments of UML activity, class, and composite structure diagrams. See Section 3.4,where a more detailed discussion of these diagram types is provided. Tabular representations of requirements or allocations, for example, are also included as an alternative notation. Multiple vendors support SysML tools such as Artisan Studio (Atego) [21], MagicDraw (No Magic) [167], Enterprise Architect (Sparx Systems) [219], Sirius (Eclipse) [72], Rational Rhapsody (IBM) [109], and PolarSys (Former TOPCASED) (Eclipse) [71]. One of the drawbacks of SysML is that SysML, as in UML, does not have a well-defined semantics. Figure 4.3 illustrates the SysML structure, which consists of the following diagram types: • The requirement diagram provides cross cutting relationships between requirements and system models. • The structure diagrams are Block Definition Diagrams (BDD), Internal Block Diagrams (IBD), package diagrams, and parametric diagram. UML class and composite structure diagrams are the basis of the BDD and IBD. A parametric diagram is a new diagram type, which can define quantitative constraints like maximum acceleration, minimum curb weight, and total air conditioning capacity. • The behavior diagrams are use case, state machine, activity diagrams, and sequence diagrams. Activity diagram is modified from UML2.0 activity diagram. Tabular representations of requirements or allocations, for example, are also included as an alternative notation. SysML can be used to model hardware, software, information, processes etc. 1 ETAS
ASCET-S http://www.etas.com/
20
Architecture Framework for Automotive Systems Table 2.4: Automotive ADLs and viewpoints Viewpoint Feature Functional
Logical
EAST-ADL AADL AML Technical feature Functional Layered sys- Functional analysis tem modeling network
Functional design (Functional design architecture) Implementation AUTOSAR software representation, Hardware design architecture
Composite system
Application software, Execution platform
SysML
MARTE
Functional viewpoint (from ADF)
System configuration, Generic component Logical archi- A subset of High level aptecture functional plication viewpoint (from ADF) Technical ar- ConstrucAllocation chitecture tional viewpoint (from ADF)
MARTE [169] (Modeling and Analysis of Real Time and Embedded) profile is an OMG standard for modeling real-time and embedded applications in UML2. It provides fundamental concepts of modeling and analyzing concerns of the real-time and embedded systems such as performance, schedulability issues. MARTE design model supports real-time embedded models of computation and communication, software and hardware resource modeling, while analysis model enables generic quantitative analysis, schedulability, and performance analysis and refinement [89]. Both hardware and software aspects are supported.
2.3.2
Extracting Viewpoints from Automotive ADLs
The relationship between the architecture description elements (i.e., stakeholders, concerns, viewpoints, views, and model kinds) is presented in IEEE 1471-2000 standard and subsequently in ISO 42010 international standard [116]. Correspondences and correspondence rules are used to express and enforce architecture relations (e.g., composition, refinement, consistency, traceability and dependency) within or between architecture description elements [116]. However, architecture description elements remain vague in automotive ADLs. Therefore, in this section, we identify the viewpoints together with other architecture elements, namely stakeholders, concerns, viewpoints and respective model kinds from automotive ADLs introduced in Section 2.3.1. The summary of the viewpoints extracted from the automotive ADLs is presented in Table 2.4. Feature viewpoint Product line engineering is one of the software engineering approaches to reduce software development costs. It is used by some automotive suppliers, but it is not used by the OEMs [38]. A feature is an end-user visible characteristic of a system [121] and it is captured in the feature viewpoint. The feature viewpoint is absent in the extracted viewpoints from automotive architecture frameworks as discussed in Section 2.2.2. However, EAST-ADL is the only automotive ADL to support product lines in the architecture description. Table 2.5 summarizes the feature viewpoint, which is extracted from the EAST-ADL. As discussed in Section 2.3.1, the highest abstraction level of EAST-ADL is called a vehicle level, where the basic vehicle features, requirements and use cases are captured [225]. The vehicle level can be interpreted as a vehicle view,
2.3. Automotive ADLs and Viewpoints
21
which contains a vehicle feature model. The vehicle feature model is used to describe a product line in terms of available features and their dependencies. The feature model can be used as a starting point to related requirements, use cases, and other constructs [50]. It can be used by all the stakeholders. Feature viewpoints have a correspondence with the environment, requirements, and functional viewpoints. From other automotive-related ADLs, MARTE has mechanisms that can be used for the product line engineering. For example CombinedFragments, abstract class, inheritance, interface implementation, variables can be used for analyzing software product line models [26]. However it is not considered a feature viewpoint, given that the MARTE is not a profile for software product line engineering. Functional viewpoint The functional viewpoint describes the vehicle from the abstract functions and their interactions point of view. Table 2.6 presents the functional viewpoint, which is defined in all automotive ADLs. The definition and purpose of the functional viewpoint of automotive ADLs is the same as the functional viewpoint of the automotive architecture frameworks as discussed in Section 2.2.2. However, the architecture views and model kinds differ among automotive ADLs. In EAST-ADL, the vehicle features are realized by abstract functions in the Functional Analysis Architecture (FAA) at the functional analysis view. The FAA specifies what the system will do by specifying the main structure, interfaces, and behavior to realize the features and requirements from the vehicle view [50]. The FAA does not provide detailed design or implementation decisions. There is an n-to-m mapping between vehicle feature entities and FAA entities i.e., one or several functions may realize one or several features [225]. EAST-ADL provides the concepts for function component modeling to define the logical functionality and decomposition in the FAA [225]. Functions interact with each other via ports that are linked by connectors. The system boundary, environment model, and abstract safety analysis can be carried out in the analysis view [225]. AADL introduced the layered architecture modeling to support hierarchical containment of components, layered use of threads for processing and services, and layered virtual-machine abstraction of the execution platform [205]. In AADL, a system is constructed as a composite system consisting of application software, execution platform, or system components, which are all considered specific type of components. AADL defines components by type and implementation declarations [82]. A component’s interface and external attributes (e.g., interaction points, flow specifications, and internal property values) are defined in a component type declaration [82]. A component’s internal structure (e.g., its subcomponents, subcomponent connections, flow implementations, and Table 2.5: Feature Viewpoint Feature viewpoint Definition
It captures the vehicle from the perspective of the vehicle features and the world around the vehicle. Stakeholders End user, system architect, tier-x designer, safety engineer, tester or maintenance engineer Concerns Vehicle features, interactions between vehicle features, end user, environment Architecture views Vehicle view Model kinds Vehicle feature diagram Correspondence rules Correspondences to Environment, Requirements, and Functional viewpoints
22
Architecture Framework for Automotive Systems
properties) are defined in a component implementation declaration [82]. The AADL core modeling language for the component-based representation enables modeling of components, interactions, and properties [82]. It has graphical and textual representations. The layered architecture and composite system models are further refined in the composite system. Because the functional viewpoint describes the system’s functionality in black-box perspective, we map the layered system modeling to the functional viewpoint. We map the functional network abstraction level to the functional viewpoint, because a network of functions, that is, generic and reusable building blocks, are defined at this level. A function has an interface, which specifies the required and provided signals [189]. Local signals of a function are not accessible to enable reusability [189]. Regarding correspondence to other viewpoints/views, functions can be refined and deployed on different control units of the lower level logical architecture view. For SysML, we reuse the architectural elements of the functional viewpoint in the ADF framework in Section 2.2.2. In the ADF breakdown structure view, functional architecture view, and allocation on functions view are defined for the functional viewpoint. SysML activity diagram, block definition diagram, and internal block diagrams are selected for the breakdown structure view and functional architecture view. Logical viewpoint We generalized a more concrete viewpoint that refines the functional viewpoint as a logical viewpoint. Table 2.7 presents the logical viewpoint, which is (implicitly) defined in all automotive ADLs except AML. Note that the AAF defines Table 2.6: Functional Viewpoint Functional viewpoint Definition Stakeholders
It describes the vehicle functions and their interactions. End user, system or functional architect, tier-x designer, safety engineer, tester or maintenance engineer Concerns Functional composition and interfaces Architecture views EAST-ADL: Analysis view AADL: Layered architecture modeling view AML: Functional network view SysML: Functional breakdown structure view, functional architecture view, allocation on functions view MARTE: Breakdown structure view, functional architecture view, allocation on functions view Model kinds EAST-ADL: Functional analysis architecture (Function component modeling conepts) AADL: Core AADL language AML: AML metamodel and semantics for the functions and functional network SysML: AD, BDD, IBD for the functional breakdown structure view; AD, BDD, IBD for the functional architecture; allocation concept for the requirements allocation on functions views MARTE: AD, BDD, IBD for the functional breakdown structure view; AD, BDD, IBD for the functional architecture; allocation concept for the requirements allocation on functions views Correspondence rules EAST-ADL: Correspondences to feature, environment, and requirements viewpoints (an n-to-m mapping between vehicle feature entities and FAA entities (i.e., one or several functions may realize one or several features) AADL: Refinement correspondence to the composite system view AML: Refinement and allocation correspondence to logical architecture SysML, MARTE: Refinement and conformance correspondence to the logical viewpoint
2.3. Automotive ADLs and Viewpoints
23
Table 2.7: Logical Viewpoint Logical viewpoint Definition
It refines the functional architecture into logical components, which are independent from implementation details and underlying hardware. Stakeholders End user, system architect, tier-x designer, safety engineer, tester or maintenance engineer Concerns Internal structure of the vehicle functions, detailed interactions between and inside vehicle functions Architecture views EAST-ADL: Functional design view AADL: Composite system view AML: Logical architecture view SysML: Functional breakdown structure view Model kinds EAST-ADL: Functional Design Architecture AADL: Core AADL language AML: AML metamodel and semantics for the logical architecture SysML: AD, BDD, IBD for the functional breakdown structure view Correspondence rules EAST-ADL: Refinement correspondence to functional viewpoint (n-to-m mappings by realization relationships between entities in the FDA and entities in the FAA) AADL: Refinement correspondence to the application software, physical platform AML: Refinement correspondence to the functional network view SysML: Refinement and conformance correspondence to the functional viewpoint
logical viewpoint as a white-box representation of a system, but it does not define it as an architecture viewpoint [40]. Thus the logical viewpoint is not listed as one of the architecture viewpoints of the automotive architecture frameworks in Section 2.2.2. However, it is a viewpoint that is common among automotive ADLs. In EAST-ADL, the Functional Analysis Architecture (FAA) of the analysis view (governed by the functional viewpoint) is refined by the Functional Design Architecture (FDA) and Hardware Design Architecture (HDA) at the design level/view [146]. We exclude the HDA from the design viewpoint, because the logical architecture needs to be independent from the underlying hardware. The FDA decomposes the functions defined in the FAA by adding a behavioral description and a detailed interface definition to meet constraints regarding non-functional requirements such as efficiency, reuse, or supplier concerns [146]. There are n-to-m mappings by realization relationships between entities in the FDA and entities in the FAA [146]. In AADL, the internal structure of a system is constructed as a composite system consisting of application software, execution platform, or system components [82], which are all considered specific type of components as described in the functional viewpoint section. Therefore, we map the composite system to the logical viewpoint. The AADL core modeling language for the component-based representation is also applied for the composite system representation. The composite system models are further refined in the application software view. In AML, logical architecture model refines the functional network models [189]. The logical architecture model describes the logical control units, actors, and sensors of the environment [189]. The functions defined in the functional network are deployed on different logical control units. However, implementation details like the system is clocked (not event driven), communication between/within logical control units are synchronous are specified at this stage. For SysML, we reuse the part of the architectural elements of the functional viewpoint
24
Architecture Framework for Automotive Systems Table 2.8: Implementation Viewpoint
Implementation viewpoint Definition It realizes the logical architecture into software and hardware components. Stakeholders End user, system architect, tier-x designer, safety engineer, tester or maintenance engineer Concerns Implementation of logical components into software and hardware components, optimal resource utilization, allocation, performance estimation etc. Architecture views EAST-ADL: Implementation view, Design view (hardware design) AADL: application software view, execution platform view AML: technical architecture view SysML: Product breakdown structure view, organic architecture view, requirements and function allocation on components view Model kinds EAST-ADL: AUTOSAR application software, AUTOSAR basic software (using AUTOSAR software component template, ECU resource template, and system template), Hardware Design Architecture from the design level AADL: Core AADL language AML: AML metamodel and semantics for the technical architecture SysML: BDD, IBD for a product breakdown structure view; BDD, IBD for an organic architecture view, requirements and function allocation on components Correspondence rules EAST-ADL: Realization correspondence to Logical viewpoint (n-to-m mappings by realization relationships between entities in the implementation view and entities in the design view) AADL, AML, SysML: Realization correspondence to the logical viewpoint
in the ADF framework in Section 2.2.2. The ADF breakdown structure view is defined to capture function identification and decomposition. SysML activity diagram, block definition diagram, and internal block diagrams are selected for the breakdown structure view. Implementation viewpoint The implementation viewpoint describes the software architecture of the Electrical/Electronic (E/E) system in the vehicle [146]. Table 2.8 summarizes the implementation viewpoint elements extracted from the automotive ADLs. In EAST-ADL, the implementation viewpoint is supported by the system architecture and software architecture of AUTOSAR [146]. AUTOSAR serves as a basic infrastructure for the management of functions within both future applications and standard software modules [5]. In EAST-ADL, AUTOSAR software components realize the Functional Design Architecture and AUTOSAR basic software components realize the Hardware Design Architecture using the AUTOSAR software component, ECU resource, and system templates. Regarding the correspondence, traceability is supported from implementation level elements (AUTOSAR) to upper level elements by realization relationships [146]. In addition to the AUTOSAR system and software architectures, the EAST-ADL Hardware Design Architecture (HDA) is also mapped in this viewpoint. HDA is then refined further by ECU specifications and topology. In AADL, a system instance consists of application software components and execution platform components [82]. In AML, the technical architecture enriches the logical architecture with concrete technical information e.g., concrete bus, control unit, and operating system specifications [189]. The performance estimation can be carried out in this architecture modeling [189]. AML language is used for this viewpoint. We consider the constructional viewpoint discussed in the ADF in Section 2.2.2 as
2.3. Automotive ADLs and Viewpoints
25
part of the implementation viewpoint, because it decomposes a vehicle into physical components and defines their relationships and constraints. Then the implementation viewpoint for SysML supports product breakdown structure, organic architecture, and allocation on components views. As discussed in Section 2.2.2, ADF identifies SysML BDD and IBD model kinds for the product breakdown structure and organic architecture views. The allocation concept is used for allocating requirements and functions to components [92]. The product breakdown structure identifies and allocates the system functions to physical components. The organic architecture defines the components of the system, their interfaces and connections, which satisfy the system’s technical requirements (e.g., cost, weight, size, authorized/forbidden use of materials) and other criteria (e.g., performance, effectiveness) [92]. Architecture models for the allocation on components view captures the allocation and structuring of the system requirements and functions to physical components to achieve an optimal allocation. The flows between functions are associated with the interfaces/connectors (e.g., mechanic, electric, network) between components [92]. Other viewpoints EAST-ADL extensions are considered as other viewpoints, which are orthogonal to the main architecture viewpoints: • Requirements are captured in EAST-ADL following the principles of SysML [146]. • Variability is realized in EAST-ADL at all levels besides as the feature models on vehicle level [146]. • Timing is supported by the TIMMO project. It defined a methodology and representation of timing aspects in automotive embedded systems [146]. TADL defines timing constraints in all levels of abstraction of EAST-ADL2 [228]. • Dependability extension covers several aspects i.e., availability, reliability, safety, integrity and maintainability [146].
2.3.3
Discussion
Architecture Description Languages (ADLs) have been developed to define automotive architectures effectively to tackle the increasing complexity and development costs [166, 208]. Although the ISO 42010 international standard [116] has defined what constitutes an ADL, the automotive ADLs have been developed without specifying the architectural elements of an ADL as defined in the ISO 42010 international standard. Therefore, we have mapped the architecture viewpoints of the automotive ADLs to the viewpoints of the automotive architecture frameworks. The mapping provides an input for further aligning the architecture elements of the automotive ADLs and automotive architecture frameworks. We have identified common architecture viewpoints and views of these frameworks. In the following section, we integrate the viewpoints and views defined in the scope of the automotive ADLs and automotive architecture frameworks and propose a conceptual model of an architecture framework for automotive systems. Other viewpoints that are briefly presented here are also discussed in the definition of the framework in the following section.
26
Architecture Framework for Automotive Systems
Stakeholders
Viewpoints
End-user
Requirements engineer
Feature
Implementation
Architect
System engineer
Requirements
Deployment
Designer
Manager
Functional
Information
Software engineer
Tester
Concerns
Model kinds Requirements
Behavioral
Structural
Dynamic
Functionality
Traceability
Dependability
Maintainability
Performance
Cost
REQ_ALLVP
IMP_DEP
Safety
Testability
IMP_FNVP
INFO_ALLVP
Correspondence Rules
Figure 2.6: AFAS overview.
2.4
Architecture Framework For Automotive Systems
This section presents the Architecture Framework for Automotive Systems (AFAS), which contains architecture viewpoints consistent with the existing automotive architecture frameworks (AFs) and the automotive Architecture Description Languages (ADLs) as discussed in Sections 2.2 and 2.3 respectively. The architectural elements of the AFAS are shown in Figure 2.6. The AFAS viewpoints are defined based on the preceding analysis of the automotive AFs and ADLs. In addition, we studied proprietary automotive architectural models and practices, and aligned the AFAS with the results based on the interviews carried out with the domain experts from an OEM. The AFAS framework thus contains architectural viewpoints complementary to automotive ADLs, automotive AFs, and proprietary approaches. The simplified architectural elements are illustrated in Figure 2.6. The representation of the AFAS overview is in alignment with the graphical representation in the MEGAF infrastructure [102]. In the following section, we elaborate the architecture viewpoints and related elements of AFAS. Feature viewpoint Since AAF was specified as an automotive industry reference for the Vehicle Line Architectures [40], the feature viewpoint is not specified in the AAF. However, we considered the feature viewpoint necessary, because even a single feature can be configured further, such as cruise control or bluetooth telephone connection, which can be configured for a product or a specific vehicle. Therefore, we revise the feature viewpoint of the EAST-ADL, which is presented in Section 2.3. The feature viewpoint
2.4. Architecture Framework For Automotive Systems
27
contains feature view, which specifies a vehicle feature model. The feature model can be used as a starting point to related requirements, use cases, and other constructs [50]. Automotive architecture frameworks and ADLs do not explicitly define the system stakeholders for the frameworks and ADLs. General stakeholders as end-users, OEMs, suppliers, tool vendors, and research institutes are identified for automotive architecture frameworks. End-users, system architects, tier-x designers, safety engineers, and testers or maintenance engineers are identified from the automotive ADLs. Therefore, we have interviewed a number of domain experts from an OEM and identified stakeholders as driver, fleet owner (fleet information center), manager, product line manager, requirements manager, system/software architect, designer, system integrator, developer, analyst, tester, and (external/internal) supplier. OEMs, suppliers, tool vendors, and research institutes are stakeholders more from the organizational perspective. Therefore, we clarified more specific roles as key stakeholders for an automotive architecture framework. We combined the stakeholders defined for the automotive AFs and ADLs with the stakeholders identified by the automotive domain experts. The selected stakeholders are listed in Figure 2.6. The feature viewpoint can be used by architects, designers, requirements engineers, system engineers, managers, and testers. Feature viewpoints have a correspondence with the requirements and functional viewpoints. Table 2.9 summarizes the revised feature viewpoint. Requirements viewpoint The requirements viewpoint is defined in the automotive AFs as presented in Section 2.2 and defined as an extension in the EAST-ADL language as discussed in Section 2.3. In the AFAS, the requirements viewpoint is included as one of the main viewpoints. We summarize below the description based on the requirements viewpoint of the automotive AFs and EAST-ADL. Table 2.10 presents the requirements viewpoint, which looks at the vehicle from the perspective of the vehicle stakeholders including end users (drivers and passengers) and vehicle environment. As in ADF, the requirements viewpoint captures elicitation of stakeholder requirements and elaboration of system technical requirements. The requirements viewpoint supports the stakeholder requirements view, high-level requirements view, and system technical requirements view as in ADF. Since the AAF driver/vehicle operations view looks at the interactions, interfaces, and interdependencies between the vehicle and its end user and environment, it is considered part of the stakeholder requirements view. The value net view is included, as it is used to optimize the efficiency of the value creation process for an OEM, suppliers, and engineering partners [40]. We map the SysML requirements and use case diagram types for the model kinds, which can be used to model the requirements views. The use case diagram shows the interaction between users and the system. The stakeholder requirements view can also identify actors and system boundary as in ADF. Table 2.9: Feature Viewpoint Feature viewpoint Definition
It captures the vehicle from the perspective of the vehicle features and the world around the vehicle. Stakeholders Architect, Designer, Requirements engineer, System engineer, Manager, and Tester Concerns Functionality, cost, maintainability Architecture views Vehicle feature view Model kinds Vehicle feature diagram Correspondence rules Correspondences to Requirements and Functional viewpoints
28
Architecture Framework for Automotive Systems Table 2.10: Requirements Viewpoint
Requirements viewpoint Definition It captures the vehicle from the perspective of the vehicle driver and the world around the vehicle. Stakeholders All stakeholders (End users, Architect, Designer, Software engineer, Requirements engineer, System engineer, Manager, and Tester) Concerns Functionality, Traceability, Cost Architecture views Stakeholder requirements view, high-level requirements view, system technical requirements view, value net view Model kinds Requirements and use case diagram type for the stakeholder requirements, high-level requirements, and system technical requirements views Correspondence rules Traceability correspondences to other viewpoints
Table 2.11: Functional Viewpoint Functional viewpoint Definition Stakeholders
It describes the vehicle functions and their interactions. Architect, Designer, Requirements engineer, System engineer, Manager, and Tester Concerns Functionality, Dependability, Cost, Maintainability Architecture views Functional view, detailed functional view, allocation on functions view Model kinds BDD for the functional view, IBD for the detailed functional view, allocation concept for the requirements allocation on functions views Correspondence rules Realization and traceability correspondences to the Requirements viewpoint
The requirements viewpoint corresponds to other viewpoints to enable the requirements traceability of each viewpoint. Functional viewpoint The functional viewpoint was defined in both automotive AFs and ADLs. The functional viewpoint is considered the cornerstone of most architecture descriptions [204]. We revise the functional viewpoints of the AFs and ADLs into the Table 2.11. As in AAF, the functional viewpoint describes vehicles in terms of vehicle functions and their logical interactions. We revise the AAF architecture views of the functional viewpoint i.e., a functional view, which specifies a structural model that contains a number of functions or subsystems realizing features. The functional view is the first view that stakeholders try to read due to simplicity [204]. The functional architecture is described in this view, which contains a structural model kind that contains a number of functions or subsystems realizing features. We define a detailed functional view, which refines the functions and their interfaces by specifying more details (similar to logical view). The ADF allocation on functions view is reused in this viewpoint. We revised the SysML diagram types that are defined for the functional viewpoint in ADF. In ADF, SysML activity diagram was selected for the functional breakdown structure and functional architecture views. However, it was stated that the functional requirements need SysML use case, activity, and sequence diagrams to specify the behavior of a function. It was concluded after successful application of SysML in deriving functional architectures from requirements and use cases [134]. The functional architecture represents the static view of the system, therefore behavioral diagrams are not necessary. This concurs with our view that the functional architecture needs to specify abstract functions in a static structural model independent
2.4. Architecture Framework For Automotive Systems
29
Table 2.12: Implementation Viewpoint Implementation viewpoint Definition It realizes the functional architecture into software and hardware components. Stakeholders Architect, Designer, Software engineer, Requirements engineer, System engineer, Manager, and Tester Concerns Dependability, Safety, Performance, Maintainability, Cost Architecture views Software view, hardware view, topology view Model kinds BDD, IBD, AD, SD, SM for a software view, BDD and IBD for the hardware and topology views Correspondence rules Realization correspondence to functional viewpoint (n-to-m mappings by realization relationships between entities in the implementation view and entities in the functional view)
of implementation and technological details. Therefore, we exclude the SysML activity diagram, which was part of the ADF functional viewpoint. From the ADF architecture views of the functional viewpoint, namely breakdown structure view, functional architecture view, and allocation on functions view, the breakdown structure view is not selected for the functional viewpoint. The main reason is that the breakdown structure can be represented in the functional architecture without behavioral models. The allocation of requirements and features to functions is necessary for enabling traceability of the requirements and features. Implementation viewpoint The implementation viewpoint consists of software, hardware, and topology views. Therefore, the technical/constructional viewpoint of the AAF and ADF can be a part of the implementation viewpoint, specifically addressing the hardware view. Table 2.12 revises the implementation viewpoint elements discussed in Section 2.3.2. The implementation viewpoint governs software view, hardware view, and topology view. Software view represents the software architecture, where detailed descriptions and implementation of a function is realized in software components or blocks. The software components realize the functional components. Regarding the correspondence, implementation viewpoint realizes the functional view. In the hardware view, the E/E hardware architecture is represented. The hardware architecture typically consists of ECUs, sensors, actuators and Controller Area Network (CAN) buses. The topology view specifies the connections (buses e.g., CAN, Local Interconnect Network (LIN) and wires etc.,) between ECUs, sensors, and actuators. We consider the constructional viewpoint discussed in the ADF in Section 2.2.2 as part of the hardware view, which is governed by the implementation viewpoint, because it decomposes a vehicle into physical components and defines their relationships and constraints. As in the functional viewpoint, all stakeholders are considered relevant to the implementation viewpoint. ADF does not specify the concerns and correspondences explicitly. However, we identified the same concerns as AAF. The correspondence is conformance according to the implicit description of architecture views of the ADF constructional viewpoints. Deployment viewpoint The deployment viewpoint describes the environment into which the system will be deployed, including capturing the dependencies of the system on its runtime environment [204]. Table 2.13 summarizes the deployment viewpoint elements
30
Architecture Framework for Automotive Systems Table 2.13: Deployment Viewpoint
Deployment viewpoint Definition It defines the environment into which the system will be deployed. Stakeholders Architect, safety engineer, system engineer, tester Concerns Functionality, dependability, performance, safety, cost Architecture views Execution platform view, concurrency view, allocation view Model kinds Process model Correspondence rules Realization correspondence to implementation viewpoint
extracted from the automotive ADLs. The allocation view describes the mapping between software components to ECUs. It can be in a table format. Information viewpoint The information viewpoint of the AAF is included in the AFAS framework, because it describes how the architecture manages and distributes information [204]. The information view is also reused for the information viewpoint. The information view describes information or data objects, their metadata, properties, relationships, configurations, and configuration constraints [40].
2.5
Conclusion
We integrated the architecture viewpoints extracted from automotive AFs and ADLs into Architecture Framework for Automotive Systems (AFAS). The main objective of the framework is to have consistent architecture description elements. The functional viewpoint exists in both AFs and ADLs as it is a cornerstone of architecture description. However, some of the viewpoints are not directly mappable. Therefore, we analyzed the semantics of the architecture description elements and integrated feature, requirements, functional, implementation, and information viewpoints from existing AFs and ADLs. A deployment viewpoint was added to the AFAS, because an OEM plays mostly a role of an integrator or assembler by integrating software/(E/E)/hardware systems into a vehicle.
Chapter
3
Automotive Architecture Modeling
We elicited automotive specific architecture modeling requirements based on the interviews with automotive domain experts. The automotive-related Architecture Description Languages, which are presented in Chapter 2, were evaluated based on the automotive specific modeling requirements. Based on the evaluation, SysML was identified as a viable modeling language for automotive architecture modeling. Although SysML has been evaluated previously by an OEM, automotive supplier and an automotive research institute, the usability of the SysML diagram types has not been explicitly addressed. Therefore, we modeled a real-world automotive system to demonstrate architecture modeling in SysML and identified the diagram types considered beneficial for an automotive company.
3.1
Introduction
An Architecture Description Language (ADL) enables a formal representation of architectures, which helps the creation of a semantically precise architecture documentation and promotes mutual communication [166]. Syntactically and semantically consistent descriptions of architectures further enable exchange descriptions between different tools. In Section 2.2.1, automotive-related ADLs were presented, including EAST-ADL [50], AADL [82], TADL [228], AML [32], SysML [176], and MARTE [169] and architecture views were extracted from these ADLs. As there is no standard ADL for automotive systems, an evaluation of these ADLs was carried out (see Section 3.3.1) using comparisons based on the automotive specific modeling requirements. The Object Management Group’s OMG SysML was selected as a viable candidate [60]. SysML is a general-purpose graphical modeling language for representing systems. SysML was developed to support the transition from a document-based approach to a model-based approach in systems engineering [85]. In a model-based approach, a coherent model of a system needs to be managed instead of documents that represent the system. Many disciplines apply a model-based approach. For example, mechanical engineering has used advanced computer-aided design tools instead of the drawing board since the beginning of the 1980s [90, 191, 239]. Electrical engineering has also used automated
32
Automotive Architecture Modeling
circuit design and analysis instead of the manual circuit design since the 1980s [33, 156], while computer-aided software engineering developed in the 1980s has used UML since the 1990s [85]. A mathematical formalism for model-based approach was developed at the beginning of the 1990s for systems engineering. The main benefits of the model-based systems engineering is to facilitate system engineering activities by providing shared understanding of system requirements and design, by assisting in managing complex system development, and by improving the design quality [85]. As mentioned above, SysML is intended to facilitate the application of a modelbased systems engineering approach by creating a cohesive and consistent model of the system [85]. Although SysML has not become a standard model-based systems engineering approach in the automotive domain, a number of case studies have been carried out to define the applicability and suitability of the SysML language in the automotive domain [16,20,187,215]. In Section 3.4.4 the representative case studies are discussed from an OEM, an automotive supplier, a tool vendor, and an automotive research institute. The selection or identification of the usability of SysML diagram types is, however, not discussed explicitly in these case studies. Furthermore, the approaches are evaluated against document-centric approaches rather than against each other. Document-centric approaches are used more broadly than the model-based approaches in the OEM and suppliers. Therefore, in this chapter, a real-world automotive system was modeled to demonstrate the usability of SysML to model an automotive system. Furthermore the system was evaluated against the proprietary architecture modeling approach of an OEM. The result of the case study is discussed in Section 3.4. The remainder of this chapter is organized as follows. Section 3.2 highlights elicits the automotive specific modeling requirements. Section 3.3 presents the evaluation of the automotive modeling languages based on the automotive specific requirements. Section 3.4 describes the case study and discusses an appropriate set of diagram types. Section 3.5 summarizes the results of this chapter.
3.2
Architecture modeling requirements
Before selecting an appropriate modeling language, automotive companies need to identify the modeling requirements. To elicit the requirements that the modeling approach should satisfy, a series of interviews were conducted with architects responsible for modeling automotive software within one OEM at different architectural levels, ranging from functional architecture to Electrical/Electronic (E/E) architecture. Interviews are one of the most powerful qualitative methods to collect (historical) information or opinions about a topic [106]. A semi-structured interviews format was used, which included a mixture of specific and open-ended questions. This allows the interviewer to collect both specific and unforeseen information [70]. Five senior architects were selected for semi-structured interviews. The interview was carried out by an automotive domain expert and the author. In the field of software engineering, it is recommended to have an interviewer with extensive knowledge of the interview topic in order to confer legitimacy within the interview [106]. Therefore, interviewer used is an expert in architecture modeling for the automotive domain. The expert interviewer gathered domain specific and rich information without filtering the importance or relevance. The collected information is analyzed for its relevance by integrating and modifying the information gathered. The interviews were transcribed in text format by taking notes. Each interview had one hour duration. The information
3.2. Architecture modeling requirements
33
gathered during the interviews was then analyzed and translated into generic modeling requirements. The following modeling requirements (MR) have been determined: MR-1: Requirements traceability at multiple views. Requirements for different architectures should be traceable. Architectures in different views have related sets of requirements. Therefore, requirements traceability for an architecture view and their interdependencies need to be supported. MR-2: Integrated multi-level modeling. It should be possible to model consistent architectures for different architectural levels. Multi-level modeling means modeling by different architects working with diverse abstraction levels addressing different concerns. For example, the highest level of abstraction shows the dependency between different vehicle features. This includes a vehicle feature model containing items such as a DoorLock, a BrakeSystem, and a TransmissionSystem. The lower level abstractions illustrate how the features are realized in a set of modules (e.g., a functional model realizing the features). MR-3: Modeling hierarchical elements. It should be possible to model hierarchical elements in different architectures. This requirement can be interpreted as a hierarchical composition, which enables different levels of detail i.e. a system is decomposed into subsystems, which are decomposed into components (reusable software modules). MR-4: Mapping between architectural entities. This is required to enable mapping between different architectural entities. For example, mapping or allocating a control function (e.g., a cruise control function) to an Electronic Control Unit (ECU). The mapping concept is crucial in order to map vehicle features to components which realize the functional features and mapping software components to hardware components. MR-5: Support of evolution. Explicit techniques for component evolution should be supported. Component evolution is informally defined as a change to the properties of a component such as its interface, implementation, and behavior [157]. Although the average lifespan of a car is eight years, the car requires ongoing software updates, which include upgrades to satisfy new requirements like environmental regulations or bug fixes. MR-6: Determining architectural quality. The modeling approach should support determining the internal architectural quality in order to assess and evaluate architectural models. Internal architectural quality can be supported by enabling external quality mechanisms (e.g., metrics, analysis tool, visualizations) to evaluate the quality. Improving the architectural quality clearly brings an advantage to the quality of architectural modeling, since ensuring internal quality of the system influences the external quality as discussed in Chapter 2. MR-7: Adaptability in the automotive domain. The ability to be adapted and applied into modeling real automotive systems is crucial, because most ADLs are developed in an academic environment and not put to practical use. The main difference between this requirement and the usability requirement is that it requires the ease of adaptation in the automotive domain in general, while the latter requires the ease of use by the automotive domain experts.
34
Automotive Architecture Modeling
MR-8: Usability. Ease of use and understandability by domain experts is required to be able to use the ADL in automotive system modeling. In many cases automotive companies apply proprietary software technologies [38], thus it is critical to make the solution similar to the proprietary approaches. MR-9: Language maturity. Language specification should be stable, as a stable language design reduces the chance for language and architecture co-evolution problems. Language maturity is assessed by evaluating the frequency of new language releases as well as the extent of the changes introduced per release. MR-10: Mature and accessible tool support. The language should be supported by a mature and accessible tool. An ADL needs to have a reliable tool to allow architectural modeling, analysis, code generation etc.
3.3
Evaluation of Automotive ADLs
According to the ISO42010 international standard for systems and software engineering [116], an ADL is any form of expression used to describe an architecture. To aid readability, the ADL conceptual model is also included in Figure 3.1, although it was presented in Chapter 2. An ADL provides one or more model kinds (e.g., data flow diagrams, class diagrams, state machine diagrams) as a means to frame some concerns for its stakeholders [116]. An ADL can provide a single model kind or several model kinds to capture complex architectural representations. In situations where several model kinds are used, architecture viewpoints can be used to organize them. Correspondence rules can be applied to check completeness (of views) or consistency (between views) [116]. In Chapter 2, the architecture viewpoints from the automotive ADLs was extracted. These are evaluated below. As discussed below, the correspondence rules between architecture viewpoints e.g., multiple architectural levels of EAST-ADLs are not explicitly defined. Therefore, in Chapter 4, we propose a method to formalize the refinement correspondence between structural viewpoints. Automotive ADLs facilitate the integration of hardware, software and systems engineering concepts in a unified representation. Based on the literature study, we selected the ADLs designed specifically for the automotive domain and the general-purpose languages as SysML and MARTE, which are explored in automotive case studies. In this section, we revisit the automotive-related ADLs i.e., EAST-ADL [50], AADL [82], AML [189], TADL [228], SysML [176], and MARTE [169], which are presented in Section 2.2.1.
Figure 3.1: ADL conceptual model [116]
3.3. Evaluation of Automotive ADLs
3.3.1
35
Language evaluation
The automotive ADLs were evaluated based on the architecture modeling requirements discussed in Section 3.2. AADL, SysML, and MARTE have been recently evaluated based on different evaluation criteria including code generation, formal verification and variability modeling by the researchers at the Toyota Info Technology Center [215]. Their different choice of evaluation criteria renders our results below incomparable with those findings. EAST-ADL, TADL, AADL, AML, SysML, MARTE are described as relevant approaches for modeling of automotive electronic systems [166]. We cover only automotive-related ADLs, thus AUTOSAR is excluded from this evaluation. AUTOSAR is not an ADL. It is a standard for a component-based software design model for an automotive system, explicitly addressing the E/E architectural level. We provide a summary of comparisons in the Table 3.1. EAST-ADL and TADL adapted the SysML requirement modeling capability, which enables requirements traceability. SysML requirement diagram and relationship types as as: ‘satisfy’, ‘verify’, ‘trace’, enable requirements traceability. A model element can be connected to a requirement via the trace relationship to enable a traceability, which is considered weak as its semantics do not include any constraints [85]. AADL, AML, and MARTE do not explicitly support the requirements traceability. All ADLs except AADL enable integrated multi-level modeling by explicitly defining different architectural levels and the relationships between them. SysML provides explicit language features which support a flexible way of grouping design entities (e.g., viewpoints, views, packages, blocks, parts) and relationship concepts (e.g., conform, refine, and extend relationships). A generic component model is a part of MARTE design model. It is based on the UML component modeling and inspired by some features of SysML, AADL, and EAST-ADL2. Although AADL provides different types of component categories such as Application software, Execution platform, and Composite category, these categories are only specific to the implementation level. Regarding the modeling hierarchical elements, all surveyed ADLs support composite design entities. In SysML, the hierarchal nature of the package, block, part, activity, and state enables the respective SysML diagram types to satisfy this requirement. In MARTE, hierarchal relationships can be represented in package, component, and class diagram types. Mapping between architectural entities at different architectural (abstraction) levels is supported by all ADLs. For example, EAST-ADL enables an n-to-m mapping between feature entities and function entities at the analysis level [50, p. 22]. AADL supports mapping of software onto computational hardware entities [82, p. 4]. AML maps functional-network to a network of threads and ECUs [32, p. 16]. Finally, TADL enables the distribution of time budgets over different design entities at EAST-ADL architecture levels such as the functional design architecture [228, p. 20]. In SysML, this cross-cutting relationship is enabled by an allocation relationship, which is used to map between model entities supporting structural, behavioral, and other forms of allocation [85, p. 343]. MARTE has more extended allocation modeling consisting of an allocation model, a refinement model, and a UML representation of allocation [169, p. 121]. Unlike SysML, MARTE specifies the allocation as an association between a MARTE application and a MARTE execution platform. Most ADLs except AML have support of evolution (to a certain extent) by providing mechanisms to enable component and system evolution. However, connectors are not modeled as first-class objects in EAST-ADL and AADL, therefore no explicit evolution
Automotive Architecture Modeling 36
Requirements MR-1. Requirements traceability at multiple levels MR-2. Integrated multilevel modeling
EAST-ADL The traceability between requirement entities and other design entities are supported. Vehicle, Analysis, Design, and Implementation levels
AML Not supported
Table 3.1: Automotive ADL comparison TADL AADL The traceability between Not supported requirement entities and other design entities are supported. Integration of Timing constructs at different levels (EAST-ADL and AUTOSAR)
SysML The traceability between requirement entities and other design entities are supported. Multi-level modeling elements
component
MARTE Not supported
Generic model
Mapping between differ- Allocation modeling ent entities using an allocate relationship
Different type of hierar- Different type of hierarchical elements (package, chical elements (package, block, part, activity, and component, class) state)
Time budgets are allocated to design entities at different levels
Implementation Logical architeclevel ture, Technical architecture, and Implementation levels Hierarchal system Hierarchical strucabstractions (sys- ture of elements tems of systems, and variants (subset integrated soft- of the elements’ ware and hardware subelements) components) Mapping of software Mapping functions onto computational and functional clushardware entities ters to the technical infrastructure exten- No explicit evolution mechanisms
Subtyping, generaliza- Subtyping, generalization, refinement tion, refinement
Specification v1.0 2007, v2.0 in 2009
academic Concepts available
Automotive case studies
Real-time embedded systems
in
Commercial and open source tool support (e.g., MARTE profile for MagicDraw 15.5, Papyrus MARTE profile)
Specification v1.0 2009, v1.1 in 2011
Defined for the automo- Defined for the auto- Defined using auto- UML inspired graphical UML notations tive domain motive domain motive concepts notations
Used in academic setting Used in setting
Support of architectural No specific mecha- No specific mecha- No specific mechanisms Modeling of quality in quality from timing per- nisms of defining ar- nisms of defining ar- of defining architectural use characteristics spective. chitectural quality chitectural quality quality
Component refinement Component and realization sion
MR-3. Mod- Hierarchal element con- Integration of timing eling hierarchi- cept concepts into hierarchal cal elements elements
MR-4. Map- n-to-m mapping between ping between design entities at differarchitectural ent architectural levels entities MR-5. Sup- Component refinement port of evolu- and realization tion MR-6. De- Quality requirement eletermining ment as part of requirearchitectural ments modeling quality MR-7. Adapt- Used in academic setting ability in the automotive domain MR-8. Usabil- Graphical notation ity based on the UML profile, which is not favored by automotive engineers [94] MR-9. Lan- Language specification guage maturity v1.0 in 2004, v2.0 in 2008, v2.1RC in 2010
in Standard AS5506 in No open specifica- Specification v1.0 in 2004, AS5506A in tion 2006, v1.1 in 2008, v1.2 2009, AS5506/2 in in 2010 2011 OSATE, TOP- No specific tool sup- Commercial and open CASED, and port source tool support (e.g., STOOD toolsets IBM Rational Rhapsody, Atego Artisan Studio, TOPCASED) MR-10. Ma- UML tooling supporting No specific tool support ture and acces- EAST-ADL profile (Pasible tool sup- pyrus UML, MagicDraw port UML, and the EASTADL prototype of MentorGraphics VSA)
3.3. Evaluation of Automotive ADLs
37
mechanisms are provided for the connectors [58]. In SysML and MARTE, generalization and refinement relationships are used to evolve a component or a system. To define architectural quality, TADL integrates the modeling of timing aspects in the architecture definition. EAST-ADL provides a QualityRequirement element as part of the requirements modeling and defines a set of quality attributes such as availability, confidentiality, performance, reliability, safety, and timing. However, there are no explicit associated constraints and semantics. QualityRequirement element is used to represent a non-functional or quality requirement. In SysML, quality models are not part of the language, but supported by the tool vendors. MARTE enables modeling of quality in use characteristics which are related to outcomes of interactions with a system [115]. This is supported by the non-functional properties (NFPs) modeling and analysis modeling like quantitative analysis modeling, schedulability analysis modeling, and performance analysis modeling. Adaptability in automotive domain of these languages takes place mostly in academic settings, with the exception of SysML and MARTE, which have the support of commercial tool vendors tackling automotive modeling cases. Definition of the UML profile of the EAST-ADL enables UML tool vendors to support it, however, the support is limited. OSATE, TOPCASED, and STOOD toolsets are available to model in AADL. There are no specific tools available for AML and TADL. Regarding usability, the ease of use and understandability by automotive domain experts was examined. For languages such as EAST-ADL, TADL, SysML, and MARTE UML-inspired graphical notations are available. It was observed that automotive engineers, in particular mechanical engineers, hardware developers, and process experts prefer proprietary modeling approaches [94]. Regarding the language maturity, language specifications of automotive modeling languages except AML have been adapted and revised in the past several years. The EAST-ADL language specification v1.0 was issued in 2004 and subsequently revised in 2008, 2010, and 2013. The latest EAST-ADL version is v2.1.2. The SAE AADL Standard AS5506 was issued in 2004, AS5506A revised in 2009, SAE AADL Annexes AS5506/2 issued in 2011. TADL specification version 1.0 was issued in 2007 and version 2.0 in 2009. SysML specification 1.0 was adapted in 2006, v1.1 in 2008, v1.2 was issued in 2010. The differences between the subsequent versions of the SysML specification significantly more limited compared to other languages, i.e. the SysML specification remains more stable. MARTE specification version 1.0 was adapted in 2009 and version 1.1 was developed in 2011. AADL, SysML, and MARTE have mature and accessible tool support. Specifically, SysML tool vendors provide mature tools for architecture modeling of automotive systems.
3.3.2
Discussion
In Section 2.2.1, a number of ADLs, namely EAST-ADL, AADL, TADL, AML, SysML, and MARTE, were discussed. In Section 3.3.1, these ADLs were evaluated based on the automotive specific modeling requirements. The modeling requirements discussed in Section 3.2 were defined based on a series of interviews with automotive architects. Tracing requirements at the OEM and supplier sites is considered one of the most important modeling features. Therefore, regarding the requirements traceability between multiple architecture views and the requirements modeling capability of EASTADL, TADL, and SysML are considered valuable by automotive architects and engineers. Regarding the architecture modeling needs, namely integrated multi-level modeling, modeling hierarchical elements, mapping between architectural entities,
38
Automotive Architecture Modeling
all surveyed ADLs provide mechanisms to a certain extent. All ADLs except AML have a support of evolution mechanism. Defining architectural quality is the only requirement, which has limited support of the ADLs. Although EAST-ADL, AADL, TADL, and AML may seem favorable with respect to adaptability in the automotive domain and usability modeling requirements, their lack of application in real-world automotive systems and tooling make it less usable. However, regarding graphical notation of architecture modeling, proprietary modeling approaches are preferred compared to UML-inspired languages. Regarding language maturity, all the ADLs except AML have been revised in the past several years. However, AADL, SysML, and MARTE have a mature and accessible tool support. Based on the evaluation, SysML was selected as the language that best fit the modeling requirements. Accessibility, applicable language specification and tool support also played a significant role in this selection. In the next section, a case study is carried out on the usability of SysML diagram types. In addition, the benefits and disadvantages of the features from the perspective of automotive domain are discussed.
3.4
Modeling Automotive Systems in SysML
SysML was selected as a suitable language to model automotive systems based on the initial evaluation of automotive ADLs in Section 3.3. In this section, a case study was carried out to evaluate the usability of SysML diagram types for automotive architecture modeling by analyzing the similarity to the proprietary approaches. Although it is well-known in the software engineering world that the graphical notation of SysML is similar to UML, it is not necessarily known in the automotive world. Furthermore, over the past few years, the usability of nine SysML diagram types has been evaluated for the automotive architecture modeling by practitioners. Although the number of diagram types are fewer than 15 diagram types of UML, there are still advantages and disadvantages of the remaining diagram types. Therefore, in this case study, the applicability of SysML diagram types will be shown and compared to a proprietary architecture modeling approach. Note that every automotive company may have specific modeling needs and approaches that have been considered valuable by one company are not necessarily so for another company. For this purpose, an example automotive system in SysML was modeled and the automotive domain experts, who had been interviewed to elicit modeling requirements, were asked to evaluate it [53]. The automotive system is modeled based on the existing architectural models and documents using all nine SysML diagram types and IBM Rational Rhapsody, a commercial modeling tool. Due to confidentiality reasons we present part of the automotive system models. The SysML diagrams have been reviewed by the automotive domain experts and the suitable diagram types for architecture modeling were selected. The evaluation process involved five senior ar- Figure 3.2: Example cruise control switches (the right two switches).
3.4. Modeling Automotive Systems in SysML
39
chitects, who are responsible for modeling automotive software within one OEM at different architectural levels, ranging from functional architecture to Electrical/Electronic (E/E) architecture. All of the architects had a Master of Science (MSc) degree in mechanical or electrical engineering and had more than 10 years experience in the automotive domain. One architect had a PhD in mechanical engineering. The architects evaluated the usability of the SysML diagram types by indicating it as useful or not. The experts also provided the reasons for the scores they gave to the modeled system. In the first phase of the evaluation, the SysML models were selected with respect to their usability scores and rationale of the architects. The architects also met at the end of the evaluation to discuss the purpose and applicability of the model kinds at different architectural levels. The second iteration of the evaluation took place using the detailed SysML models and finalized the selection of the SysML diagram types. The result of the evaluation contributed to the pilot project, where the architecture modeling tool was selected by the industry partner. Therefore, experts commitment was ensured. Note the following discussion contains the summary of both evaluation phases. In the following subsections, the modeling is described, this is then compared to the respective modeling requirement defined in Section 3.2. The similarity to the proprietary technique is then discussed and finally the evaluation and decision by the experts is presented.
3.4.1
Requirement Diagram
Modeling description The SysML requirement diagram provides a modeling construct for text based requirements, and the relationship between requirements and other key modeling artifacts [176]. A requirement is related to other modeling artifacts via a set of stereotyped dependency relationships (e.g., «contain», «derive», «satisfy», and «trace»). For example, the «verify» dependency shows the link from a test case to the requirement(s) it verifies and the «refine» dependency is used to indicate that a SysML model element is a refinement of a textual requirement. A particular problem and a design decision can be, respectively, captured in the «problem» and «rationale» model elements. The requirements hierarchy and the relations between a requirement and any model element can be modeled by graphical and tabular representations. Note that the requirement diagram is not intended to replace external requirements management tools such as IBM Rational DOORS1 . Its main purpose is to increase traceability within SysML models. Relation to the modeling requirement One of the key requirements related to modeling issues is the MR-1: requirements traceability at multiple levels. A cruise control requirement diagram was constructed to illustrate requirements hierarchies using containment and derivation relationships and their relationships with other model elements at different levels using satisfaction, refinement, and trace relationships. The requirement diagram is intended to keep the requirements synchronized with the models. This enables traceability between requirements and system model elements, given that the requirements and their relationships are typically stored in the requirements specification documents or managed by the requirements management tools [85]. As discussed in the following section, its similarity to the proprietary technique, the proprietary trace mechanisms and requirements modeling make the requirements diagram adaptable and easy to use. 1 http://www-03.ibm.com/software/products/en/ratidoor
40
Automotive Architecture Modeling
Structure diagram
Block definition diagram
Internal block diagram
Package diagram Same as UML 2 Modified from UML 2
Parametric diagram
New diagram type
Figure 3.3: SysML Structure Diagrams. Thus, it satisfies the MR-7: adaptability in the automotive domain and MR-8: Usability requirements. Similarity to the proprietary technique Although there is no equivalent modeling of requirements in the proprietary modeling, the requirement traceability is enabled in the proprietary setting by indicating requirements’ identifiers at the function blocks. This is similar to the application of «trace» dependency between a requirement and the model element. Evaluation by the experts The graphical and tabular representations of the requirements hierarchy and the relationship between a requirement and any model element are considered very beneficial by automotive experts. The graphical representation makes it easy to trace which element satisfies and verifies the requirement and how the requirement influences other requirements. Also ambiguity of requirement diagrams is tackled by other models (e.g., activity and sequence diagrams) by refining it. A requirement or a relationship between requirements can have these elements associated with them. These were also considered valuable by the automotive architects, because important problems and decisions tend not to be documented explicitly. Discussion The requirement diagram was selected as an appropriate diagram. The tool features related to the requirement diagram vary between the different SysML tools. Hence, it is considered useful for the automotive domain experts to have the list of tool features which bring additional values for requirement modeling.
3.4.2
Structure Diagrams
The SysML structure diagrams address the structure of systems in terms of their hierarchy and interconnections [85]. Figure 3.3 shows the overview of the SysML structure diagrams: Block Definition Diagram (BDD), Internal Block Diagram (IBD), package diagram, and parametric diagram. The BDD and IDD are two different diagram types to represent the structure by formalizing the traditional systems engineering block diagrams [85]. A package diagram is same as a UML package diagram, which addresses the model organization. A parametric diagram is a new diagram type, which is used to create
3.4. Modeling Automotive Systems in SysML
41
systems of equations. Below the modeling of cruise control in these structural diagrams is discussed. 3.4.2.1
Block Definition Diagram
Modeling description The static structure of a system is shown in a SysML Block Definition Diagram (BDD). The SysML BDD is derived from UML2 class diagram. BDD’s are used to define “black-box” components called blocks with external interfaces, where the external interfaces can support both information flows (via standard ports and interfaces) and physical flows (via flow ports and flow specifications) [85]. The block is a basic structural element, which represents a modular unit of structure. A block may define a system, control function, hardware or software component, and any other conceptual entity. A block can have a structural relationship with another block using composition, association, and specialization relationships. Relation to the modeling requirement For the MR-2: integrated multi-level modeling requirement, different levels of proprietary architectural concepts of the system were mapped to the BDD elements and created the respective architectures in a BDD. Since
Figure 3.4: A Part of the Proprietary Functional Model for the Cruise Control System.
42
Automotive Architecture Modeling
bdd Cruise Control System
EngRunning
«block» Function Input
ActVehSpd CC_Fuel
«block» Output
«block» CC_Control_Logic
AccelPedValue CC_Enabled
CC_SetCommand CC_ResCommand
«block» Driver Input
CC_Active CC_OffCommand CC_IncrementCommand CC_DecrementCommand CC_SetSpd CC_AccelerateCommand CC_DecelerateCommand ManualBrk ParkBrkSwApplied PrimRetActivatedByStalk
Figure 3.5: A Part of the SysML Functional Model for the Cruise Control System. the block concept is generic, the architectural representation in the BDD is sufficient. The graphical notation of a block is adjusted to be similar to the domain-specific graphical notation of an architectural entity. Figure 3.5 illustrates the BDD of a cruise control in a graphical notation familiar to the architects. The nature of the block concept enables the MR-3: modeling hierarchical elements requirement. Because of its flexibility to adjust following the proprietary graphical representations, the BDD satisfies the MR-7: adaptability in the automotive domain and MR-8: usability requirements. Similarity to the proprietary technique Architectural models at different architectural levels are created in BDD. Figure 3.4 shows a part of the proprietary high-level structural diagram. For readability and confidentiality reasons, the model is simplified and only a part of the model is shown. The comparable SysML BDD model is illustrated in Figure 3.5. MATLAB, Simulink, and Stateflow seem to have become common approaches to develop embedded software system in the automotive industry. Hence, translating BDD concepts originated from object-oriented programming into concepts closer to the current software development methods, facilitates the evaluation process. Evaluation by the experts The BDD was considered to be an appropriate structural modeling approach by the automotive experts. However, BDD concepts such as association, composition, and specialization, which are borrowed from the object-oriented programming needed further elaboration during the evaluation. In addition, a major shortcoming was the default graphical notation of a block, which shows the compartments separated by horizontal lines containing different members of the classifier as in the UML class notation. For example, a UML class is shown with three compartments; the first compartment holds the name of the class, the middle compartment holds a list of attributes and the bottom compartment holds a list of operations.
3.4. Modeling Automotive Systems in SysML
43
Discussion The Block Definition Diagram is considered useful by the architects, given that the graphical representation of the structural models can be adjusted to the automotive domain in addition to modeling a structure of model entities and their interrelationships. 3.4.2.2
Internal Block Diagram
Modeling Description A SysML Internal Block Diagram (IBD) describes the internal structure of a block in terms of its constituent parts and their connections. IBD’s are used to show the “white-box” perspective of block components, where connectors show how internal parts are “wired” to external interfaces and each other. SysML IBD is derived from UML2 Composite Structure diagram. The part or part property defines a set of instances that belong to an instance of the composite block [85]. A block’s interaction point is called a port. Relation to the modeling requirement The composite architectural concepts of the system were mapped to the IBD elements and the respective architecture was created in the internal block diagram. The instantiation of the blocks in the BDD as parts of the IBD enabled the MR-2: integrated multi-level modeling and MR-3: modeling hierarchical elements requirements. Also, because of its flexibility to adjust the graphical representations and integrated multi-level modeling, the IBD satisfies the MR-7: adaptability in the automotive domain and MR-8: Usability requirements. Similarity to the proprietary technique Figure 3.6 shows a part of the proprietary internal structural diagram. There are several representations of the internal structure. Again for readability and confidentiality reasons, the model is simplified and only a part of is shown. The counterpart of the proprietary model in SysML IBD is illustrated in Figure 3.7. Evaluation by the experts A different graphical notation for the reference part by setting a dashed boundary in the IBD is considered valuable as it cuts across the tree
CC_Active
Input Arbitration
CC_Commands
CC Control Logic CC_SetSpd Vehicle Data
CC Speed Controller
CC_Fuel
Fuel Arbitration
Vehicle Data
Figure 3.6: A Part of the Proprietary Internal Structural Model for the Cruise Control System.
44
Automotive Architecture Modeling «block» Block2
«part»
«part»
«part»
«part»
: InputArbitration
: CC Control Logic
: CC Speed Controller
: Fuel Arbitration
CC_Commands CC_Active
CC_Fuel Vehicle Data
CC_SetSpd
Vehicle Data
Figure 3.7: The Internal block diagram of the Cruise Control System structure of a composition hierarchy and helps to emphasize the blocks from different architectural levels. Any change to the block type in a BDD can be propagated to the parts and referenced parts in the IBD. Therefore, it adds an additional value to the consistency between different architectural levels/views. Discussion Given that the integrated multi-level modeling and the modeling hierarchical elements are key to enabling consistent architectures at different levels, the IBD is also considered appropriate. 3.4.2.3
Package Diagram
Modeling Description The package is a fundamental unit of model organization [85]. A SysML package diagram is used to group modeling elements in a hierarchal structure. Packages are both containers and namespaces [85]. A namespace enables its elements to be uniquely identified within it. Figure 3.8 shows an example package diagram, which organizes a cruise control model with the SysML model structure. The cruise control model contains requirement, structural and behavioral models. Relation to the modeling requirement The hierarchal nature of the package concept enables the MR-3: modeling hierarchical elements requirement. Due to its similarity to the proprietary hierarchal concepts, the package diagram satisfies the MR-7: adaptability in the automotive domain and MR-8: usability requirements.
CruiseControl Model
Requirements Models
Structure Models
Behavior Models
Figure 3.8: A Cruise Control Package Diagram.
3.4. Modeling Automotive Systems in SysML
45
Similarity to the proprietary technique In proprietary modeling, there is a similar concept for a package concept. However, all the package diagram elements except dependency relationship and rationale element do not exist in the proprietary architecture modeling. Evaluation by the experts This grouping of elements in a hierarchical structure can be used for task allocation and system decomposition, therefore the package diagram was considered useful. The similar package concept already exists in the proprietary modeling approach, which made it easy to adapt by the domain experts. Discussion The package diagram was selected as a beneficial diagram type. 3.4.2.4
Parametric Diagram
Modeling Description A SysML parametric diagram represents constraints or equations on property values [85]. It supports engineering analysis such as performance, reliability, and safety analysis and enables integration of engineering analysis with design models. IBM Rational Rhapsody [109](version 7.5.2 or later) can perform constraintrelated calculations with the Parametric Constraint Evaluator, which interfaces with computer algebra systems such as Maxima2 and MATLAB. 2 http://sourceforge.net/projects/maxima/
bdd PowerFlow Analysis «constraint» ICEPowerEquation
«block» PowerFlow Analysis
constraints { Pem = Pm - Pd; }
constraints { Es = ∫ Ps × dt; }
parameters Pm : W{unit = watt} Pem : W{unit = watt} Pd : W{unit = watt} «constraint» ISGEquation constraints { Pe = Pem × ηsign(Pem); } 0< η 0: Generator mode Pem < 0: Motor mode parameters Pe : W{unit = watt} Pem : W{unit = watt}
«constraint» StoreEnergyEquation
parameters Es : W{unit = watt} Ps : W{unit = watt} t : {unit = second[s]} «constraint» BatteryPowerRequestEquation constraints { Pb = Pe - PL; } parameters Pb : W{unit = watt} Pe : W{unit = watt} PL : W{unit = watt}
«constraint» BatteryEfficiencyEquation constraints { Ps = Pb × ηsign(Pb); } 0< η 0: Charge Pb < 0: Discharge parameters Ps : W{unit = watt} Pb : W{unit = watt}
Figure 3.9: Defining Reusable Equations in BDD
46
Automotive Architecture Modeling
Relation to the modeling requirement An analysis model was built with reusable equations in the BDD and parametric diagrams were created. See Figure 3.9 and 3.10 respectively. The parametric diagram does not however support the MR-2: integrated multi-level modeling requirement, because it requires an independent computational engine to carry out the analysis. Similarity to the proprietary technique eling for parametric models.
There is no counterpart proprietary mod-
Evaluation by the experts Having a parametric model separate from the computational engine, which is provided by different analysis tool was considered not beneficial by the automotive experts. The syntax and semantics of parametric diagrams are ambiguous, thus it needs to be integrated with other simulation and analysis modeling tools such as Modelica to support the execution of the parametric models [179]. Discussion The parametric diagram type was not selected by the automotive experts because the use of the diagram was not considered beneficial. Furthermore, to execute the parametric diagram, another tool needs to be integrated. Thus it is costly to apply and integrate extra tools.
3.4.3
Behavior Diagrams
In this section, the behavioral diagrams of the cruise control system are discussed. Figure 3.11 shows the behavior diagrams.
Power Demand
par PowerFlow Analysis
Pd
{ Pem = Pm - Pd; } «block» Requested ICE Power
Pm
Pm
Pd ICEPowerEquation { Pb = Pe - PL; }
Pem
Pe
ISGEquation
PL Pe BatteryPowerRequestEquation Pb Pb BatteryEfficiencyEquation
{Pe = Pem × ηsign(Pem); } { Ps = Pb × η
sign(Pb)
;}
Ps
Ps StoreEnergyEquation { Es = ∫ Ps × dt; }
Es Es
«block» BatterStoreEnergy
Figure 3.10: PowerFlow Parametric Diagram
PL
«block» Auxiliary component (e.g. electric pump, fan, steering pump, air conditioner)
3.4. Modeling Automotive Systems in SysML
47
Behavior diagram
Use Case diagram
Sequence diagram
State machine diagram
Activity diagram
Same as UML 2 Modified from UML 2
Figure 3.11: SysML Behavior Diagrams 3.4.3.1
Use Case Diagram
Modeling Description Use case diagram is a type of behavioral diagram, which describes the functionality of a system in terms of how its users use that system to achieve their goal. The users are described by actors, which represent either external systems or humans who use the system. A use case represents externally visible behavior of a system and can be elaborated in other behavioral diagrams such as activity and sequence diagrams to describe detailed scenarios [85]. The Rational Unified Process (RUP) is a popular methodology to develop a system in use case-driven way [132]. It enables the development activities to be traceable back to the use cases as defined in agreement with the user or customer. Relation to the modeling requirement Driver’s use cases of the automotive system were modeled. Use cases have a textual and graphical description that may be elaborated further with detailed descriptions of their behavior using activity, interaction or state machine diagrams. Main use cases are detailed in an activity and sequence diagrams. Note that use cases focus on functional requirements exclusively. Use cases can be elaborated in other behavioral diagrams, which supports MR-2: integrated multi-level modeling requirement. Use case diagram satisfies the MR-7: adaptability in the automotive domain requirement, because it can be adapted to elicit the functional requirements based on the use case analysis approach. Similarity to the proprietary technique There is no comparable use case diagram in the proprietary architecture modeling, since functional requirements are not explicitly captured using use case analysis. However, there are signs of a need for modeling user interaction with the system as shown in a requirements document. It illustrates a driver interaction with the vehicle and dependency with other functions. Use cases are captured in textual format in the requirements document. Evaluation by the experts Use case diagrams were created based on the driver’s use cases and these were then detailed in activity or sequence diagrams. However, the use case analysis approach differs from the proprietary way of functional requirements elicitation.
48
Automotive Architecture Modeling
Discussion The use case diagram type was not selected, although it could be useful for traceability. The main reason was that the functional requirements are currently not explicitly captured using use-case analysis approach. 3.4.3.2
Activity Diagram
Modeling Description Activity diagram uses an activity concept, which is a formalism for describing behavior that specifies the transformation of inputs to outputs through a controlled sequence of actions [85]. Actions are the building blocks of activities and describe how activities are executed. Each action can accept inputs and produce outputs, which are called tokens. Tokens can be information or a physical item e.g., fuel. Activity diagrams are graphical representations of the flow of inputs/outputs and control, including sequence and conditions for coordinating activities. The SysML activity diagram extended the UML activity diagram with support for continuous flow i.e., the SysML activity diagram has been extended to indicate flows among steps that convey physical matter (e.g., gasoline) or energy (e.g., torque, pressure). SysML is aligned with an enhanced functional flow block diagram. Additional changes allow the diagram to better support continuous behaviors and continuous data flows. Relation to the modeling requirement As mentioned previously, a number of activity diagrams were built elaborating driver’s use cases. In the activity diagrams, a set of activity nodes and actions are grouped into an activity partition to indicate responsibility for execution of those nodes. An allocate activity partition is a special type of partition that can be used to perform behavioral allocation. Activity diagrams enable MR-1: requirements traceability at multiple levels, namely requirements traceability to behavioral models. The hierarchal nature of the composite activity concept enables the MR-3: modeling hierarchical elements requirement. Furthermore, activity partitions (i.e., swimlanes) of the activity diagram fulfill the modeling requirement MR-4: mapping between architectural entities. When allocating functions to ECUs, explicit allocation of behavior to structure using swimlanes can enable the modeling requirement of the mapping between architectural entities. However, adaptability in the automotive domain requirement is not fulfilled because its UML-based graphical notation is considered not favorable. Similarity to the proprietary technique There is no comparable diagram in the proprietary modeling. Informal conceptual diagrams and textual descriptions are used for describing control behavior. Evaluation by the experts Activity diagrams are adapted from UML and there is no counterpart in automotive architecture modeling. SysML activity diagram is enhanced from UML activity diagram and lack of UML usage in automotive companies hinders the preference of this diagram type. Furthermore, in automotive architecture analysis, the lack of tool support to carry out simulation using activity diagram was considered not favorable. Discussion The activity diagram was not chosen, because the UML-based diagram was not easy to adapt for automotive architecture modeling.
3.4. Modeling Automotive Systems in SysML 3.4.3.3
49
Sequence Diagram
Modeling Description In SysML, behavior can also be represented in a sequence diagram. A sequence diagram represents the interaction between the structural elements of a block as a sequence of message exchanges [85]. The interaction can be between the system and its environment or between the components of a system at any level of a system hierarchy. A message can represent the invocation of a service on a system component or the sending of a signal. There are different types of messages such as synchronous messages where the sender waits for a response, and asynchronous messages where the sender continues without waiting for a response. Structural elements of a block are represented by lifelines (dashed vertical lines) on a sequence diagram. Relation to the modeling requirement An a set of sequence diagrams were created to show the interaction between the cruise control blocks. The sequence diagram supports the requirement MR-2: integrated multi-level modeling. However, adaptability in the automotive domain requirement is not fulfilled because its UML-based graphical notation is considered not favorable when representing complex scenarios. Although the sequence diagram is not used in the proprietary modeling approach, it satisfies the MR-7: adaptability in the automotive domain and MR-8: usability requirements especially due to its ability to model interactions. Similarity to the proprietary technique There is no comparable diagram in the proprietary modeling. Textual descriptions are used for describing complex scenarios. Evaluation by the experts Modeling complex scenarios and interactions in sequence diagrams is considered useful especially by the E/E architect, because it could be used to model the synchronous and asynchronous communication between items such as ECUs. Discussion The sequence diagram was selected as a useful diagram type for modeling interactions. 3.4.3.4
State Machine Diagram
Modeling Description State machine diagram was also used to model the behavior of a system. SysML state machine is same as UML statechart, which is an object-based variant of Harel statechart adapted and extended by UML. Relation to the modeling requirement A high level state machine diagram was created for the cruise control system, which is same as the MATLAB Stateflow diagram. MR-2: integrated multi-level modeling requirement is supported by the stateflow diagram as other SysML diagram types. A composite state concept enables the MR-3: modeling hierarchical elements requirement. In addition, MR-7: adaptability in the automotive domain and MR-8: usability requirements are fulfilled because behavioral modeling in stateflow is broadly applied in automotive industry. Similarity to the proprietary technique State diagrams are used broadly to implement behavior in proprietary architecture modeling. Mostly MATLAB Stateflow diagrams are used.
50
Automotive Architecture Modeling Table 3.2: Modeling requirements and SysML diagram types
Modeling requirements MR-1. Requirements traceability at multiple levels MR-2. Integrated multi-level modeling MR-3. Modeling hierarchical elements MR-4. Mapping between architectural entities MR-5. Support of evolution MR-6. Determining architectural quality MR-7. Adaptability in the automotive domain MR-8. Usability MR-9. Language maturity MR-10. Mature and accessible tool support
Req.D
BDD
IBD
PD
Par.D
UC
AD
SD
SM
[3.4.1]
[3.4.2.1]
[3.4.2.2]
[3.4.2.3]
[3.4.2.4]
[3.4.3.1]
[3.4.3.2]
[3.4.3.3]
[3.4.3.4]
X
X
X
X X
X
X
X
X
X
X
X
X
X X
X
X
X
X
X
X
X
X
X
X
X
X
X
X X
Evaluation by the experts Due to the popular usage of the MATLAB Stateflow, SysML state machine diagram is considered easy to apply. However, there was a discussion about choosing between SysML state machine diagram and MATLAB Stateflow diagram types. Discussion State machine diagram type was selected, because the MATLAB Stateflow is widely used to implement behavior and is considered beneficial to enable behavioral modeling in the architecture modeling phase. However, as the MATLAB Simulink and Stateflow charts are broadly used in automotive industry, the selection between SysML state machine diagram and MATLAB Stateflow charts needs further analysis.
3.4.4
Summary
Based on the evaluation of SysML modeling of the cruise control system, the following SysML diagrams were identified as beneficial by the stakeholders: requirement diagram, block definition diagram, internal block diagram, package diagram, sequence diagram and state machine diagram. The main reasons for selecting these diagrams are explicit architecture modeling needs and similarity to proprietary modeling approach. Other reasons included usability, applicability and understandability by domain experts. As summarized in Section 3.2, SysML diagrams satisfy the modeling requirements (except the MR-6. Determining architectural quality requirement as other automotive ADLs). However, the behavioral diagrams, except the state machine diagram type, need further adjustment to make them usable in automotive domain. For MR-5. Support of evolution requirement, SysML generalization and refinement relationships are used to evolve a component or system. With respect to MR-9. Language maturity and MR-10. Mature and accessible tool support modeling requirements, the SysML diagram types and tool support for the diagram types mature as discussed in Section 3.3.1. The selection of these diagram types are in alignment with other modeling case studies of SysML of automotive systems e.g., driver information system [187] and [16] as discussed in the previous section.
3.4. Modeling Automotive Systems in SysML
3.4.5
51
Related Work
In an automotive industrial case study on the systems modeling for premium vehicle [187], a driver information system was modeled in SysML version 0.9 using the OEM’s requirements specification document. Use case diagrams, assembly diagrams (an internal block diagram in SysML version 1.2) and sequence diagrams are selected as appropriate diagrams [187]. The developed models are evaluated based on the regular discussions with OEM system engineers and other stakeholders. Relevant elements of SysML language for the OEM are identified by the representatives of OEM, suppliers and the international automotive research center, UK [187]. In addition to system modeling, the integrated usage of SysML requirements diagram, use case diagram, and sequence diagram was considered valuable. Specifically, requirements diagrams can specify the textual requirements, use case diagram can depict the use cases satisfying those requirements, and the requirements and use cases can be linked to other diagrams such as sequence diagrams which can be used to verify those requirements. The time the tooling for requirements modeling was limited, therefore the requirements diagram was not used. To facilitate the increasing supplierOEM collaboration to develop systems, SysML was considered beneficial to capture and communicate system requirements in a systematic way [187]. However, stability and maturity of the SysML language was required. In this case study, the main focus was to capture and communicate effectively system requirements. The choice of diagrams appears to be more related to system and requirements modeling. SysML was used on pilot projects to meet the needs of an automotive supplier’s product lines [16]. For confidentiality and understandability reasons, the selected SysML diagrams were extracted from tutorial examples on modeling a hybrid vehicle. SysML block definition diagrams, internal block diagrams, use case diagram, sequence diagrams, state machine diagrams, activity diagrams, and requirements diagrams are selected based on the pilot projects. The selected SysML diagram types were mapped to the phases of the system engineering process [16]: • Definition of stakeholder phase needs a Requirements Diagram (RD), a Block Definition Diagram (BDD), a Use Case Diagram (UCD), a State Machine Diagram (SMD), and a Sequence Diagram (SD). The RD is needed to illustrate identified stakeholder needs and trace the requirements. The BDD is selected to model operational context diagram. The SMD is used to model user modes identification. The UCD and SD are used to represent use cases. • Requirements analysis phase needs an Internal Block Diagram (IBD), SMD, and SD. The IBD is used to describe the system interface. The SMD is used to describe the identified system states. The SD is used to refine user level scenarios in order to identify system services. • Logical architecture design phase needs a BDD, Activity Diagram (AD), and IBD. A BDD is used to describe a functional architecture. An IBD is used to describe the interaction flows between the internal logical blocks. An AD illustrates the internal behavior of system block operations. • Physical architecture design phase needs a BDD, IBD, and SD. The BDD is used to describe a physical architecture. The IBD is used capture the interaction flows between the internal physical blocks. It was concluded that using SysML in a system engineering process improved the weak practices e.g., a use case driven approach helped understand the problem instead of
52
Automotive Architecture Modeling
focusing on solutions first. Since automotive software engineering is multi-disciplinary e.g., covering system, software, hardware, and mechanics disciplines, customizing an SysML tool for the automotive domain is considered crucial. Interfacing with safety analysis tools to comply with safety standards such as ISO26262, behavior simulation tools e.g., MATLAB Simulink and Stateflow, and AUTOSAR authoring tools are also expected from a SysML tool. The result of the automotive supplier’s pilot projects concluded that SysML provides a promising solution for automotive ontology, however further improvements are needed [16]. SysML was used as one of the Architecture Description Languages (ADL) for automotive system development [215]. For detailed modeling steps, an Adaptive Cruise Control system was modeled. The SysML Internal Block Diagram (IBD) was used to model a system architecture. However, the other SysML diagram types are not discussed in this case study. The objective of the study was to compare different ADLs to model architectural aspects of automotive systems. For prototyping an embedded automotive system, SysML was used to represent highlevel models and to integrate with other languages [20]. SysML requirements diagrams are used to capture system requirements. SysML Block Definition Diagrams are used to model the general structure of the system. Internal Block Diagrams are used to represent the internal structure of the blocks in detail. The system behavior is described using state machine, sequence, and activity diagrams. Although SysML parametric diagrams are not directly used, it was the base of the TEPE, a property language. TEPE is used to express properties in terms of logical and temporal relations between system events and attributes [20]. SysML was considered useful to model system architecture and its behavior. Different SysML profiles are developed to support the conceptual stages of the prototyping method. The selection of the SysML diagram types of these case studies is in alignment with the result of our research. SysML is considered a promising solution for the automotive domain, the support of (tool) integration with other tools (e.g., safety and security analysis tools, AUTOSAR authoring tool, MATLAB Simulink and Stateflow, and formal analysis tool).
3.5
Conclusion
As 50-70% of the development costs of the electronics and software systems is attributed to software development, automotive companies recognize ADLs as one of the most appropriate solutions to reduce development costs and increase the quality of software. Architecture description technologies were evaluated, including EAST-ADL, TADL, AML (automotive specific), AADL (adapted from avionics), SysML and MARTE (generalpurpose). Furthermore, the advantages and drawbacks of applying SysML for a modeling automotive system were shared. IBM Rational Rhapsody was used for the case study to evaluate the usability of SysML diagram types for automotive architecture modeling by analyzing the similarity to the proprietary approaches. Although it is well-known in the software engineering world that the graphical notation of SysML is similar to UML, it is not necessarily known in the automotive world. In this case study, the automotive specific modeling requirements were checked against SysML language and tool features. The SysML diagram types which satisfy the modeling requirements were selected as suitable for modeling automotive architectural models, which were aligned with the selection of prior case studies on
3.5. Conclusion
53
different automotive systems [16, 20, 187, 215]. Although the reasons for selecting the same diagram types were not explicitly discussed in these case studies, the diagram types used to illustrate different automotive systems are the same except a sequence diagram type was used in the driver information system [187].
Chapter
4
Formalizing A Correspondence Rule for Automotive Architecture Views
Architecture views have long been defined in the software architecture field with an intention to systematically model complex systems by representing them from the perspective of corresponding stakeholder concerns. Different architecture views have been defined in the scope of automotive Architecture Frameworks (AFs) and Architecture Description Languages (ADLs). Therefore, we defined an Architecture Framework for Automotive Systems (AFAS) aligning the architecture viewpoints and views from existing automotive AFs and ADLs. Currently, a correspondence rule between architecture views has not been studied in the automotive domain. Therefore, in this chapter, we formalized a correspondence rule between the architecture views in the automotive domain. The formalized correspondence rule has been implemented as a Java plugin for IBM Rational Rhapsody and evaluated in a case study based on an Adaptive Cruise Control system.
4.1
Introduction
In the automotive industry, gradually more attention is being paid to architectural modeling to tackle the increasing complexity of automotive software systems and to maintain the system’s quality [166]. Typically, numerous architects create multiple models representing several views [76]. We have defined a set of architecture viewpoints and views as part of the Architecture Framework for Automotive Systems (AFAS) in Chapter 2. The scope of the current chapter is to formalize the refinement correspondence between AFAS structural views, in particular between functional and software views, to ensure consistency between the functional architecture and software architecture models. Throughout this chapter, we refer to a functional architecture and software architecture model as a Functional (FN) and Software (SW) model, respectively. Functional decomposition is carried out by an Original Equipment Manufacturer (OEM) and the functional models are delivered to a supplier, who refines the model in the software view and returns the functionality in the Electronic Control Unit (ECU). The
56
Formalizing A Correspondence Rule for Automotive Architecture Views Feature view System
ft1
ft2
ft3
Functional view fn1
fn6 fn4
fn2
fn7 fn3
fn5 fn8 sw1 sw4
ecu2
hw1
sw2 sw5
ecu1
ecu3
ecu4
sw3 Software view
Hardware view
Figure 4.1: An example illustration of AFAS view correspondences refinement is a transformation that takes a model from an abstract level to a more detailed level [76]. The refinement of the functionality in the software view may take several iterations e.g., the feedback to the functional model of the OEM or changes in the functional model may need to be propagated into the supplier’s software models. This process is currently document-centric, prone to errors, and cumbersome [92]. Documentation-centric collaboration may, however, result in software models that do not comply with the intention of the OEM as informally described in the functional model. A method is required to facilitate automated consistency checking between the functional and software models. Therefore, formalizing a correspondence rule between these views is a step towards a consistent multi-viewpoint architecture modeling [66]. According to the ISO 42010 international standard [116], a correspondence defines a relation between architecture description elements, which in the context of this thesis is called the architecture view. An architecture relation can include e.g., refinement, composition, consistency, and traceability [116]. Therefore, formalizing refinement correspondence rules between functional and software views checks whether or not the restrictions expressed by the rule are satisfied. This is also described as ensuring consistency. In Figure 4.1, an example correspondence between structural views of the AFAS is illustrated. A functional view consists of a functional architecture model that contains a number of functions or subsystems realizing vehicle features. A software view consists
4.1. Introduction
57
of a software architecture model, which refines the functions into software components or blocks. The relationship between software components and functions is illustrated in Figure 4.1. The functional view is governed by the functional viewpoint and both software and hardware views are governed by the implementation viewpoint as discussed in the AFAS framework, Section 2.4. Checking architectural consistency is used to ensure the information in several views is not conflicting [165]. For the software architecture community, consistency checking for architecture views and architectural models has been investigated vigorously [34, 129, 165, 196, 197]. Existing techniques for architecture consistency checking can be divided into two main categories. The first category concerns consistency checking techniques between the static architecture and the architecture extracted from the source code such as the software reflexion technique [164], the Bauhaus tool suite [19], and the clustering technique [18]. The second category relates to ensuring consistency between UML structural and behavioral diagrams (e.g., consistency between class, sequence, and statechart models) [42, 75, 76, 143, 165, 216]. Because UML is not broadly used in automotive architecture modeling and the relation between automotive architecture views is not explicitly addressed, we formalize the relation between structural models, namely functional and software models of the AFAS. Regarding the relation between views, we position our work using the classification framework in the following Section 4.1.1. Our objective is to formalize the relation by defining the correspondence and correspondence rules between automotive architecture views. The research question RQ2 is addressed in this chapter. RQ2 : How can we formalize the correspondence rules between automotive architecture viewpoints? Because OEMs and suppliers may use different Architecture Description Languages (ADLs) to represent architectural models, we apply a language-neutral consistency checking mechanism inspired by the Relation Partition Algebra (RPA) [80, 81, 131]. The languageneutral consistency checking mechanism will be discussed in more detail in Section 4.1.1.
4.1.1
Relations between views
This section positions our work using the classification framework presented in [30]. Relations between different views are crucial to ensure consistency and maintain the consistency over time [30]. However, research on relations between views in the software architecture field has been fragmented due to the lack of common concepts and terminology [30]. To avoid further fragmentation, we followed the criteria of relations between views and positioned our research as illustrated in Figure 4.2 by underlining the respective selection. According to Bouck´e et al. [30], the relations between views can be characterized into three main dimensions, namely Usage, Scope, and Mechanism. These dimensions further structure approaches as listed in Figure 4.2. We discuss below the mapping of our approach to these categories: • Usage: Relations between views can be used for four main purposes [30]: 1) Consistency checking determines if the information in several views is consistent; 2) Composition of views enables the integration of information from several views; 3) Tracing or trace relations spans a number of different architectural elements to enable consistency; and 4) Model transformation creates a model conforming to a
58
Formalizing A Correspondence Rule for Automotive Architecture Views
General-purpose consistency checking Consistency checking Usage
Composition
Design constraint checking Service composition consistency checking
Tracing Model transformation
Scope
Mechanism
Intra vs. Inter model type Level of detail Horizontal vs. Vertical Metamodel vs. Model Direct references Tuples Expression language
Figure 4.2: Categories of relations between views, derived from the relation categories [30] and extended with the mechanisms for Consistency Checking Usage. target metamodel from a model conforming to a source metamodel. Consistency checking is the usage that we focus on in this chapter. There can be different types of consistency checking namely general-purpose consistency checking, design constraint checking, and service composition consistency checking [30]. Generalpurpose consistency checking approaches check inconsistencies in requirements specifications, different views, and UML diagrams. The design constraint checking approaches use a language to express and control design constraints to restrict the architectural and design evolution. The service composition consistency checking approach provides static verification of a web service composition. Our approach falls into the category of the general-purpose consistency checking type for checking consistency between different views. • Scope: The scope criterion defines the range of view relations: 1) Intra vs. Inter model type. A model type or a model kind defines the conventions for one type of architecture model [116] e.g., UML structural and behavioral diagram types. Intra model type relations refer to relations between the same type of models. Inter model type relations refer to relations between different types of models. 2) Level of detail covers relations between complete views, models, and between elements inside the same views; 3) Horizontal vs. Vertical relations. Horizontal relations refer to relations between views at the same level of abstraction. Vertical relations are either relations between views at different levels of abstraction (such as refinements) or relations with other representations such as requirements, detailed design or even implementation; 4) Metamodel vs. Model. A metamodel is an explicit model of the constructs and rules used to build specific models within a domain of interest [30]. This scope addresses if a model in a domain of interest conforms to the metamodel. From the four view relations, our scope falls into the combination of the first and fourth category. Specifically, we focus on the vertical relations between the same type of models at different abstraction levels i.e., consistency checking between
4.2. Architectural Notations
59
higher-level functional model and the lower-level software model (e.g., refinement relation). • Mechanism: The third dimension of the framework in Figure 4.2 categorizes mechanisms that describe relations between views: 1) Direct references mean elements from one view can refer directly to elements of another view; 2) Tuples are used to model relations in a form of mapping; 3) Expression language defines which expressions are well-formed, and therefore can be used and meaningfully interpreted [30]. As mentioned before, we apply a language-neutral consistency checking mechanism inspired by the RPA. Our approach is an application of the generalized consistency checking between software views in [34, 165]. The consistency rules are defined to take on the informal semantics of architectural consistency and to match most closely what automotive software architects expect. This is achieved primarily through considering examples and building a definition of refinement correspondence based upon these rules. Then, formal definitions for consistency and a consistency-checking algorithm is formulated which is implemented in an automated tool. The second contribution of this research is a prototype consistencychecking tool in the form of an IBM Rational Rhapsody plugin. We evaluated our consistency checking method and tool by emulating an OEM and a supplier. The “OEM” created a functional architecture model for a truck and submitted a functional model of the Adaptive Cruise Control (ACC) to the “supplier”. The “supplier” refined the functional model to a software model and created a running ACC prototype. Although the ACC subsystem works correctly according to the OEM functional model, by using our tool we identified that the ACC software model created by the “supplier” was inconsistent with the functional model provided by the “OEM”.
4.1.2
Chapter outline
The remainder of the chapter is structured as follows. Section 4.2 introduces basic notations. Section 4.3 presents the approach by describing the correspondence rule between the functional and software views, the consistency semantics and definitions. Section 4.4 covers the tool development. We evaluate the approach in Section 4.5 and discuss related work in Section 4.6. Finally, Section 4.7 summarizes our contributions and discusses directions for future work.
4.2
Architectural Notations
This section serves as the introduction to the main notations that are used throughout this chapter. We use SysML as graphical notation and a textual notation inspired by RPA to describe the architecture in textual format.
4.2.1
Graphical Notation
For the graphical notation of functional and software models, we use a block definition diagram (BDD) of the Systems Modeling Language (SysML). SysML is a general purpose graphical modeling language used to represent systems in system engineering [176]. Although SysML is discussed in the scope of the automotive ADL evaluation in Chapter 3, we elaborate below on the main concepts of the BDD.
60
Formalizing A Correspondence Rule for Automotive Architecture Views
Legend: S
Composition Dependency A
A1
B
A2
B1
B2
Figure 4.3: SysML BDD example. SysML uses the concept of blocks to specify hierarchies and interconnections within a system design. The block is a general purpose hierarchical structuring mechanism and can represent any level of the system hierarchy (e.g., top-level system, a subsystem, or logical or physical component of a system or environment, and function block). A BDD describes relationships between blocks such as composition and dependency. A composition describes a whole-part hierarchy, where the composite is existentially responsible for its parts [240] e.g., a system is composed of subsystems or components. The composition relationship is illustrated by a solid diamond. In Figure 4.3, an example BDD diagram illustrates a system S, which is composed of A and B blocks. A is composed of A1 and A2 blocks and B is composed of B1 and B2 blocks. A dependency is a relationship between two elements e.g., blocks, which indicates that a change on one end of the dependency may result in a change in the element on the other end of the dependency [85]. A dependency is denoted as a dashed line with an open arrow pointing from the dependent (called also a client) to the dependee (called also a supplier). For example, in Figure 4.3, a block A1 depends on B1 and B2 , which indicates that a change in B1 and B2 may result in a change in the A1 . Early in the modeling phase, dependencies are often used to specify a relationship that can be replaced or refined [85]. In the context of this chapter, the dependency relation between functions in a functional model is the same as a dependency relation between software blocks in a software model.
4.2.2
Textual Notation
The textual notation of functional and software models and the notation used to express rules between architecture views is inspired by approaches based on Relation Partition Algebra (RPA) [34,131,165]. RPA formalized descriptions of (parts of) software architectures and it is based on sets and binary relations [131]. A set is a collection of objects (elements or members) and a relation is a special sort of set i.e., represents a set of pairs. For example, system S in Figure 4.3 can be expressed as S = {A, B}, A = {A1 , A2 }, and B = {B1 , B2 }. A binary relation or a relation, from X to Y is a subset of the Cartesian product
4.3. Architecture Correspondence
Correspondence
61
governs 1..*
0..*
Correspondence Rule
relates 2..*
AD Element
Figure 4.4: AD elements and correspondences [116]. X × Y , a set of tuples hx, yi where x ∈ X and y ∈ Y . Binary relations can be used to express the relationships between model entities. In addition to a tuple notation, hx, yi, we apply a prefix notation denoted by R(x, y) to refer to an element of a binary relation. In the following example, we illustrate the SysML composition and dependency relations as representatives of a binary relation. For example, compositions in Figure 4.3 can be denoted as comp(S, A), comp(S, B), comp(A, A1 ), comp(A, A2 ), comp(B, B1 ), and comp(B, B2 ) and dependency relations can be denoted as dep(A1 , B1 ), dep(A1 , B2 ), dep(B2 , A2 ), and dep(B1 , B2 ) respectively. The composition relation is the reverse of the part-of relation and the dependency relation is the same as the uses relation of RPA [131]. In the next section, we discuss the architecture consistency process and a correspondence rule between architecture views.
4.3
Architecture Correspondence
In this section we define the notion of correspondence and correspondence rules between functional and software views with the purpose of expressing and checking consistency among these views. We illustrate and formalize the consistency checking approach. In the ISO-42010 standard [116], a correspondence defines a relation between architecture description (AD) elements, which in the context of this thesis is called the architecture view. Correspondences can be governed by correspondence rules as depicted in Figure 4.4. Although the ISO-42010 standard does not specify a format for correspondences, they can be defined as relations and tables [77]. We revised the architecture consistency checking approach, which separates architect and developer roles [198]. As illustrated in Figure 4.5, the role of consistency checking is clarified among the automotive architects to ensure architectural consistency at different architecture views. In this approach, systematic checks of architectural consistency in the system architecture are made explicit. In Figure 4.5, functional and software architectural models are created and modified by the respective architects. If a violation is detected after checking consistency rules for respective views, an action is required from the architects to mitigate the conflicts.
4.3.1
Correspondence Rule
Consider the following example. Let S be a system and let FN(S) and SW(S) be the functional view of S and the software view of S, respectively. Given that FN(S) includes functional components, f n1 , . . . , f nn and SW(S) has software components, sw1 , . . . , swr ,
62
Formalizing A Correspondence Rule for Automotive Architecture Views
a correspondence expressing which functional components are refined by which software components is specified by a software architect. Refinement is a transformation that takes a model from an abstract level to a more detailed level [76]. Thus, the correspondence rule for the refinement correspondence between functional and software views is: Rule: Every functional component, fn, defined by the functional view FN(S), needs to be refined in one or more software components, sw, as defined by the software view SW(S) of a system S. The correspondence rule for an example model in Figure 4.6 implies that A, B, and C in SW view refine A, B, and C in FN view respectively. To perform the consistency check between these views, it suffices to lift the SW model into a model with the same level of abstraction as the FN model (cf. the lifted model (LM) in Figure 4.6). For example, dep(A, B) is present in LM since dep(A1 , B1 ) is present in the SW, comp(A, A1 ) and comp(B, B1 ). Lifting abstracts from the details inserted by the refinement, leaving only information relevant for comparison with the FN. Although the lifting notion is inspired by the lifting of the Relation Partition Algebra (RPA) [81], the lifting notion that we define has different semantics. To distinguish from the well-known lifting notion of the part-of relation in the RPA, we use the term R-Lifting (Relation-Lifting) in this chapter. In terms of static models, this requires that for every entity present in the high-level FN model, the relationship present in the low-level SW model must be derived. The FN model can then be directly compared with the lifted model. Possible inconsistencies are relations which exist in the FN model but not in the lifted model, or relations which exist in the lifted model but not in the FN model. These inconsistencies are referred to as absences and divergences. In Figure 4.6, an example absence relation is a relation between B and C in FN, which is absent in the lifted model and example divergence relations are a dependency relation from B to A and A to C, which do not exist in FN. FN Architect
Consistency Checker
Create Architecture
SW Architect Create Architecture
Consistency check Alter Architecture
[action required]
[violations detected]
Notify FN Architect
Notify SW Architect
Alter Architecture
[action required]
Figure 4.5: Architecture consistency checking approach.
4.3. Architecture Correspondence
63
LM
FN
A
A
B
absence relation
C
B
«refines»
«lifts»
C
divergence relations
SW
A
A1
A2
B
B1
C
B2
C1
Figure 4.6: Illustration of refinement correspondence (SW refines FN) and example inconsistent relations (absence and divergence relations). LM denotes the Lifted Model.
4.3.2
Consistency by Example
Since both the FN and SW views are representing the same system, inconsistencies can arise. For instance, a dependency between two components in the FN model may be inadvertently omitted in a refined SW model. Because automotive ADLs do not have formal semantics defined, there is ambiguity around what is actually considered consistent [93]. Therefore, in this section we illustrate refinement examples derived from the automotive architecture modeling practice. Figure 4.7 depicts two similar functional models in SysML, each with two possible software refinements. Figure 4.7a shows a functional model with a dependency relation. In the left-hand refinement of Figure 4.7a, a wrapper entity (LightingSystem) was
64
Formalizing A Correspondence Rule for Automotive Architecture Views
FN
Driveline
BrakeLights
«refines» SW
«refines» SW
Driveline
LightingSystem
Driveline
BrakeLights
LightingSystem
BrakeLights
(a) Consistent dependency refinements
FN
Driveline
BrakeLights
«refines» SW
«refines» SW
Driveline
LightingSystem
Driveline
BrakeLights
LightingSystem
BrakeLights
(b) Inconsistent composition refinements
Figure 4.7: Semantic differences between dependency and composition refinements inserted. Semantically this still indicates that Driveline makes an (indirect) call to BrakeLights. Therefore the derived relationship between Driveline and BrakeLights is a dependency relationship, and should be considered consistent with the functional model. In the right-hand refinement, the entity DriveLine was refined to specify that in fact a child entity LightingSystem makes a call to BrakeLights. In this case clearly the derived relationship is again a dependency. Therefore, regardless of whether
4.3. Architecture Correspondence
65
the dependency relationship preceded the derived relationship, when combined with composition it was still semantically a dependency. In Figure 4.7b, the same refinements are now refining a composition relation in the functional model. However, an automotive architect would not consider the proposed refinement to be consistent, because splitting up a composite entity into two entities which communicate via function calls was not intended by the architect. Therefore, applying the relation ordering (which again derives only implicit dependencies in the refinements), correctly yields an inconsistency. It is essential to note however that the high-level model must be taken into account when performing the R-Lifting operation on the low-level model. In the next sub-section, we formalize this consistency checking approach.
4.3.3
Consistency Definition
Let S be an automotive system, FN and SW be the functional model and the software model of S, respectively. Since every functional component needs to be refined in one or more software components (cf. Section 4.3), we assume FN ⊆ SW. Furthermore, we assume that there are families of relations, namely composition (comp) and dependency g ⊆ SW × SW such that comp or dep on the FN (dep), comp, dep ⊆ FN × FN and comp, ] dep g on the SW view. The following property view has its corresponding relation comp ] or dep should hold for the composition relation: The composition relation does not allow multiple parent entities i.e., for any A, B, C ∈ SW, comp(A, ] C) ∧ comp(B, ] C) ⇒ A = B. In Equation 4.1, we define a R-Lifting operation on the composition relation between ↑ two model entities from FN view, denoted comp ] (A, B). When R-Lifting a composition relation, the intermediate entities in the SW view should be connected only via composition relations. ↑
+
comp ] (A, B) ⇔ comp ] (A, B)
(4.1)
+
where comp ] (A, B) is the transitive closure of comp(A, ] B). The transitive closure of a S∞ relation rel, denoted by rel+ , is defined as rel+ = i=1 reli , i.e., the union of all reli . reli is defined as reli−1 × rel for i > 1 and rel1 = rel. Example 1 We demonstrate the R-Lifting operation as defined by Equation 4.1, by considering the left- and right-hand refinement models of the FN ↑ in Figure 4.7b. For both refinement models, comp ] (Driveline, BrakeLights) g g does not hold, because of dep(Driveline, LightingSystem) and dep(LightingSystem, BrakeLights) in the left- and right-hand models respectively. � In the Equation 4.2, we define a R-Lifting operation on the dependency relation between ↑ g (A, B). When R-Lifting a dependency two model entities from FN view, denoted dep relation, the intermediary entities in the SW view should be connected via at least one dependency relation. This definition states that A and B are related, if there is an entity C in the SW, which is contained in A or contains A, and there is an entity D in the SW, g which is contained in B or contains B such that C and D are related with dep. � ↑ ∗ ∗ g (A, B) ⇔ ∃C, D ∈ SW · comp dep ] (A, C) ∨ comp ] (C, A) ∧ � ∗ ∗ g comp ] (B, D) ∨ comp ] (D, B) ∧ dep(C, D)
(4.2)
66
Formalizing A Correspondence Rule for Automotive Architecture Views
FN
Driveline
EnergySystem
LightinSystem
«refines» SW
«refines» SW
Driveline
EnergySystem
LightinSystem
Driveline
EnergySystem
LightinSystem
Figure 4.8: Inadequacy of using full transitive closure to extract relations in refinements ∗
where comp ] (A, C) is the reflexive transitive closure of comp(A, ] C). The reflexive transitive closure of a relation rel, denoted by rel∗ , is defined as rel∗ = Id ∪ rel+ , where Id is the identity relation. Example 2 To demonstrate the R-Lifting operation as defined by Equation 4.2, we consider the left- and right-hand refinement models of the FN in ↑ g (Driveline, BrakeLights), Figure 4.7a. For the left-hand model, we have dep since we can select C = Driveline and D = LightingSystem, because ∗ ∗ comp ] (DriveLine, DriveLine), comp ] (LightingSystem, BrakeLights), and g dep(Driveline, LightingSystem). For the right-hand model, we have ↑ g dep (Driveline, BrakeLights) as well, since we can select C = LightingSys∗ tem and D = BrakeLights, because comp ] (DriveLine, LightingSystem), ∗ g (LightingSystem, BrakeLights) comp ] (BrakeLights, BrakeLights), and dep relations. � Observe that the dependency relation could not have been lifted in the same way as the composition, i.e., Equation 4.2 could not have been simplified in the same way as Equation 4.1. Indeed, the transitive closure in composition simply extracts all implicit relationships between all elements in the software model, and then performs a comparison with the functional model. For dependencies, however, this approach would yield erroneous results as illustrated in Figure 4.8. The two software models cannot be distinguished by the transitive closure. While it is clear that the left-hand refinement should be consistent with the functional model, the right-hand refinement should not, because the refinement is violating the strict layering specified by the high-level model. In general, the R-Lifting operation should be performed on SW using all entity pairs A,B that appear in FN, resulting in a lifted low-level model. The lifted model can then be directly compared to the high-level model to check for absent and divergent relations, presented in Equations 4.3 and 4.4. R-Lifting entities present only in the SW model is not necessary, because no comparison can be done with non-corresponding entity in the FN model. For A, B ∈ FN: ↑
f (A, B)) absencerel (A, B) ⇔ rel(A, B) ∧ ¬(rel
(4.3)
4.4. Tool Development
67 ↑
f (A, B) divergencerel (A, B) ⇔ ¬(rel(A, B)) ∧ rel
(4.4)
f refers to comp g relations. where rel refers to comp or dep and rel ] or dep Example 3 Continuing the running examples from Figure 4.7, we compare the lifted model to the high-level model using Equations 4.3 and 4.4. The lifted models for both left- and right-hand refinement models of the FN in Figure 4.7a have no absence relation with respect to dep. This is because the first conjunct of the Equation 4.3, dep(Driveline, BrakeLights) holds since there is a dependency relation between Driveline and BrakeLights in the FN view. The second conjunct, ¬(dep↑ (Driveline, BrakeLights)) does not hold because there is a dependency relation in the lifted model as illustrated above. Therefore, the absencedep (Driveline, BrakeLights) evaluates to false for both left- and right-hand models in Figure 4.7a. The lifted models for both left- and right-hand refinement models of the FN in Figure 4.7a have no divergence relation with respect to dep as well. The first conjunct of the Equation 4.4, ¬(dep(Driveline, BrakeLights)) does not hold since there is a dependency relation between Driveline and BrakeLights in the FN view. Thus, the divergencedep (Driveline, BrakeLights) evaluates to false for both left- and right-hand models in Figure 4.7a. � Example 4 Next, we check if the lifted models for both left- and righthand refinement models of the FN in Figure 4.7b have absence and divergence relations with respect to comp. The first conjunct of the Equation 4.3, comp(Driveline, BrakeLights) holds since there is a composition relation between Driveline and BrakeLights in the FN view. The second conjunct, ↑ ¬(comp ] (Driveline, BrakeLights)) holds because there is no composition relation between Driveline and BrakeLights in the lifted model as discussed above. Therefore, the absencecomp (Driveline, BrakeLights) evaluates to true for both left- and right-hand models in Figure 4.7b. The divergence relation divergencecomp (Driveline, BrakeLights) does not hold for both left- and right-hand models in Figure 4.7b, because ¬(comp(Driveline, BrakeLights)) does not hold since there is a composition relation between Driveline and BrakeLights in the FN view. � In the next section, we introduce the tool for automatically detecting absent and divergent relations and demonstrate the usage of the developed tool.
4.4
Tool Development
In the following sub-sections, the algorithm to check inconsistencies based on the definitions in the previous section, the details for the tool implementation, and a description of using the tool are presented.
4.4.1
Checking Algorithm
The lifted model that is calculated by applying the Equations 4.1 and 4.2 on a low-level SW software model, results in a lifted model, LM. The LM has been abstracted from
68
Formalizing A Correspondence Rule for Automotive Architecture Views
all details not already present in the high-level model, e.g., functional model, FN. A consistency-checking algorithm is summarized below in the algorithm CheckConsistency. Comparing this lifted model to the high-level model then fulfills the intuition of consistency described initially by Dijkman et al. [66]. Furthermore, calculating a lifted model then applying consistency checks for absence and divergence, rather than working directly on the low-level model, significantly improves the scalability and maintainability of consistency checking algorithms in practice [74]. Algorithm CheckConsistency(FN, SW) Input: FN is the functional model, and SW is the software model Output: A(possibly empty) set of consistency errors 1. Encode FN and SW as directed graphs, where edges are annotated with the relation (dependency or composition) 2. Let LM be a new, empty graph to contain the lifted model of SW (∗ Populate the SW ∗) 3. for all elements A, B ∈ FN 4. do ↑ g (A, B) 5. if dep 6. then Add an edge from A to B to LM annotated with dependency ↑ 7. if comp ] (A, B) 8. then Add an edge from A to B to LM annotated with composition (∗ Check for absence ∗) 9. for each edge e = (A, B) ∈ FN 10. do 11. if A 6∈ LM (or B 6∈ LM) 12. then Report error absentBlock(A) (or 13. absentBlock(B), respectively) 14. if e ∈ dependency ∧ 15. absencedep (A, B) 16. then Report error absentDependency(A, B) 17. if e ∈ composition ∧ 18. absencecomp (A, B) 19. then Report error absentComposition(A, B) (∗ Check for divergence ∗) 20. for each edge e = (A, B) ∈ LM 21. do 22. if e ∈ dependency ∧ 23. divergencedep (A, B) 24. then Report error 25. divergentDependency(A, B) 26. if e ∈ composition ∧ 27. divergencecomp (A, B) 28. then Report error 29. divergentComposition(A, B) The implementation of the consistency checking algorithm is described in Section 4.4.2. The tool extends the algorithm by adding a dependency relation between high-level and low-level models in an overview diagram. Presence of the overview diagram alleviates the need for high-level entities to be present in low-level model. Note that in addition to
4.4. Tool Development
69
the absence and divergence checks, an additional check is run to ensure all blocks from the high-level model exist in the low-level model; if not, an absentBlock error is reported. While there are many parts of the algorithm which could be optimized for a faster running time, they are omitted here to improve readability.
4.4.2
Tool Implementation
A prototype tool was implemented as a Java plugin integrated into the IBM Rational Rhapsody for SysML Block Definition Diagram (BDD). The reason for this choice is three-fold: Firstly, IBM Rational Rhapsody is a well-established, enterprise modeling tool used to design complex software products including automotive software systems [109]. In addition to support for SysML, Rational Rhapsody also supports UML and some domain-specific languages (DSLs). Therefore, a plugin developed for use with SysML is easily convertible to a tool for other supported languages. Secondly, it is important for the tool to be integrated directly into the development environment [73]. This not only increases usability by allowing architects to work with a tool they already understand, but also increases the likelihood that consistency checks are run often. This integration is possible in Rational Rhapsody because it offers a comprehensive Java API for plugin development. Finally, IBM Rational Rhapsody is well-documented and has an active developer community, making it a low-risk choice for development. In addition to the Rational Rhapsody API functions, the JUNG1 (Java Universal Network/Graph) library was used to encode the graphs required to represent the high-level, low-level, and lifted low-level models. Using a third-party, comprehensive graph library greatly reduced the complexity required to implement the checking algorithm. As output, the tool notifies the user of all absences and divergences encountered inside the error pane. Screenshots of the consistency-checking prototype developed for IBM Rational Rhapsody during this research are presented in Figure 4.9 and 4.10. The plugin consists of five files with total 500 lines of code. The source code of the tool is currently not publicly available, but it is planned to be integrated with the IBM Rhapsody tool.
4.4.3
Using the Tool
The consistency checking plugin expects a project to have at least two SysML package elements: a high-level package and a low-level package. A top-level element of package was chosen to separate the high-level from the lower-level models because an industrial partner of our project already organizes their models this way. Each package should contain exactly one SysML BDD, which describes the blocks relevant for that package together with their dependency and composition relationships. Then there should be another diagram, which we name overview, which specifies which packages refine which other packages. A refinement is specified by adding a dependency relation between the packages in the overview diagram with the «refine» stereotype. The presence of the overview diagram alleviates the need for high-level package (FN) entities to be present in a low-level package (SW). The consistency check tool can run on the overview diagram by selecting the Tools > Check Model command. The plugin will then find all refinements described in the overview diagram. For each refinement relation, it will retrieve the high-level and low-level 1 http://jung.sourceforge.net/
70
Formalizing A Correspondence Rule for Automotive Architecture Views
Figure 4.9: A refinement stereotype is defined between two SysML packages, each containing a block definition diagram. The consistency check plugin is integrated into the check model feature of the Rational Rhapsody, which runs from Tools > Check Model menu.
Figure 4.10: After running the consistency check, a new pane is displayed to the user containing all absence and divergence errors encountered together with the offending diagram elements.
4.5. Evaluation
71
Figure 4.11: Adaptive cruise control [52]. models (in this case Block Definition Diagrams) and run the plugin’s CheckConsistency algorithm. When errors are found, a new bottom frame opens with a list of all the errors, noting exactly which diagram, relation, and specific offending elements caused the consistency error, according to the list of failed elements generated during plugin execution. After performing this check, the architect can resolve the errors or alert another architect that there are errors, and then rerun the check.
4.5
Evaluation
In this section we evaluate the tool implemented for the consistency checking as presented in Section 4.4. We applied the tool to an Adaptive Cruise Control (ACC) system. ACC, Figure 4.11, is a cruise control system with enhanced functionality assisting the driver to keep a safe distance from other traffic ahead and alerting her if manual intervention is required [52]. In our evaluation of the prototype consistency checking tool, two teams emulated an OEM and a supplier. The “OEM” team created a functional architecture for a truck and submitted a functional model of the ACC (Figure 4.12a) to the “supplier” team. The “supplier” team elaborated the ACC software model (Figure 4.12b) and created a running ACC prototype. In the real life automotive modeling case, at this phase the supplier software would be integrated to the ACC by the OEM and tested thoroughly. Although ACC subsystem works correctly according to the OEM specification, the ACC software model created by the “supplier” team is inconsistent with the functional model provided by the “OEM” team. Indeed, using the prototype consistency checking tool with Tools > Check Model, the absence relation between Driveline and AdaptiveCCSystem and the divergence relations between ACC Controller and ACC UI, and Driveline and Radar are detected. These relations are missing in the functional view shown in Figure 4.12a. The evaluation was carried out using our Java plugin integrated into the IBM Rational Rhapsody on an Intel Core i5 CPU @2.40GHz with 4GB (3.24GB available for the IBM Rational Rhapsody) and 32-bit Windows 7 Enterprise. Running the consistency check by selecting the Tools > Check Model command and listing of error notification in a bottom frame takes approximately 100 milliseconds (measured as an average over 20 runs). Early consistency detection by the prototype tool was considered useful by both
72
Formalizing A Correspondence Rule for Automotive Architecture Views
(a) ACC functional view
(b) ACC software view
Figure 4.12: Consistency checking between functional and software views of the ACC system
4.6. Related Work
73
teams. The team members appreciated that the consistency checks are executed only when specifically invoked by the architect (on demand). This is in sharp contrast with a recommendation of Rosik, Buckley and Ali Babar [198] who argue that consistency errors should be reported continuously during development. Consistency detection can be carried out when trying to store the model in a project repository as well. It may prevent storing inconsistent models or records the inconsistencies in the repository.
4.6
Related Work
Our approach is inspired by language-neutral mechanisms [34,131,165]. Muskens et.al [165] describes generic consistency checking between software views compared to the approach proposed by Romero et.al [196, 197]. OCL is used to implement the correspondence rules in this approach. However, in this approach, views are expressed as UML models which are not widely used in the automotive architectural modeling. Our approach extends this method by enabling a technique to specify intentional correspondences for automotive architecture modeling. In their overview of UML consistency management, Elaasar and Briand [76] describe viewpoint unification to transform one UML view to another. Since different UML diagram types contain different sorts of information, this process often resulted in information loss in the transformed diagrams. Such transformation-based consistency approaches are employed by many authors [42, 143, 216]. However, the desire of the researchers to keep the operation generic for many domains and diagram types results in only basic consistency rules. For example, a rule may guarantee that classes with a certain name exists. Because we consider only the refinement correspondence, more powerful rules can be formulated. In the UML Analyzer tool [73], Egyed presents a rule-based approach to abstract from entities and relations which exist in a refinement model, resulting in a scalable consistency checking tool [74]. Furthermore it was found to be beneficial for both performance and usability to separate the transformation (abstraction) phase from the consistency checking phase. However, the rules are limited to UML, making them not directly applicable to automotive ADLs. Furthermore, the rule format does not lend itself to generalization, in contrast to a generic mathematical definition for consistency. Some authors choose to translate architectural diagrams to an intermediate language, for example XMI [130, 246], to take advantage of the existing power to express consistency rules available in those languages. Such representations are however considerably less intuitive, whereas using a graph representation can already maintain the structure and information present in most automotive ADLs while requiring a less radical model transformation. In the hierarchical reflexion model [129], relations that exist in a parent model are checked to exist in a lifted model which has been derived from source code. This approach is useful because it can equally be applied to check two hierarchical models against each other. It is also highly intuitive and results in few false positives [125]. Previous work in automotive ADL consistency has adapted the reflexion model to the automotive domain [60]. There, multiple levels of automotive models are considered. Furthermore, the research presented here extends the consistency checking approach introduced in [60] by providing more sound consistency rules for the functional and software views.
74
4.7
Formalizing A Correspondence Rule for Automotive Architecture Views
Conclusion and Future Work
Although consistency issues between architecture views have been tackled before in the software industry, there is still a need to develop a method to check the consistency between different architecture views of OEMs and suppliers. Therefore, in this chapter, we addressed the research question RQ2 by formalizing a correspondence rule between automotive architecture views and by implementing it in a prototype tool. We focus on the refinement correspondence between functional and software views, where the functional models are refined by adding more details in the software view. The revised definition for consistency proposed here requires only that an ordering be imposed on the relations available in a given ADL, allowing it to be easily used with many automotive ADLs. A prototype tool was then developed for IBM Rational Rhapsody which can perform this consistency checking between functional and software views. The consistency checking approach and the prototype tool were evaluated in the scope of an Adaptive Cruise Control modeling among two separate teams emulating an OEM and automotive supplier. The early consistency detection by the prototype tool was considered useful by both teams. Future work may consider improving the prototype tool by extending the correspondence rules and carrying out a comprehensive case study in an industrial setting. Support for consistency checking between the other automotive views identified in Chapter 2 is also needed. Furthermore, reverse engineering source code to create architectural models at different architectural views is valuable. The reverse engineered architectural model can be used to check consistency between other architectural models. For this purpose, reverse engineering methods like system grokking technology [55] can be used to extract hierarchical state machines from the source code of an embedded application. Furthermore, model-based development using automotive ADLs is a young field, where the language specification or metamodel of architectural models evolve in short period of time, which causes model co-evolution problem. Syntax-driven model co-evolution methods [231] can be used to tackle the ADL co-evolution issue.
Chapter
5
Modularity Analysis of Automotive Control Software
In this chapter, we define metrics to assess the modularity of Simulink models. The modularity metrics are validated in two phases. In the first phase, the modularity measurement is compared to the experts’ evaluation of system modularity. In the second phase, we studied the relationship between the metric values and the number of defects recorded in the problem report. We have observed that a high value of hierarchal levels frequently correlates to a high number of defects. A Java tool developed to measure these metrics interfaces with a visualization tool to facilitate the maintenance of the Simulink models.
5.1
Introduction
Modularity is a well-known concept since the introduction of the initial definition of modular product design in 1965 [220]. It was defined as a way to design a product consisting of reusable parts. It should allow the combinations of modular parts to create new products [220]. Many different types of usage of modularity exist, which may have contributed to making modularity an overloaded concept [221]. In the automotive software engineering field, the definition of module and modularity definitions also vary. Therefore, we elaborate these definitions below in the context of automotive software engineering. According to the Oxford Dictionary of English, the origin of module in the senses “allotted scale” and “plan, model” goes back to the 16th century, and may have originated from the Latin word modulus. Although the modulus was a measure of length coming from ancient time [202], it was associated with a building block concept during the Bauhaus era [160]. The building blocks were functional units in buildings (e.g., kitchen, bathroom, and living room) and were used to create buildings in more efficient way by standardization and prefabricated materials [160]. Even though the module was only related to the geometry of the interface and used even today as a standard measure of length in architecture and construction, the concepts of modules and building blocks have merged and are used as both specifications of interface and functionality in other fields [160]. Although the concept module is more frequently applied in automotive software engineering than building blocks, different definitions of the module concept
Modularity Analysis of Automotive Control Software
Vehicle Subsystem Level
Vehicle System Level
76
Hardware/ECU Level
Functional Module e.g. Powertrain
Software Level
Microcontroller Level
Hardware Module e.g. Engine ECU
Control Module e.g. Engine Control
Software Module e.g. Engine Software
Figure 5.1: Module concepts in automotive electronics system. The illustration of system levels adapted from [208]. exist. For example, a module is defined as a group of components, physically close to each other that are both assembled and tested outside the facilities and can be assembled into the car [178]. A module is also defined as a software component of software functional architecture [208]. These varying definitions are due to different stakeholders defining the module for a specific system level illustrated by Figure 5.1: the first example definition is for the vehicle system level, while the latter is defined for the software level. It is important to have a common definition of the notion module to fully benefit from the advantages of modular design, which enable growth and innovation as demonstrated in other industries
5.1. Introduction
77
e.g., computer industry which has embraced the modular-design approach. We adapt the definition of a module from [160] for the automotive context: Definition 1. A module is a self-contained functional unit relative to the system level of which it is part and has interfaces to enable composition. This definition clarifies the module used at different levels such as functional modules are assembled to build a vehicle at the Vehicle System Level. A functional module is composed of hardware modules in the Hardware/Electronic Control Unit (ECU) Level as illustrated in Figure 5.1. The activity to structure the system in modules is called modularization. In automotive industry, the initial notion of modularization is started in 1914 when the standardized sizes for automobiles were initiated [124]. Since the introduction of the modular product design approach in 1965, various modularization definitions have been developed. In automotive industry, there are four different modularization types [124]: • Modularization-in-design is defined as the activity to decompose a vehicle into constituent design parts. A goal of an Original Equipment Manufacturer (OEM) is to minimize communication efforts between stakeholders, e.g., managers, designers, and developers, and to reduce development time and cost. • Modularization-in-production is the activity to compose predefined components into modules with the subsequent incorporation into main assembly line. OEMs reduce production complexity, cost, and lead-time with this process. • Modularization-in-use is defined as decomposition of a vehicle in order to satisfy consumers’ requirements such as ease of use, ease of maintenance, low initial and replacement costs, and individuality. • Modularization-in-retirement is a new modularization process to easily separate hazardous materials. Governments drive this process to enable compliance with environmental regulations and improve recycling and re-use efforts for used vehicles. In this research, we focus on the modularization-in-design and will call it as modularization for the remainder of the thesis. Modularization should be applied cautiously,
Figure 5.2: Evolution of automobile industry [124].
78
Modularity Analysis of Automotive Control Software
otherwise it may cause higher design and development costs [124]. Modularization will become increasingly important for OEMs in their fight to stay globally competitive, particularly as it has been predicted [124] that the structure of the automotive industry will change from a vertically integrated structure into a horizontal structure as illustrated in Figure 5.2. According to this trend, OEMs are expected to become brand and service providers creating overall design and innovative concepts, while suppliers provide modules or systems. The modularization process creates a modular architecture instead of an integrated architecture. In an integrated architecture, there is no clear divisions between modules. In a modular architecture, any module can be replaced or added easily, which facilitates the maintainability of the system. This is in alignment with the following definition of modularity in the ISO/IEC SQuaRe quality standard [115], in which modularity is one of the maintainability sub-characteristics. Definition 2. Modularity is a degree to which a system is composed of modules such that a change to one module has minimal impact on other modules. Based on this definition, we elaborate further on the modularity concept of Simulink in Section 5.3.1. Simulink is one of the most used languages at automotive companies and OEMs use Simulink more than imperative programming languages and formal languages [15]. The research objective, method, and chapter outline are presented in the subsections below.
5.1.1
Research Objective
Our research objective is to develop a method and evaluate the modularity of automotive software models. Although this implies that the method needs to be applicable to all levels of automotive electronics system shown in Figure 5.1, we limit our scope to the modularity of Simulink models for the following reasons: • Simulink usage: Automotive control software is commonly developed using modelbased design tools like Simulink and Stateflow1 together with automatic code generation tools. • Simulink model volume: Large automotive Simulink models can consist of up to 15,000 building blocks, 700 subsystems and 16 hierarchical levels [224]. A hierarchal level represents a structure, where a lower layer represents the subsystem in a more detailed way. • Need for modularity evaluation: For automotive software, modularity is recognized as being paramount since changing or reusing non-modular software is very costly [185]. Therefore, evaluating the quality of Simulink models has become more important for automotive manufacturers due to the increasing complexity of the models and stricter safety-related requirements [107]. • Lack of modularity evaluation: Although there are a plethora of source code quality analysis tools available, methods to evaluate the modularity of Simulink models are still limited. Current quality assessment techniques such as the Mathworks Automotive Advisory Board (MAAB) guidelines and Model Advisor from 1 http://www.mathworks.com/
5.1. Introduction
79
Mathworks focus mainly on configuration settings and guideline conformance rather than model quality [107]. Thus, in this chapter, we address the research question RQ3 . RQ3 : How can the quality of automotive software models be defined and evaluated? Applying Definition 2 on modularity in practice requires identification and mapping of notions in Simulink models. Therefore, we elaborate on the modularity concept of Simulink models and introduce the modularity metrics in this chapter. Furthermore, to facilitate the application of the approach by industry practitioners, we suggest visualization of Simulink modularity metrics using the SQuAVisiT tool [232].
5.1.2
Research Method and Chapter Outline
We have followed the Goal Question Metrics (GQM) paradigm of the software measurement field to define modularity metrics [22]. Following the six-step GQM process, we carried out the following steps: 1. Developed a goal and associated measurement goal for improving quality i.e., modularity. Our goal was to define metrics for modularity of Simulink models for the purpose of evaluating their indicative power of the quality of the Simulink models. The context of our research is early modularity assessment from the point of view of stakeholders i.e., control system/software architects, designers, and control engineers. 2. Generated questions that define the goal in a quantifiable way. We derive the following question from this goal: “Which metrics can serve as indicators to assess the modularity of Simulink models?” Posing this question to practitioners could, however, bias their answers as they might have been tempted to give answers that might be perceived as desirable by the researcher. Therefore, we have analyzed general quality reviews of third-party Simulink models carried out by control system architects and engineers of an OEM. 3. Specified the measures needed to be collected to answer those questions and tracked process and product conformance to the goals. We specified metrics after analyzing Simulink characteristics and modularity aspects of Simulink models. We conducted a literature study related to modularity metrics for other languages e.g., objectoriented and procedural languages, and other metrics defined for Simulink models. The literature study is discussed in Section 5.2. Simulink modularity concept and metrics are presented in Section 5.3. 4. Developed mechanisms for data collection. We developed a tool to measure modularity metrics of Simulink models. 5. Collected, validated and analyzed the data in real time to provide feedback to projects for corrective action. We carried out qualitative and quantitative analyses using industrial applications to validate the metrics. Qualitative analysis helped assess if the modularity metrics measure the modularity as expected by experts. Quantitative analysis helped to assess if modularity metrics can be applied as a mechanism for a fault prediction. Modularity metrics validation is discussed in Section 5.4.
80
Modularity Analysis of Automotive Control Software 6. Analyzed the Simulink models in a post mortem fashion to assess conformance to the goals and to make recommendations for future improvements. We applied visual analytics approach to facilitate the data analysis process. Section 5.5 elaborates this step.
5.2
Related work
A quality model based on ISO/IEC 9126 standard for assessing the internal quality of Simulink models is introduced by W. Hu et al. [107]. Six quality sub-characteristics of analysability, changeability, stability, testability, understandability, and adaptability are selected for the quality model together with respective metrics. However, modularity sub-characteristic and respective metrics are not explicitly addressed by this quality model. A metric suite to identify the most complex and instable parts of the Simulink system is introduced by Menkhaus and Andrich [158]. It measures McCabe cyclomatic complexity, instability of blocks inspired by Martin’s afferent and efferent connections between blocks (based on the interaction of blocks with other blocks), and instability of system accounting influences of the complete system on a block. Although afferent and efferent connections between blocks are used in the metrics of instability of blocks, it is not directly related to modularity. The objective of this metric suite is to guide the analysis team during the risk assessment of failure modes rather than providing an insight into improving modularity of the system or subsystem. Mathworks provide quality related tools like Modeling Metric Tool [4, 105] and sldiagnostics [152] to quantitatively measure the content of Simulink models as well as Stateflow models to improve the productivity and quality of model development, e.g., model size, complexity, and defect densities. Quality analysis metrics to measure instability, abstractness, and complexity of Simulink models are introduced by Olszewska (Plaska) [173, 174]. , However, the modularity metrics are not explicitly addressed by the MathWorks tools and Olszewska’s metrics. Modularity metrics as part of software architecture metrics have been introduced by Ahrens et al. [10]. Architectural connectivity metric referred to as directed connectivity is introduced to provide a unifying basis for coupling and cohesion by Bril and Postma [35]. However, validation of these architectural metrics is not provided. Existing methods for measuring modularity are mostly intended for imperative and object-oriented (OO) software. These include Li and Henry’s OO metrics that measure maintainability, that is, the number of methods invocations in class’s implementation, the number of abstract data types used in the measured class and defined in another class of the system [140]. Other methods include Chidamber and Kemerer’s metrics suite for OO design, i.e., weighted methods per class, depth of inheritance, number of children, coupling between objects, response for a class, lack of cohesion of methods [47], Martin’s OO design quality metrics [148, 211], Lorenz and Kidd’s OO software metrics [144], and design quality metrics of OO software systems of Abreu et al. [36]. Among these metrics, coupling and cohesion are widely recognized as modularity metrics. Coupling measures the degree of interdependence between software modules and cohesion measures the connectivity between the software modules that are grouped together in the same cluster (subsystem). In our work we have proposed a series of modularity metrics for Simulink subsystems. Subsystems can be composed of larger subsystems, therefore, rather than evaluating the larger ones directly, one could infer the metrics values of the larger subsystems by aggregating the corresponding metric values of the smaller subsystems of which they are
5.3. Modularity Metrics in Simulink
Model
-_1-_1 1
81
Diagram
Signal
Bus
1
1
Subsystem
1 1 1
Block
Port
-isAtomic : bool 1
BasicSubsystem
1
InPort
OutPort
Figure 5.3: A simplified metamodel that describes the structure of Simulink models (revised from [29]). composed. This approach would be related to the metrics aggregation problem as known in software maintenance. While the most common aggregation technique, the mean, represents a central tendency and as such is unreliable for heavily skewed distributions, typical for software metrics [235], recently applied to metrics aggregation econometric inequality indices [163, 212, 236]. More profound study of metrics aggregation for Simulink models is considered as a future work.
5.3
Modularity Metrics in Simulink
Main concepts of a Simulink model and the modularity related issues are discussed in Section 5.3.1. Modularity metrics are presented in Section 5.3.2.
5.3.1
Simulink model
MATLAB Simulink is a visual modeling language and tool for developing, simulating and analyzing multi-domain dynamic systems2 . A metamodel of Simulink [29] is presented in Figure 5.3. A Simulink Model contains a Diagram, which consists of a set of Blocks (e.g., Transmission model in Figure 5.4). A block can be connected to another block by a Signal or a Bus via its Ports. A block receives its data or control signals via its InPorts (Input Ports) and provides its data or control signals via its OutPorts (Output Ports). For the sake of diagram readability or understandability, (related) signals are frequently grouped into Buses. Subsystems are blocks that contain a Simulink diagram (e.g., TransmissionRatio subsystem is opened in a separate window in Figure 5.4). The subsystem concept enables hierarchical modeling, i.e., subsystems can contain other subsystems. We introduced a special kind of subsystem as a BasicSubsystem, if it does not contain other subsystems (e.g., TransmissionRatio is also a basic subsystem). A subsystem can be an Atomic subsystem, which means blocks within an atomic subsystem are grouped together in the execution order. Any subsystem including a basic subsystem can be an atomic subsystem. We revised the Simulink metamodel by adding these concepts to it as illustrated in Figure 5.4. 2 http://www.mathworks.com/products/simulink/
82
Modularity Analysis of Automotive Control Software
Figure 5.4: Simulink example model [110]. Figure 5.4 illustrates the Transmission model, which contains the Transmission diagram. Blocks, basic elements of a Simulink diagram, communicate via input (InPort) and output (OutPort) ports: e.g.,, Tin is an input port and Tout is an output port of TransmissionRatio. Simulink blocks have respective visual representations e.g., TorqueConverter has a circle inside to represent its behavior and Multiply operation or block has a multiplication inside the block. Simulink blocks are categorized into non-virtual and virtual blocks [110]. Non-virtual blocks are active blocks which influence model’s behavior in the simulation of a system. Virtual blocks are used to organize the model graphically e.g., BusSelector, BusCreator, and Subsystem (if the block is not conditionally executed) as illustrated in Figure 5.5. If a block can be both virtual and non-virtual depending on the conditions, it is called a conditionally virtual block. Simulink diagram contains data and control flow as illustrated in Figure 5.5. Signals are the streams of values that appear at the outputs (OutPorts) of blocks and travel following the arrows through the connected blocks, when a model is simulated. If a signal is used to initiate execution of another block (e.g., a function call or Action Subsystem a subsystem with an Action port, which allows for block execution based on conditional inputs from an If block or Switch Case block [110]), it is called a control signal. A dash-dot line is used to represent the control signal in Simulink when an execution is started. As mentioned above, a set of signals can be grouped into a Signal Bus. A Signal
Figure 5.5: Simulink signals.
5.3. Modularity Metrics in Simulink
83
Bus is a virtual signal. Simulink uses thicker signals to display signal buses as shown in Figure 5.5. A virtual block, BusCreator1, combines the input signals and a virtual block, BusSelector1, selects signals from an incoming bus. Applying the modularity definition of Section 5.1 to Simulink concepts, the module is mapped to a Simulink subsystem. Therefore, modularity for Simulink is redefined as following: Definition 3. Simulink modularity is defined as the degree to which a system is composed of subsystems such that a change to one subsystem has minimal impact on other subsystems. This definition means that a modular (sub-)system should contain highly related blocks (high cohesion) and dependencies with other subsystems should be minimal (low coupling). These are widely recognized modularity aspects from other disciplines, for example, object-oriented and procedural programming. To investigate additional modularity aspects specific to Simulink models, we investigated proprietary review reports of Simulink models from an automotive company. From our study of proprietary review reports, we identified many issues, which hinder modularity of Simulink models. In the review reports of the Simulink models, domain experts (e.g., system architects, designers, engineers) identify architectural problems and provide modeling comments. In the review report, thirty of ninety seven problems are directly or indirectly related to modularity. In Table 5.1, we list key modularity-related quality issues identified by the experts and the derived metrics, which are elaborated in Section 5.3.2. Issues Too many nested subsystems Too many input (bus) signals Unbalanced decomposition of Subsystems Model clones
Description Too many hierarchical levels of a subsystem Extensive use of the large input bus signals Subsystems (blocks) that should be combined into larger subsystems Similar or duplicated functionality
Derived metrics Depth of a Subsystem (DoS) Number of Input Signals (NIS) Number of Contained Subsystems (NCS) See Chapter 7
Table 5.1: Simulink modularity-related issues. In the following Section 5.3.2, we define modularity metrics for Simulink models based on the characteristics of Simulink models and elaborate the metrics defined for the issues highlighted in the Table 5.1. The issue of similar or duplicated functionality (model clones) is tackled in Chapter 7.
5.3.2
Metric definitions
Building on the long-standing tradition of modularity research in software engineering [47, 180, 207], we have extracted metrics from Table 5.1 with those reflecting common software engineering guidelines. These include keeping a low number of connections between subsystems (low coupling), systems should contain similar or related functionalities (high cohesion) and communication between subsystems should be limited (narrow interfaces). In Table 5.2, the summary of modularity metrics for Simulink models is provided. The interface granularity metrics are integrated into the coupling metrics. The definitions are discussed in detail under two main categories.
84
Modularity Analysis of Automotive Control Software Coupling metrics CBS Coupling Between Subsystems DSC Degree of Subsystem Coupling NIP Number of Input Ports NOP Number of Output Ports NIS Number of Input Signals NOS Number of Output Signals Cohesion metrics SCM Subsystem Cohesion Metric SD Signal Density SZ Subsystem size metric Nesting metrics DoS Depth of a Subsystem NCS Number of Contained Subsystems NBS Number of Basic Subsystems Table 5.2: Modularity metrics for Simulink model.
Coupling metric definition Coupling is defined as the degree of interdependence between modules [47,245]. In the context of Simulink models, two subsystems are coupled if, and only if, at least one of them uses a signal of the other. We define the following inter-subsystem metrics to measure the structure of the interconnections between Simulink subsystems: • CBS (Coupling Between Subsystems): To measure CBS for a given subsystem, S, we count the number of subsystems coupled to the subsystem. FanIn(S) counts the number of subsystems providing signals to the subsystem S and FanOut(S) counts the number of subsystems receiving (using) signals from the subsystem S. The reason to count FanIn and FanOut subsystems instead of other operational blocks (e.g., sum, gain, merge, inport, outport) is that the subsystems are subject to change and influence the coupled subsystem rather than standard operational blocks. In Figure 5.6, we highlight example FanIn and FanOut subsystems of an EngineDynamics subsystem, which is in the sldemo engine model [110]. CBS (S) = FanIn(S) + FanOut (S) CBS is close in spirit to Coupling Between Object classes [47], an object-oriented metrics referring to the total number of methods of a class, which use methods or instance variables of another class. • DSC (Degree of Subsystem Coupling): DSC encompasses data and control flow coupling, global coupling, and environmental coupling. We refer to data flow coupling if the subsystems are coupled via data signals, and control flow coupling if the signal type is control (triggers an action as explained above). In a Simulink model, a DataStoreMemory block is used to store a global variable. It defines a memory region usable by DataStoreRead and DataStoreWrite blocks that specify the same data store name [110]. The number of DataStoreMemory blocks of the subsystem represents the number of global variables of the subsystem. Global
5.3. Modularity Metrics in Simulink
85
Figure 5.6: FanIn and FanOut subsystems of the subsystem Engine Dynamics. coupling involves global variables. Environmental coupling refers to the coupled subsystems of the subsystem of interest i.e., FanIn and FanOut subsystems. DSC(S) = 1 −
1 ds + 2 × cs + 2 × gs + es
where, ds is number of data signals, cs is number of control signals, gs is number of global variables, es refers to FanIn(S) + FanOut (S) (same as the CBS metric). DSC is derived from the coupling metric that encompasses data and control flow coupling, global coupling, and environmental coupling [65]. Since CBS metric is the same as the environmental metric, the DSC and CBS metrics are not truly independent. However, we wanted to define the metrics first, and then select the favorable metrics based on the metrics evaluation. • NIP (Number of input Ports): NIP counts the number of input ports of a subsystem. For example, in Figure 5.4, the subsystem TranmissionRatio has three input ports, N IP (T ranmissionRatio) = 3, namely Tin, Gear, and Nout. • NOP (Number of output Ports): NOP counts the number of output ports of a subsystem. For example, in Figure 5.4, the subsystem TranmissionRatio has two output ports, N OP (T ranmissionRatio) = 2, namely Tout and Nin. • NIS (Number of input Signals): NIS counts the total number of input signals including nested bus signals of a subsystem. Figure 5.7 illustrates a Simulink subsystem, which has a single input port (N IP = 1), which transfers a nested signal bus. In this case, N IS = 6 counting all bus signals including (nested) bus signal itself (two signals with thicker dashed lines) and bus signals (, , , ). • NOS (Number of output Signals): NOS measures the number of output signals including nested bus signals of a subsystem. Buses can be nested to any depth using
86
Modularity Analysis of Automotive Control Software
Figure 5.7: Simulink nested input signal [110]. a BusCreator block. For example, in Figure 5.8 the Bus1 signal combines the Bus2 nested bus signal and the motor5 signal. The example model in Figure 5.8 has a single output port N OP = 1 and N OS = 8 counting all bus signals including (nested) bus signals. Cohesion metric definition Cohesion refers to the degree to which the elements of a module belong together [245]. In the context of Simulink models, cohesion refers to the inter-relation of the blocks including subsystems. Below we define these metrics. • For the cohesion metric, we introduce Block-Signal Mapping (BSM) matrix. The BSM is a binary n × m matrix, where n is the number of blocks and m is the number of unique signals e.g., s1 and s2 in Figure 5.9 (a). When a signal is forked
Figure 5.8: Simulink nested input signal [110].
5.3. Modularity Metrics in Simulink
87
(a) Subsystem A using all signals.
(b) Subsystem B with an unrelated subsystem.
Figure 5.9: Example cohesive and in-cohesive subsystems. and used by several blocks, we refer to only one of them as a unique signal. The BSM matrix has rows indexed by the blocks and columns indexed by the signals, 1 6 i 6 n, 1 6 j 6 m: ( 1 if the ith block uses the jth signal, oij = 0 otherwise. Figure 5.9 illustrates an example cohesive and in-cohesive subsystems. To construct the BSM matrix, the model of interest is analyzed by tracing the signals which are used by the subsystems or blocks of the model. The BSM matrix for the Subsystem A is obtained in Table 5.3. The signals s1 and s2 are used by all the subsystems, p1, p2, and p3 of Subsystem A. Table 5.3: A BSM matrix for the (a) Subsystem A and (b) Subsystem B. (a)
p1 p2 p3
s1 1 1 1
(b)
s2 1 1 1
p1 p2 p3
s1 0 1 0
s2 1 0 0
We define the Subsystem Cohesion Metric (SCM) for a subsystem S:
88
Modularity Analysis of Automotive Control Software
0 SCM (S) = 1 σ
mn
where, σ =
m X n X
if (m = 0), if (σ = mn and (m > 0 and n > 0)), otherwise.
oij , n is the number of blocks and m is the number of unique signals.
i=1 j=1
Note that (n = 0 and m > 0) condition is not possible, because signals need to be connected between blocks in Simulink. We considered several Simulink patterns to define the SCM metric: – Although it is meaningless, a subsystem S can be empty (with no signals and blocks), n = 0 and m = 0. In this case, the subsystem is considered to be in-cohesive, SCM (S) = 0. – A subsystem may contain only blocks without signals connected to them, n > 0 and m = 0. In this case, the subsystem is also considered in-cohesive, thus SCM (S) = 0. – A subsystem may contain only InPorts and OutPorts, or virtual blocks e.g., BusCreator, BusSelector. Then count all the ports as blocks as well and include in the BSM. – If a signal is used multiple times by the same block, then the BSM also contains value 1 for the block and signal used. – If all the subsystems are related as e.g., a Subsystem A in Figure 5.9, then the cohesion value for such a subsystem must be the maximum value 1. 3+3 For the example Subsystem A and B, the SCM (SubsystemA) = 2×3 = 1 and 1+1 SCM (SubsystemB) = 2×3 ≈ 0.33 respectively. According to the inter-relation of the blocks, Subsystem A has more related blocks than Subsystem B given the number of signal relations between subsystems. The SCM (S) values confirms that the Subsystem A is indeed more cohesive than the Subsystem B.
• SD (Signal Density): SD provides insight into the signal density of the subsystem. SD =
k n
where n is the number of blocks and k is the total number of signals. • SZ (Size): SZ measures subsystem size by calculating total number of contained blocks (including subsystems) and the total number of signals. SZ = n + k where n is the number of blocks and k is the total number of signals.
5.4. Metrics tool and evaluation
89
Nesting metric definition Subsystems are hierarchal, thus we measure additional metrics to measure the subsystem size and its hierarchal depth. • DoS (Depth of a subsystem): DoS is the maximum level the subsystem has until its basic subsystems. • NCS (Number of Contained Subsystems): NCS calculates the number of all the contained subsystems at all hierarchical levels (including the intermediate subsystems). • NBS (Number of Basic Subsystems): NBS calculates the number of all the contained basic subsystems at all hierarchical levels. In the following section, we illustrate the tool that we have implemented to measure the identified metrics on the Simulink models.
5.4
Metrics tool and evaluation
We implemented a tool that automatically collects the metrics defined in Section 5.3.2 from Simulink models. The tool uses a Java parser for Simulink MDL files of the ConQAT open-source tool [49], which is an integrated toolkit for continuous monitoring quality characteristics of software systems. Our tool reads Simulink MDL files with the standard structural format and generates the metrics files with the list of subsystems and the respective modularity metrics. In the following sub-sections, we discuss the results of the evaluations that were carried out in two main phases.
5.4.1
Expert evaluation
The first part of the evaluation effort was based on an expert evaluation. To this end we have randomly selected a number of subsystems of an industrial application and had them evaluated by the domain experts using a scale of 1 to 10, 1 meaning worst and 10 meaning best modularity. We have opted for the 1–10 scale rather than more customary five- or seven-point Likert scales [142], since the 1–10 scale is used in Dutch schools and universities, and, hence, is familiar to the domain experts. The experts also provide the reasoning for the scores they give to the subsystems. The domain experts included one control engineer and five senior architects, who are responsible for modeling automotive software within one OEM at different architectural levels, ranging from functional architecture to Electrical/Electronic (E/E) architecture. All the architects had a Master of Science (MSc) degree in mechanical or electrical engineering and had more than 10 years experience in the automotive domain. One architect had a PhD in mechanical engineering. The control engineer had an MSc degree in mechanical engineering and had more than three years experience in the automotive domain. Results from the expert evaluation are summarized in Table 5.4 (left). For confidentiality reasons we abbreviate the names of the subsystems. Similarly, for privacy reasons we do not disclose the names of the experts. We observed, however, that for individual subsystems the expert ratings are not always consistent with each other: e.g.,, EH is ranked 3 by experts A and B and 7 by experts C and F. To gain a better insight into the reasons for this discrepancy, we discussed it with the experts. Discussion revealed that experts A, B and C interpreted modularity in terms of coupling, while experts D, E and
90
Modularity Analysis of Automotive Control Software
F interpreted modularity in terms of cohesion. Thus as shown in Table 5.4, we grouped the experts evaluation by coupling (A to C) and cohesion (D to F). Subsystem EH ED IDA GS TP TS BTL CC TSCA TRC
Experts ABC DEF 3 3 7 557 7 9 7 868 9 8 7 778 7 6 7 768 9 8 7 888 3 7 1 777 9 8 7 887 7 8 1 876 9 8 7 888 7 8 5 783
BTL
TP
TSCA
EH
TS
Table 5.4: Expert review of selected subsystems of the industrial application and the e e corresponding T-graph. Components missing from the T-graph are incomparable. We start by comparing the evaluation of different subsystems. Traditionally, comparison of multiple groups follows a two-step approach: first, a global null hypothesis is tested, and then multiple comparisons are used to test sub-hypotheses pertaining to each pair of groups. The first step is commonly carried out by means of analysis of variance (ANOVA) [99] or by using its non-parametric counterpart, the Kruskal-Wallis one-way analysis of variance by ranks [103]. The second step uses pairwise t-tests or their nonparametric counterparts, Wilcoxon-Mann-Whitney tests [242], with Bonferroni correction [68, 214]. Unfortunately, the global test null hypothesis may be rejected while none of the sub-hypotheses are rejected, or vice versa [87]. Moreover, simulation studies suggest that the Wilcoxon-Mann-Whitney test is not robust enough to examine unequal population variances, particularly in the case of unequal sample size [247]. Therefore, one-step approaches are required: such an approach should produce confidence intervals which always lead to the same test decisions as the multiple comparisons. We have e [126] in combination with used the recently proposed multiple contrast test procedure T e e a T-graph [234]. Using the T-procedure for the “all pairs” (Tukey-type) contrast and e 95% confidence level and inspecting the corresponding T-graph (Table 5.4 right) we can conclude that the experts prefer BTL, TP and TSCA over EH, and TP and TSCA over TS. e The T-procedure does not reveal consistent differences between the expert evaluations, i.e., one cannot argue that one of the experts consistently gives higher/lower rankings than another one. Therefore, we do not exclude any of the evaluations. Figure 5.10 shows scatter plot diagrams of coupling metrics values and an average experts’ evaluation based on coupling (Experts A to C in Table 5.4). Note that it was discovered in the comments provided by the experts that experts (A-C) gave higher scores to the subsystems with low coupling or lean interfaces and lower scores to subsystems with high coupling or complicated interfaces. Therefore, high values of coupling metrics indicate poor modularity according to experts evaluation based on coupling. In the review comments of the domain experts, the list of subsystems with high coupling metrics values (e.g., high values of DSC) indeed were identified as subsystems that are difficult to maintain due to higher number of signals. Input processing subsystems, which are
5.4. Metrics tool and evaluation
91
1
2
3
●
●
●
●
6
● ● ●
●
0.94
0.98
0
2
4
6
NOP vs. Exp
NIS vs. Exp
NOS vs. Exp
●
4
6 NOP
8
8
●
●● ●
6
8 6
●
0
0
●
●● ●
● ●
4
12
●
●
●
2
10
● ●
0
●
●
Exp_Coupling
●
2
4
●
●● ●
4
6
●
8
10
NIP
10
DSC
●
2
●
CBS
●
●
●
0 0.90
Exp_Coupling
●
8
10 ●
●
4
●
2
8
●● ●
4
10 8
●
0
2
4
●
●
Exp_Coupling
●
● ●
6
6
●
4
●
2
●
Exp_Coupling
●
●
2
8
●
0
Exp_Coupling
●
0
Exp_Coupling
NIP vs. Exp
10
DSC vs. Exp
10
CBS vs. Exp
0
20
40 NIS
60
0
5
10 15 20 25 30 NOS
Figure 5.10: Scatter plot diagrams of expert evaluation and coupling metrics. intended for processing input signals and providing higher number of output signals have high DSC value as well. Therefore, it is not necessary to take the metrics as absolute indicators of poor modularity but rather as a facilitator of the maintenance process. Figure 5.11 shows scatter plot diagrams of cohesion and nesting metrics values and an average experts’ evaluation based on cohesion (Experts E to F in Table 5.4). Cohesion and nesting metrics are less relevant, therefore the lines are not necessary. Experts gave higher scores to the subsystems with high cohesion (grouping of related blocks). Therefore, high values of cohesion metrics indicate high modularity according to experts evaluation based on cohesion. Table 5.5 presents the descriptive statistics for the metrics and expert evaluations. The minimum, maximum, mean, and standard deviation are calculated for each metric and evaluations. N is the number of subsystems. The large standard deviation for NIS, NOS, and SZ metrics indicate that the chance for significant relationships between these metrics and other metrics is narrow. In the next subsection, we determine the statistically independent metrics. Before determining the relation between the modularity metrics and the number of faults in Section 5.4.2, we carried out the Kendall’s τ correlation test [83] on the modularity metrics to detect the statistically independent metrics for measuring coupling, cohesion and nesting aspects. CBS and NOP have a positive correlation τ = 0.741 at the significant level 0.010. DSC metric is related to interface metrics i.e., for NOP and NIS, τ = 0.544 (p-value = 0.042) and τ = 0.523 (p-value = 0.038) respectively. DSC is related to SCM, SD, and SZ metrics, τ = −0.822 (p-value = 0.012), τ = 0.600 (p-value = 0.016), and τ = 0.956 (p-value = 0.0) respectively. NIP and NOS have a negative correlation with the expert coupling value τ = −0.780 (p-value = 0.005), τ = −0.709 (p-value = 0.009). Therefore, as the statistically independent metric for measuring coupling aspect, DSC is
92
Modularity Analysis of Automotive Control Software
0.10
0.15
8
10
●
6 0
1
2
3
4
5
6
0
5
10
● ●
6
8
10
NBS
8
●● ●
●
●
● ●
0
0 4
● ● ●●
6
● ●●
4
●●
2
8 6
● ●
Exp_Cohesion
4 2 0
● ●
4
●
2
●
Exp_Cohesion
●
15
10
SZ vs. Exp
10
SD vs. Exp
●
●
●
NBS vs. Exp
●
2
● ● ● ●
NCS
●
0
●
●
DoS
●
●
●
4
●
2
●
Exp_Cohesion
8
●
6
●
●
●
0.20
10 8
●
SCM
● ●
6
●
●
0
2
4
●
●
4
6
● ●
2
●● ●
Exp_Cohesion
8
●
●
0
Exp_Cohesion
●● ●
0.05
Exp_Cohesion
NCS vs. Exp
10
DoS vs. Exp
10
SCM vs. Exp
1.0
1.5
2.0 SD
2.5
50
100
150
200
SZ
Figure 5.11: Scatter plot diagrams of expert evaluation and cohesion and nesting metrics. selected. According to the Kendall’s τ correlation analysis on the cohesion-related metrics to identify the statistically independent cohesion metrics, SCM and SZ have a negative correlation, τ = −0.778 (p-value = 0.002). NCS and NBS have positive correlation, τ = 0.766 (p-value = 0.004). Therefore, we exclude the NBS, SD and SZ metrics. Hence, as the statistically independent metric for measuring cohesion aspect, SCM, DoS, and NCS are selected.
5.4.2
Metrics evaluation
In this evaluation phase, we carried out a correlation analysis to detect if there is a relation between modularity metrics and the number of faults. A fault is an incorrect program step, process, or data definition in a computer program [84]. We use the term fault, but exclude “incorrect step and process” from consideration to an error in modeling or logic that cause the system to malfunction or to produce incorrect results. It is important to measure model defects to keep control over the maintenance [27]. As stated earlier, our main goal was to identify modularity aspects that hinder the quality of Simulink models. By obtaining fault information and analyzing the relation of faults to modularity metrics, we aim to determine quality and furthermore predict the fault-proneness. We used the fault data collected from the second industrial application consisting of 40 subsystems, of which 20 subsystems contain faults. The Kendall’s τ correlation test is used as in Section 5.4.1. This is because there are a number of tied values, therefore it is important to establish if any modularity metric and the number of faults are statistically dependent rather than simply measuring the degree of the linear relationship between the variables. Figure 5.6 shows the correlations between the modularity metrics and the
5.4. Metrics tool and evaluation
93
Table 5.5: Descriptive statistics.
number of faults (NrDef). The correlation coefficient calculates the strength and direction of the correlation. A positive correlation coefficient indicates a positive relation between the metrics and defects, while a negative correlation coefficient indicates a negative relation. The significance level indicates the probability of such a result occurring due to a coincidence. We accept a common significance level of 0.010. As presented in Table 5.6, the DoS and NCS metrics are positively correlated with the number of faults. Based on this preliminary analysis, we can conclude that the high value of higher hierarchal levels and complex models may imply a more fault-prone system. This is in line with the studies from other programming paradigms, which show that there is a strong correlation between software maintenance effort and software metrics in the procedural and object-oriented paradigms [140, 195]. As the preliminary analyses concluded that the degree of a subsystem coupling (DSC), subsystem cohesion metric (SCM), depth of a subsystem (DoS), and number of contained subsystems (NCS) are statistically independent metrics to evaluate modularity of Simulink models, it is important to visualize these metrics in an efficient manner.
5.4.3
Threats to Validity
Modularity metrics are developed in a proprietary setting. Therefore, applying this model to a generic automotive system needs further investigation. A quality model and more than 80 metrics are introduced in Scheible’s research [209], therefore in recent years there is active research on the development of a quality model for automotive industry. This also requires further collaboration between OEMs, suppliers, and tool vendors. In addition, the selection of metrics can be too practical, since the metrics were defined based on the literature and inputs from domain experts. The domain experts involved in the qualitative analysis evaluated the models based on a 1-10 scale and we used the mean of the evaluations for each of the quality attributes. Further empirical studies are needed to validate the selection and application of metrics. The number of domain experts involved in the evaluation is limited due to their
94
Modularity Analysis of Automotive Control Software Table 5.6: Kendall’s τ correlation analysis.
restricted time and availability for the evaluation of the software quality. This is a potential threat to the validity. However, to increase the number of participants for the evaluation task by involving students or engineers with less expertise may not be representative for practical model engineering tasks.
5.5
Visualization tool
To visualize metrics, we selected SQuAVisiT (Software Quality Assessment and Visualization Toolset) [232] as it is a flexible tool for visual software analytics of multiple programming languages. SQuAVisiT is intended to support a software development team (including developers and maintainers) carrying out quality assurance and maintenance tasks. Our metrics tool interfaces with the SQuAVisiT toolset. In Figure 5.12, SQuAVisiT visualizes the modularity and dependency of an industrial application that we studied in Section 5.4.1. (The subsystem names here and elsewhere are blurred up for confidentiality reasons.) The radial view was first introduced by Holten [104] and extended in SolidSX [192] and the SQuAVisiT toolset [201]. In this view, subsystems are placed in concentric circles according to their depth in the Simulink model i.e., subsystems are illustrated as nested rectangles in the outer rings of the radial view. The relations between (basic) subsystems, such as input and output signals, are shown as curved arrows in blue color. The tool allows for zooming into the subsystems for more detailed views. The colors on subsystems are used to visualize values of modularity metrics. The green subsystems show the modular and red ones show subsystems which require attention to improve their modularity. Figure 5.12 demonstrates the visualization of software with DSC (Degree of Subsystem Coupling) metric, where DSC is selected in the right panel and DSC values for the subsystems are illustrated with respective coloring. The grey rectangles represent Bus Selectors and Bus Creators. Figure 5.12 highlights not only subsystems with high coupling, but also shows subsystems upon which they depend, so that the developer can easily navigate and zoom into the dependencies of a particular unusual subsystem. This facilitates the signal tracing activity in Simulink and decreases the analysis time to detect 3 http://www.solidsourceit.com/
5.5. Visualization tool
95
Figure 5.12: Visualization of system modularity with the help of SQuAVisiT tool. SQuAVisiT extended quality radial view of SolidSX tool3 .
Figure 5.13: SQuAVisiT quality treemap view. coupled subsystems. This tool gives early feedback about system modularity, making it cheaper and easier to reuse and maintain than traditional techniques. An example treemap view of our industrial application illustrated in Figure 5.13, shows
96
Modularity Analysis of Automotive Control Software
Figure 5.14: SQuAVisiT quality table view. its structural nesting highlighted with the selected modularity measurements (green— modular, red—nonmodular). The advantage of this view is all the subsystems and their sub-components are shown simultaneously and it is easy for the architect to identify the subsystems, which may require further inspection [192]. Figure 5.14 illustrates another example of quality visualization. We illustrate all the metric values of the subsystems including the excluded metrics (NiP, NoP, NIS, NOS, and NBS). The table contains cells as pixel bars scaled and colored by metric values as first introduced by Rao et al. [188]. The first column displays the list of subsystems and the rest of the columns list all the metric values and last column lists the number of faults of the subsystems. Subsystems are sorted by descending number of fault value. This can help the domain experts easily locate the most problematic subsystems and their respective metric values. However, evaluating the effectiveness of using different visualizations of Simulink model quality is a possible area of a future work.
5.6. Conclusion and future work
5.6
97
Conclusion and future work
It is important to assess automotive software quality because of the increasing complexity and size of Simulink models [86]. In this chapter, we focused on the modularity aspects of Simulink models and defined modularity metrics for Simulink models following the Goal-Question-Metrics (GQM) approach. We defined a modularity metrics suit consisting of nine coupling and cohesion-related metrics and evaluated it with experts’ reviews and preliminary statistical analysis. We identified three independent metrics (degree of subsystem coupling, number of contained subsystems, and depth of a subsystem) based on the statistical analysis and identified a correlation between modularity metrics and number of errors. We developed a tool to measure modularity of the Simulink models and visualized the quality aspects with SQuAVisiT toolset. Although we carried out a preliminary analysis to define a relation between modularity metrics and number of faults, this needs to be explored further if the moderate correlation is satisfactory. This investigation can be compared to source code or other graphical modeling languages. Modularity metrics in combination with other quality metrics may provide useful insight on fault prediction of automotive software [14]. Modularity metrics can be also used to detect bad smells that indicate the need of refactoring. Tool support for refactoring Simulink models is limited compare to the established refactoring techniques from Object-Oriented programming [230]. The benefit of visualizing modularity metrics using SQuAVisit also needs to be investigated further. As identified in our previous research [58], which showed that connectors (signals or dependencies) are not modeled as first-class objects in automotive architecture description languages (ADLs), this also holds for MATLAB/Simulink modeling. Therefore, the modularity metrics related to connectors e.g., number of subsystems using a signal, unused signals of a bus needs to be refined further. We believe that the metrics we defined here can be applied or extended to modularity metrics of automotive architectural models. In addition, the modularity metrics should take into account the increasing number of subsystems and dependencies when the system evolves, which has been identified in the analysis of high-cohesion/low-coupling metrics [17]. Modularity is added as a sub-characteristics of ISO/IEC SQuaRE quality standard and it is related to other quality (sub-)characteristics e.g., reusability, modifiability, and stability. In the expert evaluation, understandability is considered by the automotive domain experts as one of the key related quality characteristic as well due to the Simulink visual modeling. In Section 6, we identified that complexity is closely related to the understandability and analysability. Therefore, in the next chapter, we designed a complexity metrics suite addressing different attributes of complexity. Once the modularity and complexity metrics for the Simulink models in the automotive domain are thoroughly evaluated, they can be modified or extended further for other embedded domains. As stated in Section 5.2, future work may also investigate the viability of metrics aggregation techniques for use in Simulink models. Finally, while in the current chapter we have focused on one Simulink model, we intend to study changes in modularity metrics during the system evolution, and investigate the applicability of Lehman’s general software evolution laws [138] to evolution of Simulink models (cf. [43, 117]). Should model repositories become available, we can augment the evolutionary studies by repository mining techniques [183].
Chapter
6
Complexity Metrics Suite for Simulink Models
Due to the increasing size and complexity of Simulink models, it is beneficial to monitor these factors early in the development cycle, even as early at the design phase, in order to manage the issues at early development phase. The current complexity metric for Simulink is tightly coupled to the size metric. Other attributes contribute to complexity besides size. Therefore we designed a complexity metrics suite to address different attributes of complexity. Furthermore, complexity is an overloaded term with different interpretations. To tackle the conflicting definition of what constitutes complexity, we related our complexity metrics to the quality attributes based on qualitative analysis. The evaluation is based on the analysis of the Simulink models performed by experts from the automotive domain. Preliminary analysis suggests that complexity is closely related to analysability and understandability. It was also observed that due to the visual representation of Simulink models, a broader view on complexity is needed. We support our claims with a case study from the automotive domain.
6.1
Introduction
Since 90% of the innovation in the automotive industry is driven by electronics and software [37, 217], ensuring software quality has become a necessity. In automotive software engineering, MATLAB/Simulink is one of the most popular graphical modeling languages and a simulation tool for modeling and simulating automotive software systems. Since 85% of bugs are introduced in the early development phase, it is crucial to develop techniques to detect bugs early instead of causing costly field recalls [57]. Automated source code analysis methods and tools e.g., Klockwork’s SCA [123], Model-Engineering Solutions’ M-XRAY [162], and CQSE’s ConQAT [49], have been developed to perform quality analysis at the early development phase. However, these tools are commercial, therefore the metrics defined for the source code and Simulink models are not publicly available. This makes it difficult to reproduce the complexity evaluation and makes it necessary to define publicly available complexity metrics for Simulink models. To evaluate software complexity, different metrics have been defined. The cyclomatic
100
Complexity Metrics Suite for Simulink Models
complexity metric designed by McCabe in 1976 to indicate system’s testability and understandability is one of the most popular complexity metrics. Mathworks Verification and Validation software tool approximates the resulting McCabe complexity of generated code out of Simulink models [151]. Scheible applies Halstead mapping out of the M-XRAY tool to measure average local complexity and global complexity to manage testability and maintainability respectively [209]. However, the Halstead mapping is not described due to the commercial nature of the tool. Olszewska (Plaska) [173, 174] defined structural , and data flow complexity metrics inspired by Card and Glass metrics [45], as well as instability and abstractness metrics based on object oriented concepts [148]. However, the evaluation of these metrics has not been carried out. The existing measurement techniques have been in use for some time now, but utilized for different contexts, including various programming languages, module-based systems, or object oriented designs [46, 168]. . We define and implement a complexity metrics suite for Simulink models. We analyse the results and cross-reference the complexity measurements with the defect data we have for the case study. We also explore the possible validity issues for the metrics and the case study, separately, so that it is possible to replicate the study and to enable other researchers and developers to employ the Complexity Metric Suite in their setting. The remainder of the chapter is structured as follows. Section 6.2 presents the background of the complexity definition, describes the existing complexity metrics. Section 6.3 discusses further why complexity evaluation in the automotive industry is important. Section 6.4 presents a complexity metrics suite for Simulink models and Section 6.5 discusses the evaluation of the metrics suite. The metrics suite discussion and threats to validity are provided in Section 6.6. Related work is elaborated in Section 6.7. Finally, Section 6.8 concludes the paper and discusses future work.
6.2
Background
We discuss variations of complexity definitions and complexity metrics in this section.
6.2.1
Complexity Definition and Metrics
There has been a lack of consensus on the definition of complexity [9]. According to IEEE Standard Computer Dictionary [88], complexity is defined as “the degree to which a system or component has a design or implementation that is difficult to understand and verify”, thus making complexity a characteristic addressing the design, implementation and the effort needed to understand and verify the design or implementation. According to Evans and Marciniak [79] complexity is “the degree of complication of a system or system component, determined by such factors as: the number and intricacy of interfaces, the number and intricacy of conditional branches, the degree of nesting, the types of data structures”. Yet another proposed definition of complexity, embracing various aspects, was given by Whitmire [241], where computational complexity is defined in terms of “hardware resources required to execute the software”, psychological complexity consists of “complexity problem solved by the software”, structural complexity includes “characteristics of software (size, cohesion, coupling, etc.)” and programmer complexity refers to “programmer’s knowledge and experience of the problem and solution domain”. While the IEEE definition of complexity regards process and product, the Evans and Marciniak’s definition focuses on the structure of a system. Finally, Whitmire’s definition includes computational, psychological, and representational complexity. There is, however,
6.2. Background
101
no explicit definition of complexity in the ISO 25010 international standard also known as SQuARE model. Kan [120] related the design and code implementation metrics to software quality. He identified the Lines of Code (LOC), Halstead’s software science metrics [96], and McCabe’s cyclomatic complexity [153] as key metrics for code implementation. He indicated that each program module is treated as a separate entity in these code metrics, hence the structure metrics are presented as useful metrics capturing interactions between modules in a software system.
6.2.2
Establishing Complexity Metrics
We refer to Section 5.3.1 for the description of main concepts of a Simulink model. In this section, we discuss existing Simulink measurement mechanisms and establish complexity metrics prior to introducing the metrics in the following section. There are several measurement tools built in Simulink, one of them being sldiagnostics [152]. It displays diagnostic information associated with the model or subsystem, providing measurements on number of each type of block, number of each type of Stateflow object, number of states, outputs, inputs, and sample times of the root model, names of libraries referenced and instances of the referenced blocks, as well as time and additional memory used for each compilation phase of the root model [152]. In the Simulink Verification and Validation toolbox, cyclomatic complexity is defined as a measure of the complexity of a software module based on the number of nodes, edges and components within a diagram [151]. For analysis purposes, each chart counts as a single component. Finally, as one of the mechanism for reducing the complexity of models Mathworks provided the MAAB guidelines [145]. However, these contribute to creating an aesthetically pleasing design, rather than serve evaluation purposes. It is essential to clearly define the attribute or property that is to be measured, since the design of a measurement method and metric heavily depends on it. In our work we define the complexity of a Simulink model as the property of a system showing the degree to which the (sub)system or its part(s) has a design that is difficult to create, understand, learn, analyse and test the system on a model level, as well as it is numerically challenging to simulate. Therefore, our definition encapsulates the human and machine aspects of complexity of Simulink models, respectively. The aforementioned definition considers aspects related to design complexity and testability of a system, as well as some views on the system related to how it is perceived by humans (visual representation of the models in Simulink). Our goal is not only to include the structure of the system and data flow view, but also the interrelations between (sub)systems (meaning subsystems and signals). Due to its visual representation and multiple Simulink-specific factors to consider, complexity of Simulink models embraces more facets than the complexity of written code. Therefore, our goal is to evaluate the complexity property with a collection of metrics. We consider structural, data complexity, as well as the stability of a system as indicators of complexity of (sub)systems.
102
6.3
Complexity Metrics Suite for Simulink Models
Motivation
Car buyers expect the product they own to be a safe and reliable operation. Particularly for safety critical systems it is important to prevent failures, which demands a very high level of testing, some of which is already mandatory by standards, e.g., ISO 26262. Fixing a software bug is inexpensive during an early development phase, but can rise up to millions of euros if a vendor needs to recall his cars to a dealers workshop for a simple software update. Some studies have shown, e.g., Curtis et al. [51], that complexity influences the time necessary to understand the code, and highly complex systems are more prone to error. Automotive software testing relies on “In the loop” methods, which test models before code before hardware before prototype cars. If defects can be detected early, it is cheaper, because after fixing the defect, all the preceding test steps need to be repeated, which costs money and time. The later in the process the defect is found, the more expensive this becomes. As the automotive industry is using model driven development, mainly with MATLAB Simulink, it is interesting to gain knowledge about complexity during the modeling phase. As Rakesh et al. [186] addresses, there are a lot of defect prediction methods to work on source code, but none at model level. It is possible to automatically generate code from models, but this is a time consuming step due to the various optimization imperatives. Logical errors may be introduced during design and not during code generation, hence test cases can be targeted at design. From a survey [15], we learned that software testers are dedicated personnel, who could benefit during design phase if they could address error prone (i.e., higher complex) parts in the earlier stages of design. As Curtis states [51], the design of methods has an influence on the ability of developers to understand a program. If a complexity metric can show which parts of a Simulink architecture are too complex, the model can be redesigned, therefore complexity metrics can be fundamental. The complexity metrics can be furthermore applied to the system and software architectural models. Since early 2000, a number of automotive Architecture Description Languages (ADLs) has been defined in the automotive industry. However, there is still a lack of quality evaluation of the models represented in these ADLs [60].
6.4
Simulink Complexity Metrics Suite
Since a modeler is basically working on a one-level-at-a-time basis, our metrics are defined per hierarchical level. In the following sub-sections, we first present the original metric as found in the software engineering literature and then the Simulink-specific metric we established. This is done in an iterative manner for each metric. However, the Halstead mapping is not described due to the commercial nature of the tool. Although McCabe and Halstead-based complexity metrics are mentioned by other researchers, the mapping to Simulink model is not publicly provided in the literature (in English). We include the structural and data flow complexity metrics by Olszewska (Plaska) [173, 174] inspired , by Card and Glass metrics [45], as well as instability and abstractness metrics based on object oriented concepts [148], since the evaluation of these metrics has not been carried out.
6.4.1
Cyclomatic Complexity
McCabe’s cyclomatic complexity calculates the number of linearly independent execution paths of the code [153]. Seeing a program as a control graph, G, the cyclomatic
6.4. Simulink Complexity Metrics Suite
103
complexity is calculated as the number of different paths the program can take. V (G) = E − N + P where V (G) is the cyclomatic complexity of a control graph G, E is the number of edges, N is the number of nodes, and P is the number of connected components or parts. For programs containing only binary decision nodes, we can apply the following calculation of cyclomatic complexity, which the number of decision nodes are counted [91, 154]. V (G) = number of decision nodes + 1 where, V (G) is the cyclomatic number of decision nodes, called predicates, including e.g., if, for, while, and switch. Simulink Verification and Validation software from Mathworks determines cyclomatic complexity metric, which approximates the McCabe complexity measure of the generated code from Simulink model. It uses the following equation for calculating cyclomatic complexity: N X mCM X = (oi − 1) i=1
where mCM X is the Mathworks complexity, N is the number of decision points that the object (such as a block, chart, or state) represents, and on is the number of outcomes for the nth decision point. One is added as a complexity number for atomic subsystems and Stateflow charts [151]. Cyclomatic complexity for Simulink is defined based on McCabe’s design complexity calculation. We extend the mapping between the C statements and Simulink control logic blocks [150] as shown in the Table 6.1. Table 6.1: Mapping between C and Simulink concepts. C statement Simulink blocks if-else If block, If Action Subsystem for For Iterator block, For Iterator Subsystem while, do- While Iterator block, While Iterwhile ator Subsystem switch Switch Case block, Switch Case Action Subsystem In addition, For Each Subsystem, Atomic Subsystem, and the number of case statements of the MultiPortSwitch block are also counted as decision statements. Hence the following equation is defined: mcCM X = P + 1 where, mcCM X is cyclomatic complexity and P is the total number of decision nodes (including atomic subsystems).
104
Complexity Metrics Suite for Simulink Models
6.4.2
Static Syntactical Complexity
Halstead introduced a set of software science metrics to measure computational complexity based on the operators (e.g., +, −, ∗, =) and operands (e.g., variables, constants) of a module. The following metrics are defined as part of the computation complexity [96]: n = n1 + n2 N = N1 + N2 V = N × log2 (n) n1 N2 D= × 2 n2 where, n1 is the number of distinct operators appearing in a program (+, ++, > etc. and return, if, continue etc.), n2 is the number of distinct operands appearing in a program (identifiers, constants), N1 and N2 is the total number of operators and operands, respectively. In the formulas, n represents the Program vocabulary metric, i.e., distinct operators and operands, N stands for the Program length giving the size of the program, V describes Volume, i.e., information contents of a program, D describes Difficulty, which corresponds to complexity. Halstead metrics for Simulink is represented in the same manner as in the original version. We, however, map the concepts to Simulink concepts as illustrated in Figure 6.1:
Figure 6.1: Halstead concepts for Simulink. • n1 is the number of distinct Simulink block types e.g., Divide, Gain, Product; • n2 is the number of distinct input signals; • N1 is the total number of Simulink blocks; • N2 is the total number of input and output signals. We use hCM X D for D and hCM X V for V respectively.
6.4.3
Information Flow Complexity
Henry-Kafura defined complexity as a function of fan-in and fan-out to determine the information flow between different modules1 as a formula: Cp = length ∗ (fanin ∗ fanout)2 1 There
are some hybrid versions of the formula, see e.g., [213] and [101].
6.4. Simulink Complexity Metrics Suite
105
where, Cp is complexity of module p, length is measured as the lines of code, the fan-in of procedure p is the number of local flows into procedure p plus the number of data structures from which procedure p retrieves information, and the fan-out of procedure p is the number of local flows from procedure p plus the number of data structures which procedure p updates [100]. For the Simulink information flow complexity, we defined the following metrics based on the Henry-Kafura’s metrics. hkCM X = size ∗ (fanin ∗ fanout)2 where, hkCM X is the information flow complexity of a subsystem, S, size is the number of contained blocks (including subsystem blocks), fanin represents the number of source blocks of a subsystem, S and fanout represents the number of target blocks of a subsystem, S. We use hkCM X notation for the hkCM X.
6.4.4
Structural and Data Complexity
Card and Glass defined structural, data, and total complexity metrics for systems: S=
n X f 2 (i) i=1
n
V (i) f (i) + 1 D= n T =S+D where, Structural complexity, S, is the mean of squared values of fan-out per number of modules, f (i) is fan-out of module i and n is a number of modules in the system; Data complexity, D, is a function that is dependent on the sum of Input/Output variables and inversely dependent on the number of fan-out in the module; T is the Total complexity [45]. This is a theoretically sound metric set, however empirical investigation of the validation of the metrics is needed. For structural and data complexity of Simulink models, the Card and Glass metrics are used as it is and modules are changed into subsystem blocks, I/O variables are mapped to the arrows (signals) entering and exiting the subsystem block for input and output, respectively. The metrics are reformulated as: • Structural complexity (CM X S) is related to coupling of a system, and measures the mean of squared values of fan-out per number of subsystem blocks, where f (i) is fan-out of subsystem block i and n is a number of subsystem blocks in the system. • Data complexity (CM X D) is related to cohesion of a system, and it is a function that is dependent on the sum of Input/Output variables and inversely dependent on the number of fan-out in the subsystem block. • Total complexity (CM X T ) is defined as the sum of the structural and data complexity.
106
6.4.5
Complexity Metrics Suite for Simulink Models
Dependency Metrics
The dependency metrics of (in)stability, abstractness, and distance indicate how easily the system (or a block or subsystem) can be changed in terms of dependency and abstractness of the system. They are an indicator of a good design, where “goodness” of the design is inversely proportional to complexity. Scheible’s instability metric calculates the average stability of the blocks of a Simulink model. It is based on the work of Menkhaus and Andrich [158] and calculated as following: P Sch Inst =
b�blocks
fanin(b) fanin(b)+fanout(b) size
where, f anin(b) is the number of fan-in blocks of a block b, f anout(b) is the number of fan-out blocks of a block b, and size is the number of contained blocks. In Scheible’s metric, the fan-in and fan-out blocks are called predecessor and successor blocks, respectively. It is indicated that a block with more fan-in blocks as fan-out blocks has a higher probability of change (the more fan-in blocks for a block, the more likely that it has to be changed to adapt the fan-in blocks) [209]. We define the instability metric for Simulink models as the number of efferent couplings between blocks (CeB) divided by the sum of efferent (CeB) and afferent couplings between blocks (CaB), which is given by the equation: dCM X I =
CeB CeB + CaB
where, Instability of a (subsystem) block is dCM X I, the number of efferent couplings between blocks is CeB, the number of afferent couplings between blocks is CaB. Afferent coupling between blocks (CaB) is measure of the total number of external blocks linked to a given block due to incoming signal within one layer. In other words, it is the number of destination blocks for the block under analysis. Efferent coupling between blocks (CeB) is defined as the number of blocks that are linked to a given block due to outgoing signal within one layer, i.e., it is the number of source blocks for the given block. Values range from 0 (no incoming signals), dCM X I = 0 denotes a completely stable (subsystem) block to 1 (only incoming signals), dCM X I = 1 signifies a maximally instable (subsystem) block. We define the abstractness metric for Simulink Models as a ratio of the number of subsystem blocks to the total number of blocks: dCM X A =
N aB NB
where, dCM X A is the abstractness, N aB is the number of subsystem blocks, and N B is the total number of blocks. Values range from 0 (denotes a concrete block) to 1 (represents a completely abstract block). We define the distance metric for Simulink models as the relationship between instability and abstractness. It is computed as a normalised sum of these values decreased by one: dCM X D = |dCM X A + dCM X I − 1|
6.5. Evaluation
107
Figure 6.2: Fault-Tolerant Fuel Control System [3]. where, dCM X D is distance, dCM X A is abstractness, and dCM X I is instability. Values range from 0 (desirable: blocks are either totally stable and abstract (scenario dCM X I = 0 and dCM X A = 1)) to 1 (or entirely instable and concrete block (dCM X I = 1 and dCM X A = 0).
6.5
Evaluation
We developed a complexity analysis tool to automatically measure the complexity metrics defined in Section 6.4.
6.5.1
Fuel Control System Evaluation
We applied the complexity metric suite to a Fault-Tolerant Fuel Control System (FCS) from Mathworks Simulink Example Library [3] which represents a fuel control system for a gasoline engine. Figure 6.2 shows the top level of the FCS system. The subsystem fuel rate control uses signals from the system’s sensors to determine the fuel rate. The fuel rate combines with the actual air flow in the engine gas dynamics model to determine the resulting mixture ratio as sensed at the exhaust [3]. The purpose of the evaluation of the FCS system is to compare the complexity metric suite measurement to Mathworks’ complexity evaluation of the FCS system. The FCS system consists of 25 subsystems and the maximum hierarchical depth is 5. The complexity measurement of the FCS is provided in Table 6.2. The first column lists the subsystems contained in all hierarchical levels of the FCS. The second column (CM X M ) contains the Mathworks complexity metric values. The third column (N CS) lists the number of contained subsystems. The other columns contain the complexity metrics values defined in Section 6.4. We carried out the Kendall’s τ correlation analysis [83] on the complexity metric suite and Mathworks’ cyclomatic complexity metric. According to the Mathworks’ complexity analysis, sldemo fuelsys, fuel rate control, and control logic subsystems are considered the most complex and To Controller, To Plant, and validate sample time subsystems are considered the least complex subsystems. We identified that the Mathworks complexity metric (CM X M ) is strongly correlated to the size metric, number of contained
108
Complexity Metrics Suite for Simulink Models Table 6.2: Complexity Measurement of Fault Tolerant Fuel Control System.
subsystems (N CS) i.e., it has a strong correlation (r = 0.734). We accept a common significance level of 0.05. The three most complex subsystems identified by the Mathworks’ metric are in fact composite subsystems. The three least complex subsystems have less complexity according to our metric suite. In addition, we identified that the other complexity metrics provide more insight into the complexity analysis. The cyclomatic complexity (mcCM X) metric identifies that the subsystem Throttle is the most complex, which is complemented by the higher values of Halstead, Henry-Kafura, and instability metrics.
6.5.2
Expert Evaluation
We have compared expert evaluation of the complexity metrics. The evaluation process involved five senior architects, who are responsible for modeling automotive software within one vehicle manufacturer at different architectural levels, ranging from functional architecture to Electrical/Electronic (E/E) architecture. All the architects had a Master of Science (MSc) degree in mechanical or electrical engineering and had more than 10 years experience in the automotive domain. One architect had a PhD in mechanical engineering. Domain experts evaluated a number of randomly selected subsystems of an automotive application using a scale of 1 to 10, 1 meaning the least complex and 10 meaning the most complex. The 1-10 scale was chosen due to expert’s familiarity with the scale. The expert group consisted of five experts with a role of a functional architect, a developer, and a tester. Although there are in general no major inconsistencies between the experts, the developer and tester would provide lower complexity score given their familiarity with the system under review. The following complexity characteristics were recognized from the experts’ feedback. • Complexity vs. Analysability: If difficult blocks (e.g., flip flop, unit delay, hit crossing) and many feedback loops are used, then the model is considered complex
6.5. Evaluation
109
Figure 6.3: Expert’s evaluation: Complexity vs. Quality attributes and difficult to analyze. • Complexity vs. Understandability: Too many input/output signals, hierarchical levels, parameters, and unclear naming of subsystems make it complex and difficult to understand. Whenever the number of input signals are high, used algorithms are not complex then the model is considered not complex. • Complexity vs. Testability: Too many parameters make the model complex and difficult to configure correctly. Many dependencies with other modules make the model complex as well. Besides the complexity (’ExpCmx’), domain experts evaluated understandability (’ExpUnd’), analysability (’ExpAnz’), and testability (’ExpTst’) of the system also using the scale of 1 to 10. According to the expert’s evaluation as illustrated in Figure 6.3, all three quality attributes are related to complexity. In the expert evaluation, however, analysability and understandability are referred to further details when providing comments for the complexity grading.
6.5.3
Correlation Analysis
We carried out a correlation analysis on the second automotive application to detect a relation between complexity metrics and the number of defects. We used the data
110
Complexity Metrics Suite for Simulink Models
collected from the second automotive application consisting of 40 subsystems, from which half of the subsystems contain defects because of proprietary library subsystems. Since there are a number of tied values and we aim to establish if any complexity metric and the number of faults are statistically correlated rather than measuring the degree of the linear relationship between variables, we use the Kendall’s τ correlation test as used in our modularity assessment of Simulink models [61]. The correlation coefficient infers the strength and direction of the correlation meaning a positive correlation coefficient indicates a positive relation between the metrics and defects and a negative correlation coefficient indicates a negative relation. The significance points to a probability for a coincidence. We accept a common significance level of 0.05. According to the correlation analysis, the structural complexity CM X S, data complexity CM X D, total complexity CM X T , abstractness dCM X A and block instability dCM X I metrics are positively correlated with the number of faults. This may imply that the subsystems with higher number of fan-out subsystems and instability can be more prone to faults.
6.6
Discussion and Threats to Validity
We have defined and implemented a complexity metric suite based on the well-known complexity metrics from the software engineering field. Although Mathworks provides a cyclomatic complexity metric, we identified that it has a strong correlation with the size of the subsystem. Although the novelty of the definition of the Simulink complexity metric suite could be argued, the mapping of the complexity metrics from code to Simulink models is not publicly shared. It could be due to the competitive nature of the automotive industry. Furthermore, the tools available to analyze the complexity models do not share the description of the metrics explicitly. Therefore, the lack of descriptions makes the application of the metrics extremely challenging. Complexity metrics are developed in a proprietary setting. Therefore, applying this model to a generic automotive system needs further investigation. Also the selection of metrics can be too practical, since the metrics were defined based on the literature and inputs from domain experts. The domain experts involved in the qualitative analysis evaluated the models based on 1-10 scale and we used the mean of the evaluations for each of the quality attributes. Another potential threat to validity stems from the limited number of domain experts involved in the evaluation, which is due to their restricted time and availability for the evaluation of the software quality. However, to increase the number of participants for the evaluation task by involving students or engineers with less expertise may not be representative of practical model engineering tasks. Furthermore empirical studies are needed to validate the selection and application of complexity metrics on larger scale data.
6.7
Related Work
Metrics for Simulink have already been used to evaluate the impact of changes to the complexity and coupling properties of automotive software systems [69]. The authors used two metrics: structural (Henry-Kafura) and coupling (Gupta and Chhabra) in order to verify that certain quality attributes have not deteriorated. They also used metrics to implicitly increase the product quality with respect to stability, reliability and maintainability. In our work we use several complexity metrics, which tackle different
6.8. Conclusions and Future Work
111
perspectives of the Simulink model complexity. Furthermore, we focus on other quality sub-attributes, defined by the experts as the ones the most impacted by the complexity characteristic, i.e., understandability, analysability and testability. The authors [107] build their quality model based on ISO/IEC 9126 and specify it for the MATLAB/Simulink/Stateflow environment. A package of metrics for the assessment of complexity was used, i.e., Halstead, McCabe, Henry and Kafura metrics. The authors claim that it gives an overall assessment for a whole model or a specific subsystem. However, the mapping of these metrics for Simulink models is not presented in the paper. Moreover, Hu et. al tackled the stability quality attribute by computing average slice per input signal, yet no description of this metric was given. This lack of descriptions is also the case for other metrics, which makes the application of the metrics extremely challenging. Furthermore, the tools e.g., Klockwork’s SCA [123], Model-Engineering Solutions’ M-XRAY [162], and CQSE’s ConQAT [49] are commercial, therefore the metrics defined for the source code and Simulink models are not publicly available. This makes it difficult to reproduce the complexity evaluation and makes it necessary to define publicly available complexity metrics for Simulink models. Simulink models have been investigated quantitatively [174], where the authors proposed a list of direct measurements, in addition to metrics based on Card and Glass complexity model. Later work [172] extended the Simulink metrics with instability and abstractness, as well as the distance metrics, which were described as indicators of “goodness” of a design.
6.8
Conclusions and Future Work
Complexity of produced software systems is an issue regardless of the application domain, as it is closely linked to the cost of the development. In particular, in safety-critical domains, like automotive, quality, and thus complexity, is of utmost importance. In addition, lower complex systems are easier to fulfill 100% coverage by a finite number of test cases, which decreases the development cost and increases the quality. Nowadays, cars can be seen essentially as big computer systems consisting of multiple components running various software. There is a need for mechanisms to efficiently monitor the complexity of the automotive software systems, particularly in the early stages of development cycle, for example at the modeling stage, as it is more economical and beneficial. A plethora of commercial tools are able to perform tests and verification at the source code level, e.g., Astr´ee [111] or Polyspace [149], but generating the code from Simulink models increases the likelihood of failure due to no optimal code generator settings or even bugs in the code generator. Furthermore, it would decrease the development time and cost if complexity analysis at model level can be performed. In this chapter, we defined the complexity metrics suite for the Simulink modeling language. Furthermore, we identified the relation between complexity characteristic and other quality attributes, e.g., understandability, analysability and testability. A preliminary analysis provided a strong correlation between some of the complexity metrics and the number of errors. Future work may consider continuing this research on two levels: (a) refining the established metrics and (b) linking them to standards and architectural complexity models, e.g., Software Architecture Complexity Model (SACM) [31]. The former refers to including the factors that additionally impact the complexity of Simulink models, to the existing Simulink complexity metrics suite. The preliminary discussions with experts showed
112
Complexity Metrics Suite for Simulink Models
that apart from the number of incoming signals (single signal or a bus) or depth of a (sub)system, there are also other elements that need to be addressed. These include loops in the model (also empty loops), algorithms and computations, number of GoTo statements, number of parameters of the models or documentation and model description. For some of these factors it is not sufficient to have metrics based on simple count; rather, some further cognitive analysis may be needed. Furthermore, we need to determine if Simulink operations can be weighted based on the difficulty and complexity level. Complexity metrics can be evaluated further in the specific functional domains of automotive embedded systems. These include vehicle-centric functional domains (including powertrain control, chassis control, and active/passive safety systems) and passengercentric functional domains (covering multimedia/telematics, body/comfort, and Human Machine Interface (HMI)) [166]. In addition, the relationship between the complexity metrics suite and standards specific to a functional domain such as IEC 51508, ISO 26262 and modeling guidelines e.g., MISRA can be explored further. Moreover, an architectural complexity model can be built comprising of quality attributes originating from the ISO 25010 standard and linking them to the metrics suite we established. For that purpose the existing quality and architectural complexity models need to be examined in more detail and associate the metrics and quality attributes to the role of the person in the development (tester, calibrator, developer, and maintenance staff). Operationalization (e.g., interpretation models, aggregation method, and defining weights) is considered useful to improve the understandability and applicability of quality attributes [238], therefore operationalization of complexity needs to be carried out to make it easy to understand by the stakeholders.
Chapter
7
Managing Clone Mutations in Simulink Models
Like any software system, real life Simulink models contain a considerable amount of cloning. These clones are not always identical copies of each other, but actually show a variety of differences from each other despite the overall similarities. Insufficient variability mechanisms provided by the platform make it difficult to create generic structures to represent these clones. Also, complete elimination of clones from the systems may not always be practical, feasible, or cost-effective. In this chapter we propose a mechanism for clone management based on Variant Configuration Language (VCL) which provides a variability handling mechanism. In this mechanism, the clones are managed separate from the models in a non-intrusive way and the original models will not be polluted with extra complexity to manage clone instances. The proposed technique is validated by creating generic solutions for Simulink clones with a variety of differences present between them.
7.1
Introduction
Software clone detection is a well established and mature field with continually increasing research and tool development [128, 190, 203]. In software development, copying code fragments and pasting them with or without modifications in other code sections are common practice. This process is called software cloning and the copied code is called software clone [190]. Maintaining software clones can lead to high maintenance costs [39], because a bug detected in one section of code needs to be fixed in all related code fragments [190]. The majority of existing software clone detection techniques are code based, which means the clones are detected in the source code written in different programming languages. Compare to code clone detection field, model clone detection is a new and not well-researched field [203]. In the model clone detection field, clones are identified in higher-level software models instead of source code. Our need for model clone detection techniques stem firstly from the prominence of the model-driven development in many domains and secondly detecting clones (redundancies) earlier in the models have higher impact on the lower levels [203].
114
Managing Clone Mutations in Simulink Models
In recent years, model clone detection techniques have been developed for Simulink models [12, 48, 63, 64, 119, 181, 203]. Simulink models can be comprised of thousand of elements and are maintained over long periods by organizations. In these situations, cloning becomes a relevant problem [12]. Similar to the code clones, separately maintaining multiple similar parts of models could increase costs, and inconsistent changes to cloned parts could lead to incorrect or undesired system behavior. Completely eliminating clones from the systems may not always be necessary, practical, feasible, or cost-effective. A viable alternative is to perform clone management. This is especially relevant for product line based development of similar systems, where clones represent reusable pieces of functionality, and their integration in a central repository is a basic task for the development of product lines. To be viable, clone management techniques require a representation of the clones that could provide a powerful parameterization mechanism to capture all kinds of variations that could possibly exist between clone instances, and is robust to evolutionary changes. Model variants exhibit a range of differences. Similar to code clones, Type-1 (exact), Type-2 (renamed), and Type-3 (near-miss) model clones have also been identified [12]. These clone types are demonstrated for Simulink models in Section 7.2. Model clones can also occur across multiple layers [12]. A challenge is to unify all types of possible differences between model clones with a single variability management technique, which can facilitate the maintenance effort for a large model set. To date, no clone management technique has been proposed for Simulink models. A basic requirement for clone management is a powerful variability management technique. Simulink provides a basic variability mechanism with its Variant Subsystems but this mechanism is only meant for simulation and increases the size and complexity of the models. A Variant Subsystem contains two or more child subsystems, from which only one child subsystem is active during model execution [110]. Another option is to model variability with general-purpose blocks like Switch blocks or if-action blocks for the selection of alternative variants [95, 210]. Another problem here is that it is not obvious if a Switch block is for the selection of variants or to control the signal flow. There is no possibility to remove unnecessary variability information and reduce a variant-rich model to a specific system model [139]. This results in the intermixing of functionality and variability handling mechanisms in the models, violating the principle of separation of concerns [210]. We propose a clone management framework for Simulink models based on Variant Configuration Language (VCL) [7]. VCL provides unrestricted parameterization of textbased artifacts. As Simulink also provides an equivalent textual representation of its models, this does not pose a limitation for the proposed solution. VCL based solution is non-obstructive as the variability handling concern is addressed separately from the functionality concern. Because of the powerful parameterization of VCL, we can define variants capturing any kind of differences that could be present in clones. Finally, with VCL we can also define new variation points to a generic structure without affecting the existing variants. In our proposal, we define separate roles for model developers and model managers with regard to clone management to clarify the description of the process, although the same person can fulfil these roles at different times. VCL based generic clone representations are developed by model managers and stored in a clone repository. Colors are used to tag the different parts of the Simulink models for cloning status and these tags are updated when the cloning status is changed. Finally, we validate our technique by creating generic representations of a number of clones exhibiting a variety of differences.
7.2. Background
115
(a) An Engine Dynamics subsystem of the sldemo engine model [110].
(b) An Engine Dynamics subsystem of the sldemo enginewc model [110].
Figure 7.1: A Type-1 model clone. The rest of the chapter is organized as follows. In Section 7.2, we provide the background information about the Simulink model clones and VCL. In Section 7.3, we describe the details of our proposed approach for model clone management and in Section 7.4, we validate our approach. Section 7.5 discusses the related work and Section 7.6 concludes the chapter and discusses the future work.
7.2
Background
In the following sections we present the main concepts for Simulink model clones and Variant Configuration Language (VCL), which are used in the Simulink clone management approach that we propose in Section 7.3.
7.2.1
Simulink Model Clones
Simulink model clones are categorized into the following three types [13], which are similar to the categorization used in the code clones: • Type-1 (exact) model clones: Identical model fragments except for variations in whitespace, comments, layout and formatting. Figure 7.1 illustrates an example of a Type-1 model clone (Engine Dynamics subsystem), which is included in both engine timing models, namely sldemo engine (with a triggered subsystem) in Figure 7.7a and the sldemo enginewc (with a closed-loop control) in Figure 7.7b. The Engine Dynamics subsystem is identical in both engine models except for a slight variation in layout (positions of some blocks and signals vary slightly). However, it is still considered an exact model clone in Simulink models.
116
Managing Clone Mutations in Simulink Models
(a) A Requisite Friction subsystem of the sldemo clutch if example model [110].
(b) A Friction Calc subsystem of the sldemo clutch if example model [110].
Figure 7.2: A Type-2 model clone. • Type-2 (renamed) model clones: Structurally identical model fragments except for variations in labels, values, and types, in addition to variations in Type-1 i.e., whitespace, comments, layout and formatting. Figure 7.2 illustrates an example Type-2 model clone between different subsystems, namely the Requisite Friction in Figure 7.2a and the Friction Calc subsystem contained in the same sldemo clutch if example model as shown in Figure 7.2b. Blocks (inports and outports) have different names in addition to variation in layout. • Type-3 (near/miss) model clones: Model fragments with further modifications such as changed, added or removed blocks or lines, in addition to the variations from Type-1 and Type-2 clones. Figure 7.3 shows an example Type-3 model clone between Rich Mode and Low Mode subsystems contained in the same sldemo fuelsys example model, shown in Figure 7.3a and 7.3b respectively. The Discrete Filter block is moved to another location in addition to variations in block names and layout.
7.2.2
VCL
Variant Configuration Language (VCL) [7] is a variability management technique with a syntax inspired by C preprocessor (cpp). It is an enhanced version of XVCL, which is a dialect of XML and uses XML trees, a parser for processing [118, 171]. VCL does not
7.2. Background
117
(a) A Rich Mode subsystem of the sldemo fuelsys example model [110].
(b) A Low Mode subsystem of the sldemo fuelsys example model [110].
Figure 7.3: A Type-3 model clone. use XML syntax and processing, instead it extends the capabilities of the basic cpp to better manage software variability, including the product line scenario [7]. VCL organizes and instruments the base code for ease of adaptation and reuse during development and evolution of system variants. VCL allows instrumenting the source code for customization at any level of details. VCL Processor goes through the base code, executing VCL commands to generate a required system variant. VCL parameters exercise control over the VCL processing separately from the base code. VCL offers a flexible and user-defined syntax. The VCL default syntax is based on cpp, but full support is provided to modify this syntax. If VCL hashtags conflict with reserved hashtags in a program, a VCL user can easily change the syntax of some or all of the VCL commands. The overall scheme of operation of VCL is similar to that of cpp. However, compared to cpp, VCL gives better control over the process of synthesizing system variants from the base code, leading to more generic and reusable base code components. VCL’s ability to organize base code in a way that replaces any significant pattern of repetition with a generic, adaptable VCL representation, leads to significantly smaller base code and is much simpler to work with. In Figure 7.4, we illustrate an example of VCL. A VCL Processor starts processing with the specification (SPC) file (in blue). The SPC file contains a set of VCL commands. The VCL values assigned in #set commands are the same as the cpp variables assigned in #define commands, except that the VCL variable values propagate to all adapted source files (#adapt links) [7, 62]. Single and multi-value variables can be declared in the VCL #set command. VCL #adapt file command is same as cpp #include, except that the source file can be modified in different contexts in which it is adapted [7, 62]. In the SPC file example in Figure 7.4, “SavingsAccount” value is assigned to the classname variable and two different message values are assigned to the messages variable. Since only one
118
Managing Clone Mutations in Simulink Models
file is configured to be adapted in the SPC file, the VCL Processor starts processing the “Account.vcl” file (in yellow) when it encounters the #adapt “Account.vcl” command. The VCL Processor generates any source code found in the visited files [7,62]. Therefore, when the VCL Processor encounters the #output?@className?”.java” command in the “Account.vcl” file, it emits the output to “SavingsAccount.java” file (in green) as shown in Figure 7.4. In a loop command (#while command ) of the “Account.vcl” file, the variable messages is iterated over. Therefore, both messages are generated in the “SavingsAccount.java” file.
7.3
Approach
In our proposal, we differentiate between the roles of model developers and model managers (similar to the role of frame engineers proposed by Bassett [24]). The same person could be playing both roles, but for the sake of identifying relevant responsibilities, we describe the proposal in terms of these distinct roles. We start with a given set of clones identified in a Simulink model or a group of models. There are tools available for detecting clones in Simulink models [12] [64]. SIMONE [12] works with the textual representation of Simulink models and reports clones in the form of clone classes and clone pairs. It detects not only type-1 and type-2 clones but also reports type-3 clones. SIMONE reports only similar subsystems as clones. ConQAT [64] detects clones using a graph matching technique and also reports clones at the block level. However, it only detects type-1 and type-2 clones. Our proposed technique can work with the output from any of these tools, but subsystem level clones gives a more crisp boundary for a reusable element in Simulink, and therefore is preferred by our approach. The responsibility of clone detection lies with the model manager role. From the detected clones, the model manager will decide which clones need to be managed. Various
Figure 7.4: VCL Example [7].
7.3. Approach
119
Run clone detection
Select a clone class for unification
yes
no
Any clone classes left for unification?
Identify variation points and variants
Create VCL representation and store in repository
All clone instances are colored green
Figure 7.5: Flow of activities for the Model Manager. clone related metrics can be used to identify clones that are of importance to the developers and should be consistently maintained [63]. These selected clones are manually converted into VCL representation and placed in a clone repository. In the actual Simulink models, we mark each subsystem that is generated from a VCL managed clone by a unique color, as in [139]. As discussed in [223] and [12], blocks, lines, ports and branches could be reordered in the textual representation of type-1 model clones. For SIMONE, these elements are sorted before clone detection [12]. For our proposed solution, we can safely sort these elements in the generic representation with VCL. Although we can generate the exact ordering of these elements for each clone instance, as it was before sorting, but we do not need this extra complexity in the generic representation as the sorted and unsorted subsystems would be functionally and graphically equivalent in the resulting Simulink model. Figure 7.5 shows the workflow for the model manager role. When a model developer (Figure 7.6) needs to reuse a subsystem from another part of the model or from another model, there could be two possibilities. Either this subsystem is an existing clone that has a VCL representation in the repository or it is the first cloning of a subsystem. In the former case, the developer would generate the configured clone from the VCL representation of the managed clone in the repository for the new use, while marking this new copy accordingly. For the latter case, the developer will clone
Locate subsystem to clone
yes Subsystem is Green
Customize clone from repository
no Copy, paste, and modify the subsystem in the new context
The two copies of the subsystem are clored red
Figure 7.6: Flow of activities for Model Developer.
Concrete subsystem is generated
120
Managing Clone Mutations in Simulink Models
(a) Subsystem A.
(b) Subsystem B.
Figure 7.7: Two subsystem clones differing in positions only. the existing subsystem and reuse it in the new place. In this case also, the two copies will be marked with another unique color indicating the presence of a clone that has not yet been stored in the repository. This marking will act as a signal for the model manager to create a VCL representation of this new emerging clone with suitable variation points and variants. When the developer selects a clone from the repository for reuse, she will be presented with a list of variation points for the selected clone, and a list of previously existing variants to choose from for each variation point. The developer can only configure the new clone instance by selecting from these predefined variants for a variation point and is not allowed to create new variants or new variation points. For every variation point, there will be a default variant. When the developer has completed the configuration, a concrete subsystem is generated based on the developer’s selection of variants and the developer can now use this block where required. If the developer modifies a generated copy of a clone in ways other than those captured by the VCL representation, the block is marked with a third unique color. The model manager will later analyze these clones to examine the extent of changes made to them. If the changes are few, this instance could be merged with the generic version in the repository by defining new variation points or new variants for the existing variation points. Because of the flexibility provided by VCL, there are almost no restrictions on the variants that could be provided at a variation point. However, if the new changes have made this copy significantly different from the original clone, the model manager can also choose to remove this particular instance from the clone class completely.
7.4
Validation
The most important aspect of the proposed mechanism is to effectively handle the wide range of variability that could possibly be present in the clones. To validate the feasibility of VCL for capturing all kinds of variations, we created numerous Simulink subsystems
7.4. Validation
121
System { Name "Subsystem" Location ?@subsystem_location? Open on ModelBrowserVisibility on ModelBrowserWidth 200 ScreenColor "white" PaperOrientation "landscape" PaperPositionMode "auto" PaperType "usletter" PaperUnits "inches" TiledPaperMargins [0.500000, 0.500000, 0.500000, 0.500000] TiledPageScale 1 ShowPageBoundaries off ZoomFactor "100" Block { BlockType Sum Name "Add" SID "1" Ports [2, 1] Position ?@sum_position? ZOrder 2 InputSameDT off OutDataTypeStr "Inherit: Inherit via internal rule" SaturateOnIntegerOverflow off } Block { BlockType Outport Name "Out1" SID "4" Position ?@outport_position? ZOrder -2 IconDisplay "Port number" } Line { SrcBlock "In1" SrcPort 1 #break line1_points DstBlock DstPort } Line { SrcBlock SrcPort
"Add" 2
"Add" 1
#break line2_points DstBlock DstPort } }
"Out1" 1
Listing 7.1: Annotating the subsystem with VCL commands.
forming clone pairs. Each clone pair captures only one form of variation. Using VCL commands, we created generic solutions for each of these clone pairs.
122
Managing Clone Mutations in Simulink Models
#set subsystem_location = "[596, 16, 1412, 554]" #set sum_position = "[240, 80, 270, 120]" #set outport_position = "[355, 93, 385, 107]" #output "Layout2a_Position.mdl" #adapt "Layout2a_Position" #set subsystem_location = "[3, 15, 819, 553]" #set sum_position = "[245, 135, 275, 175]" #set outport_position = "[360, 103, 390, 117]" #output "Layout2b_Position.mdl" #adapt: "Layout2b_Position" #insert line1_points Points #endinsert
[47, 0; 0, 55]
#insert line2_points Points #endinsert
[37, 0; 0, -45]
#endadapt
Listing 7.2: Configuring the two subsystems with VCL.
Overall, we captured all possible forms of variations listed by Stephan et. al [223]. These include: • different layout (color, position, size, other attributes) of elements; • different ordering of elements (blocks, lines, ports, branches); • different names of elements (blocks, lines); • different values of elements (blocks); • added or deleted block; • changed block type. A concrete example of a clone pair, its corresponding generic subsystem annotated with VCL, and its configuration to regenerate the original subsystems, are shown in Figure 7.7, Listing 7.1 and 7.2 respectively.
7.5
Related work
Leitner et. al. [139] uses pure::variants Connector for Simulink to handle structural variability in Simulink models. They identify common variability scenarios from the industry, and propose a 3-layered template based mechanism to abstract the variability implementation. Like our approach, they also hide variability mechanism from the developers. However, we do not need any extra blocks to achieve this goal. A variety of clone management techniques have been proposed for code-based software systems. Toomim et al. [229] attempted to keep consistency among clone members by linked editing of the clone members. Baxter et al. [25] eliminate clones automatically using macros. Recently, solutions are being sought for manual clone management instead
7.6. Conclusion and Future Work
123
of a fully automatic refactoring tool, as the elimination of clones may not always be viable. Duala-Ekoko et al. [67] use a descriptive language to help track of clones over software evolution. However, this description language is specific to object-oriented languages like Java and C++.
7.6
Conclusion and Future Work
In this chapter we have proposed a clone management framework for managing Simulink model clones. The benefits of using VCL as the variability technique includes separating the variability concern from the functionality concern. The variability mechanism has been validated by converting a number of clone pairs with a varied set of differences into generic representations of VCL. Furthermore, empirical evaluation of the approach can be carried out in the future. In addition to the clone detection tool for Simulink models, we also need a clonematching tool whereby we can search for other copies of a known clone in the newly developed parts of a model. For future work the use of parameterized contracts to software components [193] can be investigated to enhance the reusability of the VCL representation. Visual rendering to VCL frames would be beneficial. In this manner, cloned subsystems will have extra property pages at configuration time to concretize the block/subsystem before using it.
Chapter
8
Conclusions
This chapter summarizes the contributions of this thesis and discusses the directions for future research. The main results and conclusions of this research are provided for each of the research questions stated in Chapter 1.
8.1
Contributions
As software becomes more and more important for automotive systems, the new discipline called automotive software engineering has emerged as an intriguing field which introduces new solutions or adopts existing methods for automotive software and electronics systems from the software engineering discipline. More than a decade ago a list of emerging challenges and research directions were presented in the scope of the automotive software engineering field [37]. However the amount and complexity of technical and research challenges that automotive companies face today are even higher due to the increasing role of software for automotive innovations. The software work package for the Hybrid Innovations for Trucks (HIT) multi-disciplinary project needed to tackle two main issues, namely a suitable architecture modeling method and a quality technique to enable the development of more efficient control software. These issues are considered vital in the automotive software engineering field in general [37, 166, 208]. The first research question was formulated to address the automotive software architecture issue. RQ1 : What architecture description mechanisms can be employed to support automotive architectural modeling at different architecture viewpoints? To address this question, in Chapter 2 we evaluated the existing architecture description mechanisms for the automotive industry, as well as their benefits and gaps. Based on this literature review we have proposed an Architecture Framework for Automotive Systems (AFAS). The AFAS fills a gap that was identified during the evaluation, namely the lack of the consistency between the Architecture Description (AD) elements in the
126
Conclusions
existing architecture description mechanisms, Architecture Frameworks (AFs) on the one hand and Architecture Description Languages (ADLs) on the other hand. Therefore, in Chapter 3, we presented the results of the comparison between automotive-related ADLs based on the automotive architecture modeling requirements, which were elicited from interviews with automotive domain experts. SysML was selected as an ADL which satisfies the main modeling requirements, from the options of EASTADL, TADL, AML, SysML, and MARTE. We then evaluated the usability of SysML diagram types for automotive architecture modeling. While similar case studies can be found in the literature [16, 20, 187, 215], they gloss over the reasons why a certain diagram type has been selected. Therefore, the conclusions from these case studies are not a priori applicable to the specifics of the HIT project. Therefore, we have conducted a separate case study using IBM Rational Rhapsody supporting SysML and compared the SysML diagrams with those created by an OEM using proprietary approaches. The resulting selection of the SysML diagram types concurs with the earlier results [16, 20, 187, 215] and provided further a rationale for the selection or de-selection of a certain diagram type. The main conclusion was that SysML satisfies the main requirements of architecture modeling at all abstraction levels from functional to Electrical/Electronic (E/E) architecture. However, SysML and its supporting tool need further improvement or extension on modeling architectural elements e.g., mapping signals between different architectural levels, and interfacing with complex Simulink models. The key problem seems not to be SysML’s inability to model the desired architectures, but rather its flexibility to enable too many different solutions. Based on the conclusion of the SysML case study, we recommended the OEM to start a pilot project with IBM Rhapsody within its industrial setting. After the successful completion of the pilot project by the OEM, they have decided to apply SysML and IBM Rational Rhapsody in an advanced modeling project [108]. The second research question was derived during the process of defining the AFAS framework. It was formulated to address the consistency between automotive architecture views. RQ2 : How can we formalize the correspondence rules between automotive architecture viewpoints? It is crucial to define correspondence and correspondence rules for an automotive AF and ADL, which consist of multiple architecture viewpoints. Indeed, correspondence and correspondence rules would facilitate the communication between different automotive architects and domain experts, since a model is typically incrementally constructed in close cooperation between (multi-disciplinary) domain experts. We have observed that without the explicit correspondence rule enforcing relations within an AD or between ADs, the communication between architects can be cumbersome and require ad hoc descriptions to the refinements made at the architectural models at different architectural views. For example, a functional architecture model is delivered to the software architect, who would refine the given model. However, without the formal definition of the correspondence between functional and software viewpoints, architects need to explain why certain refinements are made to the given model. In Chapter 4 we addressed a similar issue which discusses the situation whereby the functional model is developed by an OEM and refined by a supplier. Therefore, facilitating communication between an OEM and a supplier would save not only time, but also cost. To address this practical problem, we investigated the consistency checking approaches in the software architecture field and developed an inconsistency detection approach based on the correspondence rule between automotive architecture views. Existing approaches
8.1. Contributions
127
for architecture consistency checking generally cover the issues related to the consistency between the software architecture model and its counterpart model (sometimes called an implementation model) that is reverse engineered or reconstructed from the source code. Specifically, consistency checking for UML diagram types (between structural and behavioral diagrams) is a well-researched area. Our approach is inspired by languageneutral mechanisms [34, 80, 81, 131, 165]. We focused on the refinement correspondence between functional and software views, where the functional models are refined by adding more details to the software view. A prototype tool was developed for IBM Rational Rhapsody. The prototype can perform consistency checking between functional and software views. The inconsistency checking approach and the prototype tool were evaluated in the scope of Adaptive Cruise Control functional and software models which were created by two separate student teams emulating an OEM and an automotive supplier. In addition to the architectural consistency checking, in the evaluation of automotive ADLs in Chapter 3 we identified that the automotive ADLs lack the capability to ensure architectural quality. Although it is not an explicit requirement of automotive ADLs, improving architectural quality clearly gives an advantage to the quality of architectural modeling. This is particularly important because ensuring internal quality, as measured by looking inside the product, (e.g., by analyzing the static model or source code [159]) of the system influences the external quality, as measured by execution of the product, (e.g., by performing testing [159]). This enables quality improvement at an earlier stage of the software development cycle, i.e., the architectural and design phase. The following research question was formulated to address the architectural quality issue. Answering this question also addresses the second main issue required by the HIT project. RQ3 : How can the quality of automotive software models be defined and evaluated? To address this research question, we first clarified what the quality of architectural models is. The software quality can be generally defined as a conformance to the characteristics of software product with specified requirements. Therefore, we defined an automotive quality model [56] based on the ISO/IEC 25010 international standard for system/software product quality [115]. In addition, we reviewed automotive-specific design quality frameworks and recent software quality modeling literature. The (sub-) characteristics of quality model and respective metrics are defined together with an OEM following the Goal-Question-Metric (GQM) approach. In this thesis, we focused on the results of modularity and complexity metrics of Simulink models in Chapter 5 and in Chapter 6, respectively. Modularity and complexity metrics were selected because they were considered sub-sub-characteristics of several sub-characteristics e.g., reusability, modifiability, and analysability, which are part of maintainability characteristic in our quality model. The quality metrics are evaluated in the industrial setting. Simulink models are selected because they are used broadly to develop automotive embedded software and may consist of hundreds of building blocks and several hierarchal levels. We evaluated the modularity of Simulink models based on the cohesion, coupling, and control metrics for improving quality of Simulink models. During the evaluation of the quality of control software, we identified that 40% of prototype control models were clones (type I-III). Therefore, in Chapter 7, we introduced a novel method for clone management based on Variant Configuration Language (VCL). This method provides a variability handling mechanism for Simulink models. In this mechanism, the clones are managed separately from the models in a non-intrusive way and the original models are
128
Conclusions
not polluted with extra complexity to manage clone instances. The proposed technique was validated by creating generic solutions for Simulink clones with a variety of differences present between them.
8.2
Directions for Further Research
In this thesis, we presented the research results on automotive architecture modeling and automotive architectural quality. This section discusses the possible directions for further research in these areas.
8.2.1
Automotive architecture modeling
For the definition of AFAS in Chapter 2, we aimed to integrate the main viewpoints necessary for the automotive architecture modeling by investigating existing automotive AFs and ADLs. The main purpose of AFAS is to use the results of the evaluation of automotive ADLs and to contribute to the thought process in the automotive industry as the Automotive Architecture Framework (AAF) and Architecture Design Framework (ADF). During the definition of AFAS, we identified a number of further research directions: • Eliciting the viewpoints for vehicle functional domains (i.e., powertrain control, chassis control, active/passive safety systems, multimedia/telematics, body/comfort, and human machine interface (HMI)). In each functional domain, stakeholders may have varying concerns. • Comparing the AFAS views with the views generated by the MEGAF approach [102], since the MEGAF is built upon the ISO 42010 international standard and enables the definition of a reusable and open architecture framework. Due to the limited availability of the metamodels for the automotive ADLs (except EAST-ADL, SysML, MARTE), the views were not generated using the MEGAF approach. • Mapping the diagram types of the selected language, which was discussed in Chapter 3, to the AFAS viewpoints. After the refinement of the AFAS, the SysML diagram types can be mapped to the viewpoints together with the guidelines. • Bridging a gap between architectural model and code by aligning the architectural concepts and programming languages, which was considered one of the new challenges in [41]. Besides an architecture framework, we studied automotive ADLs to answer the RQ1 more thoroughly. Instead of defining yet another ADL, we investigated existing automotive ADLs and identified a generic ADL as a suitable language for representing an automotive architecture. Industrial applicability of the chosen ADL was investigated by an OEM in a pilot project. Valuable future work regarding automotive ADL, could focus on reverse engineering source code to create architectures at different architectural levels. To do this, reverse engineering methods like system grokking technology [55] can be used to extract hierarchical state machines from the source code of an embedded application. Reconstruction of SysML sequence and activity diagrams from the source code can be considered similarly to UML [127, 199, 200]. Furthermore, model-based development using automotive ADLs is a young field, where the language specification or metamodel of architectural models evolve in short period of time, which causes a model co-evolution
8.2. Directions for Further Research
129
problem. A syntax-driven model co-evolution method [231] can be used to address the ADL co-evolution issue. A relation between automotive ADLs and AUTOSAR needs to be investigated further. Since AUTOSAR is intended for automotive E/E architectures, the question remains if the AFAS hardware view is consistent with the AUTOSAR. One of the criticisms that the AUTOSAR received was that unnecessary or redundant functions and elements were lobbied into the standard by many participant OEMs as well as tier-one suppliers [97]. Therefore, a detailed analysis of the relation between automotive ADLs (specifically its E/E or hardware view) and AUTOSAR needs to be carried out.
8.2.2
Automotive architectural quality
Although the RQ2 was formulated during the case study for automotive architecture modeling, architectural consistency is a part of the architectural quality issue. Due to the lack of tool support for checking consistency between automotive architecture views, we formalized the correspondence rule between automotive structural views and developed a prototype tool to check the consistency. Because we solely focused on the refinement correspondence, other correspondence and correspondence rules need to be defined and formalized within or between architectural views such as conformance, obligation, and traceability correspondence. The prototype tool can be improved by carrying out a comprehensive case study in an industrial setting by extending the consistency rules and overall usability of the tool. Support for consistency checking between the other automotive views of AFAS is also needed. Furthermore, reverse engineering source code to create architectural models at different architectural views is valuable. The reverse engineering architectural model can be used to check inconsistency between other architectural models. Modularity and complexity metrics defined to address the RQ3 have been implemented as part of a quality framework and evaluated using the automotive control software in Simulink. However, further evaluation should be carried out on different type of automotive architectural and design models. A preliminary analysis on defining a relation between modularity/complexity metrics and number of faults (presence of faults) is carried out. It requires further analysis on bigger dataset. Modularity and complexity metrics may provide useful insight on fault prediction of automotive software [14]. These metrics can be also used to detect bad smells that indicate the need of refactoring. Tool support for refactoring Simulink models is limited compare to the established refactoring techniques from Object-Oriented programming [230]. Furthermore, operationalization of modularity and complexity needs to be carried out to make them easy to understand by the stakeholders. Visualizations of metrics were considered valuable by the domain experts to facilitate the architecture review process. Extending visualizations for these metrics are also a necessary step. For this purpose, a task-oriented view approach on a set of visualizations of UML models and related metrics data can be applied [135, 136]. The work on complexity metrics can be continued on two levels: (a) refining the established metrics and (b) linking them to standards and complexity models. The former involves including the factors that additionally impact the complexity of Simulink models, to the existing Simulink complexity metric suite. Preliminary discussions with experts showed that apart from the number of incoming signals (single signal or a bus) or depth of a (sub)system, there are also other elements that need to be addressed, e.g. loops in the model, algorithms and computations, number of GoTo statements, number of parameters
130
Conclusions
of the models or documentation and model description. For some of these factors it is not sufficient to have metrics based on simple count; rather, some more cognitive analysis might be needed. Furthermore, it needs to be determined if Simulink operations can be weighted based on the difficulty and complexity level. Factor analysis [98] can be utilized to investigate if any other operations contribute to different complexity metrics. The complexity metrics can be evaluated further in the specific functional domains. In addition, the relation of the complexity metrics suite and standards specific to a functional domain such as IEC 51508, ISO 26262 and modeling guidelines e.g., MISRA can be explored further. A complexity model can be built to comprise of quality attributes originating from the ISO SQuARe standard and linking them to the metrics suite we established. In addition, metrics aggregation techniques for Simulink models can be investigated. Changes in quality metrics during the system evolution can be studied and the applicability of Lehman’s general software evolution laws [138] to evolution of Simulink models (cf. [43, 117]) also can be investigated. Should model repositories become available, the evolutionary studies can be augmented by repository mining techniques [183]. Furthermore, these metrics can be modified or extended further for other embedded domains. Regarding the clone detection tool for Simulink models, a clone-matching tool needs to be developed whereby other copies of a known clone can be searched for in the newly developed parts of a model. Visual rendering to VCL frames like pure:variants VAR Multiport Switch and VAR Const [139] can also be developed. In this manner, cloned subsystems will have extra property pages at configuration time to concretize the block/subsystem before using it. Further, empirical evaluation of the approach is considered important future work. The use of parameterized contracts to software components [193] can also be investigated to enhance the reusability of the VCL representation.
Bibliography
[1] Arynga motivation. http://www.arynga.com/. (Accessed June 27, 2014). [2] MISRA C coding standard. http://www.misra.org.uk/. (Accessed June 27, 2014). [3] Modeling a fault-tolerant fuel control system. http://www.mathworks. nl/products/simulink/examples.html?file=/products/demos/ shipping/simulink/sldemo_fuelsys.html. [4] The modeling metric tool. http://www.mathworks.com/matlabcentral/ fileexchange/5574. [5] The AUTomotive Open System ARchitecture (AUTOSAR). http://autosar.org/. (Accessed June 27, 2014). [6] The Open Group Architectural Framework (TOGAF). http://www.opengroup. org/togaf/. [7] Variant configuration language. http://vcl.comp.nus.edu.sg. (Accessed January 10, 2014). [8] AUTOSAR has become mature and accepted. ATZextra worldwide, 18(9), 2013. [9] A. Abran. Software Metrics and Software Metrology. Wiley, 2010. [10] D. Ahrens, A. Frey, A. Pfeiffer, and T. Bertram. Designing reusable and scalable software architectures for automotive embedded systems in driver assistance. Technical Report 2010-01-0942, 2010. [11] K. Ahsan. Car recalls: A problem unique to toyota or for all car makers? In International Conference on Industrial Engineering and Operations Management (IEOM), pages 2027–2036, 2012. [12] M.H. Alalfi, J.R. Cordy, T.R. Dean, M. Stephan, and A. Stevenson. Models are code too: Near-miss clone detection for Simulink models. In International Conference on Software Maintenance (ICSM), pages 295–304. IEEE, 2012.
132
Bibliography
[13] M.H. Alalfi, J.R. Cordy, T.R. Dean, M. Stephan, and A. Stevenson. Near-miss model clone detection for simulink models. In International Workshop on Software Clones (IWSC), pages 78–79. IEEE, 2012. [14] H. Altinger, S. Siegl, Y. Dajsuren, and F. Wotawa. A novel industry grade dataset for fault prediction based on model-driven developed automotive embedded software. In Working Conference on Mining Software Repositories (MSR). IEEE, 2015. [15] H. Altinger, F. Wotawa, and M. Schurius. Testing methods used in the automotive industry: Results from a survey. In Workshop on Joining AcadeMiA and Industry Contributions to Test Automation and Model-based Testing (JAMAICA), pages 1–6. ACM, 2014. [16] E. Andrianarison and J.-D. Piques. SysML for embedded automotive systems: A practical approach. In Embedded Real Time Software and Systems (ERTS2 ), pages 1–10, Toulouse, France, 2010. ERTS2 series. [17] N. Anquetil and J. Laval. Legacy software restructuring: Analyzing a concrete case. In the 15th European Conference on Software Maintenance and Reengineering, pages 279–286, 2011. [18] N. Anquetil and T.C. Lethbridge. Comparative study of clustering algorithms and abstract representations for software remodularisation. In IEEE Proceedings – Software, volume 150, pages 185–201, 2003. [19] R. Aoun, V. Gunther, and Erhard P. Bauhaus – a tool suite for program analysis and reverse engineering. In Ada-Europe, pages 71–82, 2006. [20] L. Apvrille and A. Becoulet. Prototyping an embedded automotive system from its UML/SysML models. In Embedded Real Time Software and Systems (ERTS2 ), pages 1–10, Toulouse, France, 2012. ERTS2 series. [21] Atego. Artisan Studio. http://atego.com/products/atego-modeler/. (Accessed June 12, 2014). [22] V.R. Basili. Software modeling and measurement: the Goal/Question/Metric paradigm. Technical Report UMIACS TR-92-96, University of Maryland at College Park, College Park, MD, USA, 1992. [23] H.A. Basit and Y. Dajsuren. Handling clone mutations in Simulink models with VCL. In International Workshop on Software Clones (IWSC), volume 63. Electronic Communications of the EASST, 2014. [24] P.G. Bassett. Framing software reuse: Lessons from the real world. Prentice-Hall, Inc., 1996. [25] I.D. Baxter, A. Yahin, L. Moura, M. Sant’Anna, and L. Bier. Clone detection using abstract syntax trees. In International Conference on Software Maintenance (ICSM), pages 368–377. IEEE, 1998. [26] L. Belategi, G. Sagardui, and L. Etxeberria. MARTE mechanisms to model variability when analyzing embedded software product lines. In Software Product Lines: Going Beyond, pages 466–470. Springer, 2010.
Bibliography
133
[27] B.W. Boehm. Characteristics of Software Quality. TRW Software Series/Systems Engineering and Integration Division, TRW Systems Group. 1973. [28] B. Bolger. Software quality initiatives in automotive system development. 2014. [29] P. Bostr¨om, R. Gr¨onblom, T. Huotari, and J. Wiik. An approach to contract-based verification of Simulink models. Technical Report 985, Turku Centre for Computer Science, 2010. [30] N. Bouck´e, D. Weyns, R. Hilliard, T. Holvoet, and A. Helleboogh. Characterizing relations between architecture views. In R. Morrison, D. Balasubramaniam, and K. Falkner, editors, Software Architecture, volume 5292 of Lecture Notes in Computer Science, pages 66–81. Springer Berlin Heidelberg, 2008. [31] E.M. Bouwers. Metric-based Evaluation of Implemented Software Architectures. PhD thesis, Delft University of Technology, 2013. [32] P. Braun and M. Rappl. A model-based approach for automotive software development. In Workshop on Object-Oriented Modeling of Embedded Real-Time Systems (OMER), volume 5, pages 100–105. LNI, 2001. [33] R.K. Brayton. Logic minimization algorithms for VLSI synthesis, volume 2. Springer, 1984. [34] R.J. Bril, L.M.G. Feijs, A. Glas, R.L. Krikhaar, and T. Winter. Hiding expressed using relation algebra with multi-relations-oblique lifting and lowering for unbalanced systems. In European Conference on Software Maintenance (ECSM) and Reengineering (CSMR), pages 33–43. IEEE, 2000. [35] R.J. Bril and A. Postma. An architectural connectivity metric and its support for incremental re-architecting of large legacy systems. In International Workshop on Program Comprehension (IWPC), pages 269–280. IEEE, 2001. [36] F. Brito e Abreu, M. Goul˜ao, and R. Esteves. Toward the design quality evaluation of Object-Oriented software systems. In International Conference of Software Quality, pages 44–57, 1995. [37] M. Broy. Automotive software engineering. In International Conference on Software Engineering (ICSE), pages 719–720. IEEE, 2003. [38] M. Broy. Challenges in automotive software engineering. In International Conference on Software Engineering (ICSE), pages 33–42. ACM, 2006. [39] M. Broy, F. Deißenb¨ ock, and M. Pizka. A holistic approach to software quality at work. In World Congress for Software Quality (WCSQ), 2005. [40] M. Broy, M. Gleirscher, S. Merenda, D. Wild, P. Kluge, and W. Krenzer. Toward a holistic and standardized automotive architecture description. Computer, 42(12):98– 101, 2009. [41] M. Broy and R.H. Reussner. Architedural concepts in programming languages. Computer, 43(10):88–91, 2010. [42] R.J.A. Buhr. Use case maps as architectural entities for complex systems. IEEE Transactions on Software Engineering (ITSE), 24(12):1131–1155, 1998.
134
Bibliography
[43] J. Businge, A. Serebrenik, and M.G.J van den Brand. An empirical study of the evolution of Eclipse third-party plug-ins. In the Joint ERCIM Workshop on Software Evolution and International Workshop on Principles of Software Evolution (IWPSE), pages 63–72, 2010. [44] J. Capers. Applied software measurement. McGraw-Hill, 1996. [45] D.N. Card and R.L. Glass. Measuring Software Design Quality. Prentice-Hall, Inc., Upper Saddle River, NJ, USA, 1990. [46] M.R.V. Chaudron. Quality assurance in model-based software development: Challenges and opportunities. In Software Quality. Process Automation in Software Development, pages 1–9. Springer, 2012. [47] S.R. Chidamber and C.F. Kemerer. A metrics suite for object oriented design. IEEE Transactions on Software Engineering, 20(6):476–493, 1994. [48] J.R. Cordy. Submodel pattern extraction for Simulink models. In International Software Product Line Conference (SPLC), pages 7–10. ACM, 2013. ConQAT. https://www.cqse.eu/en/products/conqat/ [49] CQSE. overview/. (Accessed September 4, 2014). [50] P. Cuenot, P. Frey, R. Johansson, H. L¨ onn, Y. Papadopoulos, M. Reiser, A. Sandberg, D. Servat, R. T. Kolagari, M. T¨ orngren, and M. Weber. The EAST-ADL Architecture Description Language for Automotive Embedded Software. In ModelBased Engineering of Embedded Real-Time Systems, pages 297–307. Springer Verlag, 2011. [51] B. Curtis, S.B. Sheppard, and P. Milliman. Third time charm: Stronger prediction of programmer performance by software complexity metrics. In The 4th international conference on Software engineering, pages 356–360, 1979. [52] DAF Trucks N.V. Adaptive Cruise Control. http://www.daf. com/SiteCollectionDocuments/Products/Safety_and_comfort_ systems/DAF-ACC-EN.pdf, 2013. (Accessed March 25, 2013). [53] Y. Dajsuren. Evaluating benefits of SysML for DAF. Technical report, DAF technical report 51050/12-333 (Confidential), 2012. [54] Y. Dajsuren, C.M. Gerpheide, A. Serebrenik, A. Wijs, B. Vasilescu, and M.G.J. van den Brand. Formalizing correspondence rules for automotive architecture views. In ACM Sigsoft Conference on Quality of Software Architectures (QoSA), pages 129–138. ACM, 2014. [55] Y. Dajsuren, M. Goldstein, and D. Moshkovich. Modernizing legacy software using a System Grokking technology. In International Conference on Software Maintenance (ICSM), pages 1–7, 2010. [56] Y. Dajsuren and R.G.M. Huisman. Definition and evaluation of quality metrics for automotive software models. Technical report, DAF technical report 51050/15-041 (Confidential), 2015.
Bibliography
135
[57] Y. Dajsuren, A. Serebrenik, R.G.M. Huisman, and M.G.J. van den Brand. A quality framework for evaluating automotive architecture. In the FISITA World Automotive Congress, pages 1–7. FISITA, 2014. [58] Y. Dajsuren, M.G.J. van den Brand, and A. Serebrenik. Evolution mechanisms of automotive architecture description languages. In the 10th edition of the BElgianNEtherlands software eVOLution seminar, pages 24–25, 2011. [59] Y. Dajsuren, M.G.J. van den Brand, and A. Serebrenik. Modularity analysis of automotive control software. Intelligent Cars, ERCIM News issue 94, pages 20–21, 2013. [60] Y. Dajsuren, M.G.J. van den Brand, A. Serebrenik, and R.G.M. Huisman. Automotive ADLs: a study on enforcing consistency through multiple architectural levels. In International ACM SIGSOFT conference on Quality of Software Architectures (QoSA), pages 71–80. ACM, 2012. [61] Y. Dajsuren, M.G.J. van den Brand, A. Serebrenik, and S.A. Roubtsov. Simulink models are also software: Modularity assessment. In International ACM SIGSOFT conference on Quality of Software Architectures (QoSA), pages 99–106. ACM, 2013. [62] D. Dan, S. Jarzabek, and R. Ferenc. Configuring Software for Reuse with VCL, pages 16–30. University of Szeged, 2013. [63] F. Deissenboeck, B. Hummel, E. J¨ urgens, M. Pfaehler, and B. Sch¨ atz. Model clone detection in practice. In the 4th International Workshop on Software Clones (IWSC), pages 57–64. ACM, 2010. urgens, B. Sch¨ atz, S. Wagner, J-F. Girard, [64] F. Deissenboeck, B. Hummel, E. J¨ and S. Teuchert. Clone detection in automotive model-based development. In International Conference on Software Engineering (ICSE), pages 603–612. ACM, 2008. [65] H. Dhama. Quantitative models of cohesion and coupling in software. Journal of Systems and Software, 29(1):65–74, 1995. [66] R.M. Dijkman, D.A.C. Quartel, and M.J. van Sinderen. Consistency in multiviewpoint design of enterprise information systems. Information and Software Technology (IST), 50(7):737–752, 2008. [67] E. Duala-Ekoko and M.P. Robillard. Clone region descriptors: Representing and tracking duplication in source code. ACM Transactions on Software Engineering and Methodology (TOSEM), 20(1):3, 2010. [68] O.J. Dunn. Multiple comparisons among means. Journal of American Statistical Association, 56:52–64, 1961. [69] D. Durisic, M. Nilsson, M. Staron, and J. Hansson. Measuring the impact of changes to the complexity and coupling properties of automotive software systems. Journal of Systems and Software, 86(5):1275–1293, 2013. [70] S. Easterbrook, J. Singer, M.-A. Storey, and D. Damian. Selecting empirical methods for software engineering research. In Guide to advanced empirical software engineering, pages 285–311. Springer, 2008.
136
Bibliography
[71] Eclipse. PolarSys (Former TOPCASED). http://polarsys.org/. (Accessed June 12, 2014). [72] Eclipse. Sirius. http://www.eclipse.org/sirius/. (Accessed June 12, 2014). [73] A. Egyed. Automatically validating model consistency during refinement. In International Conference on Software Engineering (ICSE), pages 12–19, 2000. [74] A. Egyed. Scalable consistency checking between diagrams – The VIEWINTEGRA approach. In International Conference on Automated Software Engineering (ASE), pages 387–390. IEEE, 2001. [75] A. Egyed. Fixing inconsistencies in UML design models. In International Conference on Software Engineering (ICSE), pages 292–301, Washington, DC, USA, 2007. IEEE. [76] M. Elaasar and L. Briand. An overview of UML consistency management. Technical Report SCE-04-18, 2004. [77] D. Emery and R. Hilliard. Every architecture description needs a framework: Expressing architecture frameworks using ISO/IEC 42010. In Joint Working IEEE/IFIP Conference on Software Architecture (WICSA) and European Conference on Software Architecture (ECSA), pages 31–40, 2009. [78] European Commission. Commission Regulation (EC) No 692/2008 of 18 July 2008 implementing and amending Regulation (EC) No 715/2007 of the European Parliament and of the Council on type-approval of motor vehicles with respect to emissions from light passenger and commercial vehicles (Euro 5 and Euro 6) and on access to vehicle repair and maintenance information, 2008. [79] M.W. Evans and J.J. Marciniak. Software quality assurance and management. Wiley, 1987. [80] L. Feijs, R. Krikhaar, and R. van Ommering. A relational approach to support software architecture analysis. Software: Practice and Experience, 28(4):371–400, 1998. [81] L. Feijs and R. van Ommering. Theory of relations and its applications to software structuring. Technical report, 1995. [82] P.H. Feiler, D.P. Gluch, and J.J. Hudak. The architecture analysis & design language (AADL): An introduction. Technical Report CMU/SEI-2006-TN-011, Software Engineering Institute, Carnegie Mellon University, 2006. [83] A. Field. Discovering Statistics Using SPSS. SAGE Publications, 2005. [84] W.A. Florac. Software Quality Measurement: A Framework for Counting Problems and Defects. Technical Report CMU/SEI-92-TR-022, Software Engineering Institute, Carnegie Mellon University, 1992. [85] S. Friedenthal, A. Moore, and R. Steiner. A Practical Guide to SysML: The Systems Modeling Language. Morgan Kaufmann/OMG Press, 2011. [86] J. Friedman. MATLAB/Simulink for automotive systems design. In Design, Automation and Test in Europe, pages 1–2, 2006.
Bibliography
137
[87] K.R. Gabriel. Simultaneous test procedures—some theory of multiple comparisons. The Annals Mathematical Statistics, 40(1):224–250, 1969. [88] A. Geraci. IEEE Standard Computer Dictionary: Compilation of IEEE Standard Computer Glossaries. IEEE Press, Piscataway, NJ, USA, 1991. [89] S. Gerard and H. Espinoza. Rationale of the UML profile for Marte. Chapter of the book: From MDD Concepts to Experiments and Illustrations, pages 43–52, 2006. [90] P.C. Gerhardt Jr. Computer applications in gating and risering system design for ductile iron castings. AFS Transactions, 91:475–476, 1983. [91] G.K. Gill and C.F. Kemerer. Cyclomatic complexity density and software maintenance productivity. IEEE Transaction on Software Engineering, 17(12):1284–1288, December 1991. [92] H.G.C G´ ongora, T. Gaudr´e, and S. Tucci-Piergiovanni. Towards an architectural design framework for automotive systems development. In Complex Systems Design and Management, pages 241–258. Springer, 2013. [93] H. Graves and Y. Bijan. Using formal methods with SysML in aerospace design and engineering. Annals of Mathematics and Artificial Intelligence (AMAI), pages 1–50, 2012. onniger, J. Hartmann, H. Krahn, S. Kriebel, L. Rothhardt, and B. Rumpe. [94] H. Gr¨ View-centric modeling of automotive logical architectures. In Modellbasierte Entwicklung eingebetteter Systeme, pages 3–12, 2008. [95] A. Haber, C. Kolassa, P. Manhart, P.M.S. Nazari, B. Rumpe, and I. Schaefer. First-class variability modeling in Matlab/Simulink. In International Workshop on Variability Modelling of Software-intensive Systems (VaMoS), pages 11–18. ACM, 2013. [96] M.H. Halstead. Elements of Software Science (Operating and Programming Systems Series). Elsevier Science Inc., New York, NY, USA, 1977. [97] C. Hammerschmidt. AUTOSAR standard not ready to plug-and-play. http:// www.eetimes.com/document.asp?doc_id=1247499, 2007. (Accessed June 27, 2014). [98] H.H. Harman. Modern factor analysis. University of Chicago Press, 1976. [99] R.J. Harris. ANOVA: An Analysis of Variance Primer. F.E. Peacock Publishers, 1994. [100] S. Henry and D. Kafura. Software structure metrics based on information flow. IEEE Transactions on Software Engineering, 7(5):510–518, 1981. [101] S. Henry and C. Selig. Predicting source-code complexity at the design stage. IEEE Software, 7(2):36–44, March 1990. [102] R. Hilliard, I. Malavolta, H. Muccini, and P. Pelliccione. On the composition and reuse of viewpoints across architecture frameworks. In the Joint Working IEEE/IFIP Conference on Software Architecture (WICSA) and European Conference on Software Architecture (ECSA), pages 131–140. IEEE, 2012.
138
Bibliography
[103] M. Holander and D.A. Wolfe. Nonparametric statistical methods. Wiley, 1973. [104] D. Holten. Hierarchical edge bundles: Visualization of adjacency relations in hierarchical data. IEEE Transactions on Visualization and Computer Graphics, 12(5):741–748, 2006. [105] A. Hosagrahara and P. Smith. Measuring productivity and quality in model-based design. Technical Report 2005-01-1357, The MathWorks, Inc., 2005. [106] S.E. Hove and B. Anda. Experiences from conducting semi-structured interviews in empirical software engineering research. In 11th IEEE International Symposium on Software Metrics, pages 10–23, 2005. [107] W. Hu, T. Loeffler, and J. Wegener. Quality model based on ISO/IEC 9126 for internal quality of MATLAB/Simulink/Stateflow models. In the IEEE International Conference on Industrial Technology (ICIT), pages 325–330, 2012. [108] R.G.M. Huisman. Vertically integrated (functional/EE) architectures. VDI-Tagung, 2014. [109] IBM. Rational Rhapsody Designer for systems engineers. http://www.ibm.com/ software/products/. (Accessed June 27, 2014). [110] The MathWorks Inc. Simulink - Simulation and Model-based Design. http: //www.mathworks.com/products/simulink/. (Accessed June 27, 2014). [111] INRIA. The Astr´ee Static Analyzer. http://www.astree.ens.fr/. (Accessed January 7, 2015). [112] ISO. ISO/IEC 10746-1 Information technology – Reference Model of Open Distributed Processing (RM-ODP). 1998. [113] ISO. ISO/IEC 9126-1 Product quality–Part 1: Quality model, 2001. [114] ISO. ISO/DIS 26262-2 road vehicles - Functional safety – part 2: management of functional safety, 2009. [115] ISO. ISO/IEC 25010 SQuaRE - Systems and software Quality Requirements and Evaluation–System and software quality models, 2011. [116] ISO. ISO/IEC/IEEE 42010 - Systems and software engineering–Architecture description, 2011. [117] A. Israeli and D.G. Feitelson. The Linux kernel as a case study in software evolution. Journal of Systems and Software, 83(3):485–501, 2010. [118] S. Jarzabek, P. Bassett, H. Zhang, and W. Zhang. XVCL: XML-based variant configuration language. In International Conference on Software Engineering (ICSE), pages 810–811. IEEE, 2003. [119] E. Juergens. Why and how to control cloning in software artifacts. PhD thesis, Technische Universit¨ at M¨ unchen, 2011. [120] S.H. Kan. Metrics and Models in Software Quality Engineering. Addison-Wesley Longman Publishing Co., Inc., Boston, MA, USA, 2nd edition, 2002.
Bibliography
139
[121] K.C. Kang, S.G Cohen, J.A. Hess, W.E. Novak, and A.S. Peterson. Feature-oriented domain analysis (foda) feasibility study. Technical report, DTIC Document, 1990. [122] klockwork. Software on wheels: Addressing the challenges of embedded automotive software. www.klocwork.com/, 2014. Source Code Analysis. http://www.klocwork.com/ [123] Klocwork. products-services/klocwork/static-code-analysis. (Accessed September 4, 2014). [124] P.R. Knittig, S. Shimizu, and R.J. Ballon. Modularization and its limitations in the automobile industry. Working Paper for the Second Wold Conference on POM and 15th POM Conference, 30.04.-03.05. 2004, Cancun, 2004. [125] J. Knodel and D. Popescu. A comparison of static architecture compliance checking approaches. In the Working IEEE/IFIP Conference on Software Architecture (WICSA), pages 12–12. IEEE, 2007. [126] F. Konietschke, L.A. Hothorn, and E. Brunner. Rank-based multiple test procedures and simultaneous confidence intervals. Electronic Journal of Statistics, 6:738–759, 2012. [127] E. Korshunova, M. Petkovi´c, M.G.J. van den Brand, and M.R. Mousavi. CPP2XMI: Reverse engineering of UML class, sequence, and activity diagrams from C++ source code. In Working Conference on Reverse Engineering (WCRE), pages 297–298, 2006. [128] R. Koschke. Survey of research on software clones. Internationales Begegnungsund Forschungszentrum f¨ ur Informatik, 2007. [129] R. Koschke and D. Simon. Hierarchical reflexion models. In Working Conference on Reverse Engineering (WCRE), page 36. IEEE, 2003. [130] Y. Kotb and T. Katayama. Consistency checking of UML model diagrams using the xml semantics approach. In Special Interest Tracks and Posters of the 14th International Conference on World Wide Web (WWW), pages 982–983. ACM, 2005. [131] R. Krikhaar. Software Architecture Reconstruction. PhD thesis, University of Amsterdam, 1999. [132] P. Kruchten. The rational unified process: an introduction. Addison-Wesley Professional, 2004. [133] P.B. Kruchten. The 4+1 View Model of architecture. Software, IEEE, 12(6):42–50, November 1995. doi:10.1109/52.469759. [134] J.G. Lamm and T. Weilkiens. Functional architectures in SysML. Tag des Systems Engineering (TdSE), 2010. [135] C.F.J Lange. Assessing and Improving the Quality of Modeling: A Series of Empirical Studies about the UML. PhD thesis, Eindhoven University of Technology, 2007. [136] C.F.J. Lange, M.R.V. Chaudron, and J. Muskens. In practice: UML software architecture and design description. IEEE Software, 23(2):40–46, 2006.
140
Bibliography
[137] K.-H. Lee, P.-G. Min, J.-H. Cho, and D.-J. Lim. Model-driven requirements validation for automotive embedded software using uml. In International Conference on Computing Technology and Information Management (ICCM), volume 1, pages 46–50, april 2012. [138] M.M. Lehman and L.A. Belady, editors. Program evolution: processes of software change. Academic Press Professional, Inc., San Diego, CA, USA, 1985. [139] A. Leitner, W. Ebner, and C. Kreiner. Mechanisms to handle structural variability in MATLAB/Simulink models. In Safe and Secure Software Reuse, pages 17–31. Springer, 2013. [140] W. Li and S. Henry. Object-oriented metrics that predict maintainability. Journal of Systems and Software, 23(2):111–122, 1993. arz), pages 29–33, [141] J.K. Liker. The way back for Toyota. Industrial Engineer (M¨ 2010. [142] R. Likert. A technique for the measurement of attitudes. Archives of psychology, 1932. [143] D. Liu, K. Subramaniam, B.H. Far, and A. Eberlein. Automating transition from use-cases to class model. In IEEE Canadian Conference on Electrical and Computer Engineering (CCECE), volume 2, pages 831–834. IEEE, 2003. [144] M. Lorenz and J. Kidd. Object-oriented software metrics: a practical guide. PrenticeHall, Inc., Upper Saddle River, NJ, USA, 1994. [145] MathWorks Automotive Advisory Board (MAAB). Control Algorithm Modelling Guidelines Using MATLAB, Simulink, and Stateflow Version 3.0. MathWorks, 2012. [146] MAENAD. EAST-ADL 2.1.12 domain model specification. http://east-adl. info/Specification/V2.1.12/html/index.html. (Accessed September 4, 2014). [147] MAENAD. ICT MAENAD project. http://maenad.eu/. (Accessed September 4, 2014). [148] R. Martin. OO Design Quality Metrics – An Analysis of Dependencies. In Workshop Pragmatic and Theoretical Directions in Object-Oriented Software Metrics. OOPSLA, 1994. [149] MathWorks. Polyspace. http://www.mathworks.com/products/ polyspace/?s_cid=wiki_polyspace_2. (Accessed January 7, 2015). [150] Mathworks. Simulink control flow logic. http://www.mathworks.nl/help/ simulink/ug/modeling-control-flow-logic.html. [151] MathWorks. 2014a documentation, types of model coverage - matlab and simulink. http://www.mathworks.com/help/slvnv/ug/ types-of-model-coverage.html, 2014.
Bibliography
141
[152] MathWorks. Matlab sldiagnostics – display diagnostic information about Simulink system. http://www.mathworks.com/help/simulink/slref/ sldiagnostics.html, 2014. [153] T.J. McCabe. A complexity measure. IEEE Transactions on Software Engineering, (4):308–320, 1976. [154] T.J. McCabe and C.W. Butler. Design complexity measurement and testing. Communications of the ACM, 32(12):1415–1425, 1989. [155] J.A. McCall, P.K. Richards, and G.F. Walters. Factors in software quality: Concept and definitions of software quality. PN, 1977. [156] C. Mead and L. Conway. Physical Design Automation of VLSI Systems, volume 2. Addison, 1980. [157] N. Medvidovi´c and R.N. Taylor. A Classification and Comparison Framework for Software Architecture Description Languages. IEEE Transactions on Software Engineering, 26(1):70–93, 2000. [158] G. Menkhaus and B. Andrich. Metric suite for directing the failure mode analysis of embedded software systems. In the International Conference on Enterprise Information Systems, pages 266–273, 2005. [159] T. Mens and A. (Eds.) Serebrenik, A. Cleve. Evolving Software Systems. Springer, 2014. [160] T.D. Miller and P. Elgard. Defining modules, modularity and modularization. In IPS Research Seminar, 1998. [161] Ministry of Economy, Trade and Industry, Japan. Strengthening efforts to enhance dependability and security of information system software. Technical Report Interim report, 2009. MES M-XRAY tool. http://www. [162] Model Engineering Solutions. model-engineers.com/en/m-xray.html. (Accessed September 4, 2014). [163] K. Mordal, N. Anquetil, J. Laval, A. Serebrenik, B. Vasilescu, and S. Ducasse. Software quality metrics aggregation in industry. Journal of Software: Evolution and Process, 25(10):1117–1135, 2013. [164] G.C. Murphy, D. Notkin, and K. Sullivan. Software reflexion models: bridging the gap between source and high-level models. In SIGSOFT Software Engineering Notes (SEN), volume 20, pages 18–28, New York, NY, USA, 1995. [165] J. Muskens, R.J. Bril, and M.R.V. Chaudron. Generalizing consistency checking between software views. In Working IEEE/IFIP Conference on Software Architecture (WICSA), pages 169–180, 2005. [166] N. Navet and F. Simonot-Lion. Automotive Embedded Systems Handbook. Industrial Information Technology Series. CRC Press, 2009. [167] NoMagic. MagicDraw SysML plugin. http://www.nomagic.com/products/ magicdraw-addons/sysml-plugin.html. (Accessed June 12, 2014).
142
Bibliography
[168] A. Nugroho, M.R.V. Chaudron, and E. Arisholm. Assessing UML design metrics for predicting fault-prone classes in a Java system. In IEEE Working Conference on Mining Software Repositories (MSR), pages 21–30. IEEE, 2010. [169] Object Management Group. UML Profile for MARTE: Modeling and Analysis of Real-Time Embedded Systems Version 1.1. http://www.omg.org/spec/ MARTE/1.1, 2011. (Accessed June 12, 2014). [170] British Ministry of Defence. MOD Architecture Framework. http://www.modaf. org.uk/. (Accessed September 27, 2014). [171] National University of Singapore (XVCL) Team. XML-based variant configuration language. http://xvcl.comp.nus.edu.sg. (Accessed January 10, 2014). On the Impact of Rigorous Approaches on the Quality of [172] M. Olszewska (Plaska). , Development. PhD thesis, Turku Centre for Computer Science, 2011. [173] M. Olszewska (Plaska). Simulink-specific design quality metrics. Technical Report , 1002, Turku Centre for Computer Science, Turku, Finland, 2011. [174] M. Olszewska (Plaska), M. Huova, M. Wald´en, K. Sere, and M. Linjama. Quality , analysis of Simulink models. In Conference on Quality Engineering in Software Technology, pages 223–240. Dpunkt.Verlag GmbH, 2009. [175] OMG. The Unified Modeling Language - UML 2.0. http://www.omg.org/ spec/UML/2.0/. (Accessed October 3, 2014). [176] OMG. Systems Modeling Language (SysML) Specification version 1.3. http: //www.omg.org/spec/SysML/, 2012. [177] R. Pallierer and F. Wandling. AUTOSAR 4.0 – and Now? Challenges and solution approaches to use. ATZelektronik worldwide, 7(3):38–41, 2012. [178] J. Pandremenos, J. Paralikas, K. Salonitis, and G. Chryssolouris. Modularity concepts for the automotive industry: a critical review. CIRP Journal of Manufacturing Science and Technology, 1(3):148–152, 2009. [179] C. Paredis, Y. Bernard, R.M. Burkhart, H. de Koning, S. Friedenthal, P. Fritzson, N.F. Rouquette, and W. Schamai. An overview of the SysML-Modelica transformation specification. In INCOSE International Symposium, 2010. [180] D.L. Parnas. On the criteria to be used in decomposing systems into modules. Communications of the ACM, 15(12):1053–1058, 1972. [181] M. Pf¨ ahler. Improving clone detection for models. Master’s thesis, Technische Universit¨ at M¨ unchen, 2009. [182] D. Pietrowski and B. Vijayendra. Softer side of quality. 2010. [183] W. Poncin, A. Serebrenik, and M.G.J van den Brand. Process mining software repositories. In European Conference on Software Maintenance and Reengineering (CSMR), pages 5–14, 2011. [184] C. Potts. Software-engineering research revisited. IEEE Software, 10(5):19–28, 1993.
Bibliography
143
[185] A. Pretschner, M. Broy, I.H. Kruger, and T. Stauner. Software engineering for automotive systems: A roadmap. In Future of Software Engineering, pages 55–71. IEEE, 2007. [186] R. Rana, M. Staron, J. Hansson, and M. Nilsson. Defect prediction over software life cycle in automotive domain. In the International Joint conference on Software Technologies (ICSOFT), Vienna, Austria, 2014. [187] A. C. Rao, G. Dhadyalla, R. P. Jones, R. McMurran, and D. White. Systems modelling of a driver information system – automotive industry case study. In System of Systems Engineering (SSE), pages 254–259. IEEE, 2006. [188] R. Rao and S.K. Card. The table lens: merging graphical and symbolic representations in an interactive focus+context visualization for tabular information. In Conference Companion on Human Factors in Computing Systems, pages 318–322, New York, NY, USA, 1994. ACM. [189] M. Rappl, P. Braun, M. Von Der Beeck, and C. Schr¨ oder. Automotive software development: A model based approach. Technical report, SAE Technical Paper, 2002. [190] D. Rattan, R. Bhatia, and M. Singh. Software clone detection: A systematic review. Information and Software Technology, 55(7):1165–1199, 2013. [191] B. Ravi. Computer-aided casting design–past, present and future. KOREA, 1(1.48):777, 1999. [192] D. Reniers, L. Voinea, and A. Telea. Visual exploration of program structure, dependencies and metrics with SolidSX. In Visualizing Software for Understanding and Analysis, pages 1–4, 2011. [193] R.H. Reussner. The use of parameterised contracts for architecting systems with software components. In International Workshop on Component-Oriented Programming (WCOP), 2001. [194] N.C. Robert. This car runs on code. http://www.spectrum.ieee.org/ feb09/7649, 2009. (Accessed June 27, 2014). [195] H.D. Rombach. A controlled expeniment on the impact of software structure on maintainability. IEEE Transactions on Software Engineering, SE-13(3):344–354, 1987. [196] J.R. Romero, J.I. Jaen, and A. Vallecillo. Realizing correspondences in multiviewpoint specifications. In IEEE International Conference on Enterprise Distributed Object Computing (EDOC), pages 163–172. IEEE, 2009. [197] J.R. Romero and A. Vallecillo. Well-formed rules for viewpoint correspondences specification. In Enterprise Distributed Object Computing Conference Workshops (EDOC), pages 441–443, 2008. [198] J. Rosik, J. Buckley, and M.A. Babar. Design requirements for an architecture consistency tool. In Annual Conference on Psychology of Programming Interest Group (PPIG), pages 1–15, 2009.
144
Bibliography
[199] S.A. Roubtsov, A. Serebrenik, A. Mazoyer, and M.G.J. van den Brand. I2SD: Reverse engineering Sequence Diagrams from Enterprise Java Beans with interceptors. In IEEE International Working Conference on Source Code Analysis and Manipulation (SCAM), pages 155–164, 2011. [200] S.A. Roubtsov, A. Serebrenik, A. Mazoyer, M.G.J. van den Brand, and E. Roubtsova. I2SD: Reverse Engineering Sequence Diagrams from Enterprise Java Beans with interceptors. IET software, 7(3):150–166, 2013. [201] S.A. Roubtsov, A. Telea, and D. Holten. SQuAVisiT: A software quality assessment and visualisation toolset. In the Seventh IEEE International Working Conference on Source Code Analysis and Manipulation (SCAM), pages 155–156, Washington, DC, USA, 2007. IEEE. [202] Routio, P. Theory of Architecture. http://www.uiah.fi/projects/metodi/ 13k.htm. (Accessed September 4, 2014). [203] C.K. Roy, J.R. Cordy, and R. Koschke. Comparison and evaluation of code clone detection techniques and tools: A qualitative approach. Science of Computer Programming, 74(7):470–495, 2009. [204] N. Rozanski and E. Woods. Software Systems Architecture: Working With Stakeholders Using Viewpoints and Perspectives. Addison-Wesley Professional, 2005. [205] SAE International. Architecture Analysis and Design Language. http://www. aadl.info/. [206] A. Sangiovanni-Vincentelli and M. Di Natale. Embedded system design for automotive applications. IEEE Computer, 40(10):42–51, 2007. [207] C.N. Sant’Anna. On the modularity of aspect-oriented design: A concern-driven measurement approach. Pontifica Universidade Catolica do Rio de Janeiro. Computer Science Department., Rio de Janeiro, PhD Thesis, 2008. [208] J. Sch¨ auffele and T. Zurawka. Automotive Software Engineering: Principles, Processes, Methods, And Tools. Society of Automotive Engineers. SAE International, 2005. [209] J. Scheible. Automatisierte Qualit¨ atsbewertung am Beispiel von MATLAB SimulinkModellen in der Automobil-Dom¨ ane. PhD thesis, Universit¨at T¨ ubingen, Wilhelmstr. 32, 72074 T¨ ubingen, 2012. [210] M. Schulze, J. Weiland, and D. Beuche. Automotive model-driven development and the challenge of variability. In the 16th International Software Product Line Conference (SPLC), volume 1, pages 207–214. ACM, 2012. [211] A. Serebrenik, S.A. Roubtsov, and M.G.J van den Brand. Dn -based architecture assessment of Java Open Source software systems. In IEEE 17th International Conference on Program Comprehension, pages 198–207. IEEE, 2009. [212] A. Serebrenik and M.G.J van den Brand. Theil index for aggregation of software metrics values. In IEEE International Conference on Software Maintenance, pages 1–9, 2010.
Bibliography
145
[213] M. Shepperd and D. Ince. Derivation and Validation of Software Metrics. International Series of Monographs on Computer Science. Clarendon Press, 1993. [214] D.J. Sheskin. Handbook of Parametric and Nonparametric Statistical Procedures. Chapman & Hall, 4th edition, 2007. [215] S. Shiraishi and M. Abe. Automotive system development based on collaborative modeling using multiple ADLs. In European Software Engineering Conference/Foundations of Software Engineering (ESEC/FSE), pages 1–4, 2011. [216] B. Shishkov, Z. Xie, K. Lui, and J. Dietz. Using norm analysis to derive use case from business processes. In Workshop on Organizations Semiotics (WOS), pages 14–15, 2002. [217] R. Shorey. Emerging trends in vehicular communications. IEEE, 2014. [218] Software Quality Metrics Methodology Working Group. IEEE Standard for a Software Quality Metrics Methodology, 1998/2004. [219] Sparx Systems. Enterprise Architect. http://www.sparxsystems.com/. (Accessed June 12, 2014). [220] M.K. Starr. Modular production–a new concept. Harvard business review, 43(6):131– 142, 1965. [221] M.K. Starr. Modular production–a 45-year-old concept. International Journal of Operations & Production Management, 30(1):7–19, 2010. [222] N. Steinkamp and J. Reed. Automotive industry: Warranty and recall annual report. SAA, 2013. [223] M. Stephan, M.H. Alalfi, A. Stevenson, and J.R. Cordy. Using mutation analysis for a model-clone detector comparison framework. In International Conference on Software Engineering (ICSE), pages 1261–1264. IEEE, 2013. [224] I. St¨ urmer and H. Pohlheim. Model quality assessment in practice: How to measure and assess the quality of software models during the embedded software development process. In Embedded Real Time Software and Systems, 2012. [225] The ATESST Consortium. EAST-ADL 2.0 Specification. http://www. atesst.org/home/liblocal/docs/EAST-ADL-2.0-Specification_ 2008-02-29.pdf. [226] The Boston Consulting Group. Automotive industry is entering a new golden era of innovation. http://www.bcg.com/media/PressReleaseDetails.aspx? id=tcm:12-152696, 2014. [227] The Consultative Committee for Space Data Systems. Reference architecture for space data systems. http://public.ccsds.org/publications/. [228] The TIMMO Consortium. TADL: Timing Augmented Description Language version 2. http://www.timmo-2-use.org/timmo/index.htm. (Accessed June 27, 2014).
146
Bibliography
[229] M. Toomim, A. Begel, and S.L. Graham. Managing duplicated code with linked editing. In IEEE Symposium on Visual Languages and Human Centric Computing (VL/HCC), pages 173–180. IEEE, 2004. [230] Minh T.Q. and I. Kreuz. Refactoring of Simulink models. In MathWorks Automotive Conference, 2012. [231] M.G.J. van den Brand, Z. Proti´c, and T. Verhoeff. A generic solution for syntaxdriven model co-evolution. In TOOLS, pages 36–51, 2011. [232] M.G.J. van den Brand, S.A. Roubtsov, and A. Serebrenik. SQuAVisiT: A flexible tool for visual software analytics. In the European Conference on Software Maintenance and Reengineering (CSMR), pages 331–332, Washington, DC, USA, 2009. IEEE. [233] V. van Reeven, T. Hofman, R.G.M. Huisman, and M. Steinbuch. Extending energy management in hybrid electric vehicles with explicit control of gear shifting and start-stop. In American Control Conference (ACC), pages 521–526. IEEE, 2012. [234] B. Vasilescu, A. Serebrenik, M. Goeminne, and T. Mens. On the variation and specialisation of workload–a case study of the Gnome ecosystem community. Empirical Software Engineering, 19(4):955–1008, 2014. [235] B. Vasilescu, A. Serebrenik, and M.G.J. van den Brand. By no means: a study on aggregating software metrics. In International Workshop on Emerging Trends in Software Metrics (WETSoM), pages 23–26, New York, NY, USA, 2011. ACM. [236] B. Vasilescu, A. Serebrenik, and M.G.J van den Brand. You can’t control the unfamiliar: A study on the relations between aggregation techniques for software metrics. In the 27th IEEE International Conference on Software Maintenance (ICSM), pages 313–322, 2011. [237] S. Vestal. MetaH support for real-time multi-processor avionics. In Parallel and Distributed Real-Time Systems workshop, pages 11–21, 1997. [238] S. Wagner, A. Goeb, L. Heinemann, M. Kl¨as, C. Lampasona, K. Lochmann, A. Mayr, R. Pl¨ osch, A. Seidl, J. Streit, et al. Operationalised product quality models and assessment: The Quamoco approach. Information and Software Technology, 62:101– 123, 2015. [239] P.D. Webster and J.M. Young. Computer aided gating systems design. The British Foundryman, 94:276–284, 1986. [240] T. Weilkiens. Systems engineering with SysML/UML: modeling, analysis, design. Morgan Kaufmann, 2011. [241] S.A. Whitmire. Object Oriented Design Measurement. John Wiley & Sons, Inc., New York, NY, USA, 1st edition, 1997. [242] F. Wilcoxon. Individual comparisons by ranking methods. Biometrics Bulletin, 1(6):80–83, 1945. [243] R.K. Yin. Case study research: Design and methods. Sage publications, 2013. [244] J. Yoshida. Honda admits software problem. http://www.eetimes.com/ document.asp?doc_id=1323061, 2014. (Accessed August 10, 2014).
Bibliography
147
[245] E. Yourdon and L.L. Constantine. Structured design: Fundamentals of a discipline of computer program and systems design, volume 5. Prentice-Hall Englewood Cliffs, 1979. [246] C. Zapata, G. Gonz´ alez, and A. Gelbukh. A rule-based system for assessing consistency between UML models. Mexican International Conference on Advances in Artificial Intelligence (MICAI), pages 215–224, 2007. [247] D.W. Zimmerman and B.D. Zumbo. Parametric alternatives to the Student t test under violation of normality and homogeneity of variance. Perceptual and Motor Skills, 74(3(1)):835–844, 1992.
Summary
On the Design of an Architecture Framework and Quality Evaluation for Automotive Software Systems Nowadays, 90 percent of the innovation in vehicles is enabled by software. Over the past thirty years different methods have been developed to tackle the increasing complexity and to decrease the development costs of the automotive software systems. In the scope of this thesis, automotive architectural modeling and quality evaluation methods have been addressed. According to the ISO 42010 standard, an Architecture Description language (ADL) and an Architecture Framework (AF) are the key mechanisms used in architecture descriptions. ADLs can exist without respective AFs. However, the successful application of an ADL can depend on the proper definition of an AF, since an AF enables better organization and application of an ADL with clear separation of concerns. Although automotive ADLs have been developed over the last decade, only in recent years, automotive companies started to take initiative in defining an architecture framework for automotive systems, e.g., the Architecture Design Framework by Renault. The first draft of the Automotive Architecture Framework (AAF) was already proposed half a decade ago by Broy. The first contribution of this thesis is the definition of an Architecture Framework for Automotive Systems (AFAS), which fills a major gap between existing automotive AFs and ADLs that was identified during the literature review and the evaluation of automotive ADLs. During the evaluation of automotive ADLs, we identified the lack of the capability to ensure the architectural quality. Even though quality models based on the ISO/IEC SQuaRe quality standard have been specified for MATLAB Simulink design models, the quality framework for automotive architectural models has not been defined. Based on a series of structured interviews with architects (from one automotive company) responsible for modeling automotive software at different architectural viewpoints, we identified consistency, modularity, and complexity as the three main pillars of quality for automotive architectures. Modeling hierarchal elements consistently from different architectural viewpoints, and handling data and control complexity are the key needs of automotive architecture modeling. Therefore, the second contribution of this thesis is the definition and development of the quality evaluation framework for automotive software systems. Ensuring consistency between the different architectural viewpoints is one of the key issues regarding architectural quality of automotive systems. Correspondence rules between architectural viewpoints are not formally defined in the scope of the automotive architecture description mechanisms. Therefore, we propose a consistency detection mechanism based on correspondence rules between automotive architectural viewpoints
150
Summary
and developed a prototype tool to perform this consistency checking between different architectural viewpoints. The consistency checking approach and the prototype tool were evaluated in the scope of an Adaptive Cruise Control modeling between two separate teams emulating OEM and automotive supplier. To evaluate modularity and complexity, we follow the Goal-Question-Metric (GQM) approach. By conducting a series of interviews with automotive architects and reviewing relevant standards, we have identified complexity and modularity aspects serving as goals in GQM. Then based on the academic and industrial publications, we have identified a series of questions that need to be answered to achieve the aforementioned goals. Automotive architects have again reviewed these questions. Finally, we have defined metrics required to answer the questions, and identified/implemented tools capable of measuring and presenting these metrics. The quality framework has been applied to industrial automotive architectural and design models. Results of the framework application have been evaluated by means of qualitative and quantitative analyses. By applying the framework to three subsequent releases of an architectural model and the corresponding design models, we have observed, for example, that addition of new functionality or bug fixing in design models often come at a price of increased complexity at the design level, and sometimes compromise modularity of the architectural model. To facilitate the quality evaluation process, the framework applies visual analytics approach for the visualization of modularity and complexity with the help of SQuAVisiT toolset. This approach enables early feedback about software quality making it cheaper and easier to reuse and maintain than traditional techniques. In addition to the visualizations, a mechanism for clone management based on Variant Configuration Language (VCL) is developed to manage model clones and variants. The benefits of using VCL as the variability technique includes separating the variability concern from the functionality concern. The variability mechanism has been validated by converting a number of clone pairs with a varied set of differences into generic representations of VCL. To summarize, we defined an architecture framework for automotive software systems with a coherent set of viewpoints and views for automotive ADLs. Having a coherent set of architecture viewpoints and views and analyzing automotive specific needs for architecture description mechanisms, we identified consistency, modularity, and complexity as the three main quality attributes for automotive software systems. We developed a correspondence rule based method for ensuring consistency between different architectural viewpoints and defined metric sets for assessing modularity and complexity as part of the quality framework. The quality framework is also extended by the quality visualization and clone detection mechanisms to improve software quality.
Curriculum Vitae
Yanjindulam (Yanja) Dajsuren was born on February 7th, 1979 in Gobi-Altai, Mongolia. After obtaining her Bachelor of Science degree in Computer Science with honors in 2000 at the National University of Mongolia (NUM) in Ulaanbaatar, Mongolia, she worked as a Software Developer at the Computer Information Center of the NUM and a Part-time Lecturer and afterwards a Lecturer at the NUM. She earned her Master of Business Administration degree at Maastricht School of Management, the Netherlands in 2002. She obtained a Professional Doctorate in Engineering degree (PDEng) at Eindhoven University of Technology (TU/e), the Netherlands in 2005 and then worked as a (Senior) Research Scientist at Philips Research, NXP Semiconductors, and Virage Logic in the Netherlands. In October 2010 she started a PhD research in collaboration with DAF Trucks NV within the Hybrid Innovations for Trucks (HIT) project at the TU/e in Eindhoven, of which the results are presented in this thesis. Since October 2014 she is employed as a Researcher at the TU/e.
Titles in the IPA Dissertation Series since 2009 M.H.G. Verhoef. Modeling and Validating Distributed Embedded Real-Time Control Systems. Faculty of Science, Mathematics and Computer Science, RU. 2009-01 M. de Mol. Reasoning about Functional Programs: Sparkle, a proof assistant for Clean. Faculty of Science, Mathematics and Computer Science, RU. 2009-02 M. Lormans. Managing Requirements Evolution. Faculty of Electrical Engineering, Mathematics, and Computer Science, TUD. 2009-03 M.P.W.J. van Osch. Automated Modelbased Testing of Hybrid Systems. Faculty of Mathematics and Computer Science, TU/e. 2009-04 H. Sozer. Architecting Fault-Tolerant Software Systems. Faculty of Electrical Engineering, Mathematics & Computer Science, UT. 2009-05 M.J. van Weerdenburg. Efficient Rewriting Techniques. Faculty of Mathematics and Computer Science, TU/e. 2009-06 H.H. Hansen. Coalgebraic Modelling: Applications in Automata Theory and Modal Logic. Faculty of Sciences, Division of Mathematics and Computer Science, VUA. 2009-07 A. Mesbah. Analysis and Testing of Ajax-based Single-page Web Applications. Faculty of Electrical Engineering, Mathematics, and Computer Science, TUD. 2009-08 A.L. Rodriguez Yakushev. Towards Getting Generic Programming Ready for Prime Time. Faculty of Science, UU. 2009-9 K.R. Olmos Joffr´ e. Strategies for Context Sensitive Program Transformation. Faculty of Science, UU. 2009-10 J.A.G.M. van den Berg. Reasoning about Java programs in PVS using JML.
Faculty of Science, Mathematics and Computer Science, RU. 2009-11 M.G. Khatib. MEMS-Based Storage Devices. Integration in Energy-Constrained Mobile Systems. Faculty of Electrical Engineering, Mathematics & Computer Science, UT. 2009-12 S.G.M. Cornelissen. Evaluating Dynamic Analysis Techniques for Program Comprehension. Faculty of Electrical Engineering, Mathematics, and Computer Science, TUD. 2009-13 D. Bolzoni. Revisiting Anomaly-based Network Intrusion Detection Systems. Faculty of Electrical Engineering, Mathematics & Computer Science, UT. 2009-14 H.L. Jonker. Security Matters: Privacy in Voting and Fairness in Digital Exchange. Faculty of Mathematics and Computer Science, TU/e. 2009-15 M.R. Czenko. TuLiP - Reshaping Trust Management. Faculty of Electrical Engineering, Mathematics & Computer Science, UT. 2009-16 T. Chen. Clocks, Dice and Processes. Faculty of Sciences, Division of Mathematics and Computer Science, VUA. 2009-17 C. Kaliszyk. Correctness and Availability: Building Computer Algebra on top of Proof Assistants and making Proof Assistants available over the Web. Faculty of Science, Mathematics and Computer Science, RU. 2009-18 R.S.S. O’Connor. Incompleteness & Completeness: Formalizing Logic and Analysis in Type Theory. Faculty of Science, Mathematics and Computer Science, RU. 2009-19 B. Ploeger. Improved Verification Methods for Concurrent Systems. Faculty of Mathematics and Computer Science, TU/e. 2009-20
T. Han. Diagnosis, Synthesis and Analysis of Probabilistic Models. Faculty of Electrical Engineering, Mathematics & Computer Science, UT. 2009-21 R. Li. Mixed-Integer Evolution Strategies for Parameter Optimization and Their Applications to Medical Image Analysis. Faculty of Mathematics and Natural Sciences, UL. 2009-22 J.H.P. Kwisthout. The Computational Complexity of Probabilistic Networks. Faculty of Science, UU. 2009-23 T.K. Cocx. Algorithmic Tools for Data-Oriented Law Enforcement. Faculty of Mathematics and Natural Sciences, UL. 2009-24 A.I. Baars. Embedded Compilers. Faculty of Science, UU. 2009-25 M.A.C. Dekker. Flexible Access Control for Dynamic Collaborative Environments. Faculty of Electrical Engineering, Mathematics & Computer Science, UT. 2009-26 J.F.J. Laros. Metrics and Visualisation for Crime Analysis and Genomics. Faculty of Mathematics and Natural Sciences, UL. 2009-27 C.J. Boogerd. Focusing Automatic Code Inspections. Faculty of Electrical Engineering, Mathematics, and Computer Science, TUD. 2010-01 M.R. Neuh¨ außer. Model Checking Nondeterministic and Randomly Timed Systems. Faculty of Electrical Engineering, Mathematics & Computer Science, UT. 2010-02 J. Endrullis. Termination and Productivity. Faculty of Sciences, Division of Mathematics and Computer Science, VUA. 2010-03 T. Staijen. Graph-Based Specification and Verification for Aspect-Oriented Languages. Faculty of Electrical Engineering, Mathematics & Computer Science, UT. 2010-04
Y. Wang. Epistemic Modelling and Protocol Dynamics. Faculty of Science, UvA. 2010-05 J.K. Berendsen. Abstraction, Prices and Probability in Model Checking Timed Automata. Faculty of Science, Mathematics and Computer Science, RU. 2010-06 A. Nugroho. The Effects of UML Modeling on the Quality of Software. Faculty of Mathematics and Natural Sciences, UL. 2010-07 A. Silva. Kleene Coalgebra. Faculty of Science, Mathematics and Computer Science, RU. 2010-08 J.S. de Bruin. Service-Oriented Discovery of Knowledge - Foundations, Implementations and Applications. Faculty of Mathematics and Natural Sciences, UL. 2010-09 D. Costa. Formal Models for Component Connectors. Faculty of Sciences, Division of Mathematics and Computer Science, VUA. 2010-10 M.M. Jaghoori. Time at Your Service: Schedulability Analysis of Real-Time and Distributed Services. Faculty of Mathematics and Natural Sciences, UL. 2010-11 R. Bakhshi. Gossiping Models: Formal Analysis of Epidemic Protocols. Faculty of Sciences, Department of Computer Science, VUA. 2011-01 B.J. Arnoldus. An Illumination of the Template Enigma: Software Code Generation with Templates. Faculty of Mathematics and Computer Science, TU/e. 2011-02 E. Zambon. Towards Optimal IT Availability Planning: Methods and Tools. Faculty of Electrical Engineering, Mathematics & Computer Science, UT. 2011-03 L. Astefanoaei. An Executable Theory of Multi-Agent Systems Refinement. Faculty of Mathematics and Natural Sciences, UL. 2011-04
J. Proen¸ ca. Synchronous coordination of distributed components. Faculty of Mathematics and Natural Sciences, UL. 2011-05
M. Raffelsieper. Cell Libraries and Verification. Faculty of Mathematics and Computer Science, TU/e. 2011-15
A. Moralı. IT Architecture-Based Confidentiality Risk Assessment in Networks of Organizations. Faculty of Electrical Engineering, Mathematics & Computer Science, UT. 2011-06
C.P. Tsirogiannis. Analysis of Flow and Visibility on Triangulated Terrains. Faculty of Mathematics and Computer Science, TU/e. 2011-16
M. van der Bijl. On changing models in Model-Based Testing. Faculty of Electrical Engineering, Mathematics & Computer Science, UT. 2011-07 C. Krause. Reconfigurable Component Connectors. Faculty of Mathematics and Natural Sciences, UL. 2011-08 M.E. Andr´ es. Quantitative Analysis of Information Leakage in Probabilistic and Nondeterministic Systems. Faculty of Science, Mathematics and Computer Science, RU. 2011-09 M. Atif. Formal Modeling and Verification of Distributed Failure Detectors. Faculty of Mathematics and Computer Science, TU/e. 2011-10 P.J.A. van Tilburg. From Computability to Executability – A processtheoretic view on automata theory. Faculty of Mathematics and Computer Science, TU/e. 2011-11 Z. Protic. Configuration management for models: Generic methods for model comparison and model co-evolution. Faculty of Mathematics and Computer Science, TU/e. 2011-12 S. Georgievska. Probability and Hiding in Concurrent Processes. Faculty of Mathematics and Computer Science, TU/e. 2011-13 S. Malakuti. Event Composition Model: Achieving Naturalness in Runtime Enforcement. Faculty of Electrical Engineering, Mathematics & Computer Science, UT. 2011-14
Y.-J. Moon. Stochastic Models for Quality of Service of Component Connectors. Faculty of Mathematics and Natural Sciences, UL. 2011-17 R. Middelkoop. Capturing and Exploiting Abstract Views of States in OO Verification. Faculty of Mathematics and Computer Science, TU/e. 2011-18 M.F. van Amstel. Assessing and Improving the Quality of Model Transformations. Faculty of Mathematics and Computer Science, TU/e. 2011-19 A.N. Tamalet. Towards Correct Programs in Practice. Faculty of Science, Mathematics and Computer Science, RU. 2011-20 H.J.S. Basten. Ambiguity Detection for Programming Language Grammars. Faculty of Science, UvA. 2011-21 M. Izadi. Model Checking of Component Connectors. Faculty of Mathematics and Natural Sciences, UL. 2011-22 L.C.L. Kats. Building Blocks for Language Workbenches. Faculty of Electrical Engineering, Mathematics, and Computer Science, TUD. 2011-23 S. Kemper. Modelling and Analysis of Real-Time Coordination Patterns. Faculty of Mathematics and Natural Sciences, UL. 2011-24 J. Wang. Spiking Neural P Systems. Faculty of Mathematics and Natural Sciences, UL. 2011-25 A. Khosravi. Optimal Geometric Data Structures. Faculty of Mathematics and Computer Science, TU/e. 2012-01
A. Middelkoop. Inference of Program Properties with Attribute Grammars, Revisited. Faculty of Science, UU. 2012-02 Z. Hemel. Methods and Techniques for the Design and Implementation of DomainSpecific Languages. Faculty of Electrical Engineering, Mathematics, and Computer Science, TUD. 2012-03 T. Dimkov. Alignment of Organizational Security Policies: Theory and Practice. Faculty of Electrical Engineering, Mathematics & Computer Science, UT. 2012-04 S. Sedghi. Towards Provably Secure Efficiently Searchable Encryption. Faculty of Electrical Engineering, Mathematics & Computer Science, UT. 2012-05 F. Heidarian Dehkordi. Studies on Verification of Wireless Sensor Networks and Abstraction Learning for System Inference. Faculty of Science, Mathematics and Computer Science, RU. 2012-06 K. Verbeek. Algorithms for Cartographic Visualization. Faculty of Mathematics and Computer Science, TU/e. 2012-07
W. Heijstek. Software Architecture Design in Global and Model-Centric Software Development. Faculty of Mathematics and Natural Sciences, UL. 2012-13 C. Kop. Higher Order Termination. Faculty of Sciences, Department of Computer Science, VUA. 2012-14 A. Osaiweran. Formal Development of Control Software in the Medical Systems Domain. Faculty of Mathematics and Computer Science, TU/e. 2012-15 W. Kuijper. Compositional Synthesis of Safety Controllers. Faculty of Electrical Engineering, Mathematics & Computer Science, UT. 2012-16 H. Beohar. Refinement of Communication and States in Models of Embedded Systems. Faculty of Mathematics and Computer Science, TU/e. 2013-01 G. Igna. Performance Analysis of RealTime Task Systems using Timed Automata. Faculty of Science, Mathematics and Computer Science, RU. 2013-02
D.E. Nadales Agut. A Compositional Interchange Format for Hybrid Systems: Design and Implementation. Faculty of Mechanical Engineering, TU/e. 2012-08
E. Zambon. Abstract Graph Transformation – Theory and Practice. Faculty of Electrical Engineering, Mathematics & Computer Science, UT. 2013-03
H. Rahmani. Analysis of ProteinProtein Interaction Networks by Means of Annotated Graph Mining Algorithms. Faculty of Mathematics and Natural Sciences, UL. 2012-09
B. Lijnse. TOP to the Rescue – TaskOriented Programming for Incident Response Applications. Faculty of Science, Mathematics and Computer Science, RU. 2013-04
S.D. Vermolen. Software Language Evolution. Faculty of Electrical Engineering, Mathematics, and Computer Science, TUD. 2012-10
G.T. de Koning Gans. Outsmarting Smart Cards. Faculty of Science, Mathematics and Computer Science, RU. 2013-05
L.J.P. Engelen. From Napkin Sketches to Reliable Software. Faculty of Mathematics and Computer Science, TU/e. 2012-11
M.S. Greiler. Test Suite Comprehension for Modular and Dynamic Systems. Faculty of Electrical Engineering, Mathematics, and Computer Science, TUD. 2013-06
F.P.M. Stappers. Bridging Formal Models – An Engineering Perspective. Faculty of Mathematics and Computer Science, TU/e. 2012-12
L.E. Mamane. Interactive mathematical documents: creation and presentation. Faculty of Science, Mathematics and Computer Science, RU. 2013-07
M.M.H.P. van den Heuvel. Composition and synchronization of real-time components upon one processor. Faculty of Mathematics and Computer Science, TU/e. 2013-08
J. van den Bos. Gathering Evidence: Model-Driven Software Engineering in Automated Digital Forensics. Faculty of Science, UvA. 2014-01
J. Businge. Co-evolution of the Eclipse Framework and its Third-party Plug-ins. Faculty of Mathematics and Computer Science, TU/e. 2013-09
D. Hadziosmanovic. The Process Matters: Cyber Security in Industrial Control Systems. Faculty of Electrical Engineering, Mathematics & Computer Science, UT. 2014-02
S. van der Burg. A Reference Architecture for Distributed Software Deployment. Faculty of Electrical Engineering, Mathematics, and Computer Science, TUD. 2013-10
A.J.P. Jeckmans. CryptographicallyEnhanced Privacy for Recommender Systems. Faculty of Electrical Engineering, Mathematics & Computer Science, UT. 2014-03
J.J.A. Keiren. Advanced Reduction Techniques for Model Checking. Faculty of Mathematics and Computer Science, TU/e. 2013-11
C.-P. Bezemer. Performance Optimization of Multi-Tenant Software Systems. Faculty of Electrical Engineering, Mathematics, and Computer Science, TUD. 2014-04
D.H.P. Gerrits. Pushing and Pulling: Computing push plans for disk-shaped robots, and dynamic labelings for moving points. Faculty of Mathematics and Computer Science, TU/e. 2013-12 M. Timmer. Efficient Modelling, Generation and Analysis of Markov Automata. Faculty of Electrical Engineering, Mathematics & Computer Science, UT. 2013-13 M.J.M. Roeloffzen. Kinetic Data Structures in the Black-Box Model. Faculty of Mathematics and Computer Science, TU/e. 2013-14 L. Lensink. Applying Formal Methods in Software Development. Faculty of Science, Mathematics and Computer Science, RU. 2013-15 C. Tankink. Documentation and Formal Mathematics — Web Technology meets Proof Assistants. Faculty of Science, Mathematics and Computer Science, RU. 2013-16 C. de Gouw. Combining Monitoring with Run-time Assertion Checking. Faculty of Mathematics and Natural Sciences, UL. 2013-17
T.M. Ngo. Qualitative and Quantitative Information Flow Analysis for Multithreaded Programs. Faculty of Electrical Engineering, Mathematics & Computer Science, UT. 2014-05 A.W. Laarman. Scalable Multi-Core Model Checking. Faculty of Electrical Engineering, Mathematics & Computer Science, UT. 2014-06 J. Winter. Coalgebraic Characterizations of Automata-Theoretic Classes. Faculty of Science, Mathematics and Computer Science, RU. 2014-07 W. Meulemans. Similarity Measures and Algorithms for Cartographic Schematization. Faculty of Mathematics and Computer Science, TU/e. 2014-08 A.F.E. Belinfante. JTorX: Exploring Model-Based Testing. Faculty of Electrical Engineering, Mathematics & Computer Science, UT. 2014-09 A.P. van der Meer. Domain Specific Languages and their Type Systems. Faculty of Mathematics and Computer Science, TU/e. 2014-10
B.N. Vasilescu. Social Aspects of Collaboration in Online Software Communities. Faculty of Mathematics and Computer Science, TU/e. 2014-11 F.D. Aarts. Tomte: Bridging the Gap between Active Learning and Real-World Systems. Faculty of Science, Mathematics and Computer Science, RU. 2014-12 N. Noroozi. Improving Input-Output Conformance Testing Theories. Faculty of Mathematics and Computer Science, TU/e. 2014-13 M. Helvensteijn. Abstract Delta Modeling: Software Product Lines and Beyond. Faculty of Mathematics and Natural Sciences, UL. 2014-14 P. Vullers. Efficient Implementations of Attribute-based Credentials on Smart Cards. Faculty of Science, Mathematics and Computer Science, RU. 2014-15 F.W. Takes. Algorithms for Analyzing and Mining Real-World Graphs. Faculty of Mathematics and Natural Sciences, UL. 2014-16 M.P. Schraagen. Aspects of Record Linkage. Faculty of Mathematics and Natural Sciences, UL. 2014-17 G. Alp´ ar. Attribute-Based Identity Management: Bridging the Cryptographic Design of ABCs with the Real World. Faculty of Science, Mathematics and Computer Science, RU. 2015-01 A.J. van der Ploeg. Efficient Abstractions for Visualization and Interaction. Faculty of Science, UvA. 2015-02 R.J.M. Theunissen. Supervisory Control in Health Care Systems. Faculty of Mechanical Engineering, TU/e. 2015-03
T.V. Bui. A Software Architecture for Body Area Sensor Networks: Flexibility and Trustworthiness. Faculty of Mathematics and Computer Science, TU/e. 2015-04 A. Guzzi. Supporting Developers’ Teamwork from within the IDE. Faculty of Electrical Engineering, Mathematics, and Computer Science, TUD. 2015-05 T. Espinha. Web Service Growing Pains: Understanding Services and Their Clients. Faculty of Electrical Engineering, Mathematics, and Computer Science, TUD. 2015-06 S. Dietzel. Resilient In-network Aggregation for Vehicular Networks. Faculty of Electrical Engineering, Mathematics & Computer Science, UT. 2015-07 E. Costante. Privacy throughout the Data Cycle. Faculty of Mathematics and Computer Science, TU/e. 2015-08 S. Cranen. Getting the point — Obtaining and understanding fixpoints in model checking. Faculty of Mathematics and Computer Science, TU/e. 2015-09 R. Verdult. The (in)security of proprietary cryptography. Faculty of Science, Mathematics and Computer Science, RU. 2015-10 J.E.J. de Ruiter. Lessons learned in the analysis of the EMV and TLS security protocols. Faculty of Science, Mathematics and Computer Science, RU. 2015-11 Y. Dajsuren. On the Design of an Architecture Framework and Quality Evaluation for Automotive Software Systems. Faculty of Mathematics and Computer Science, TU/e. 2015-12