DORADO LAYOUT
10/22/08
3:33 PM
Page 148
ACCEPTED FROM OPEN CALL
On the Duration and Spatial Characteristics of Internet Traffic Measurement Experiments José Luis García-Dorado, José Alberto Hernández, Javier Aracil, and Jorge E. López de Vergara, Universidad Autónoma de Madrid Francisco J. Monserrat, Esther Robles, and Tomás P. de Miguel, RedIRIS — Spanish National Research and Education Network
148
ABSTRACT
INTRODUCTION
Often, Internet measurement-based studies have followed a three-step procedure: collection of network measurements; measurementbased model inference; and generalization of the results obtained to other scenarios. Indeed, it has been a general belief that certain internetwork traffic statistics, such as the most used IP addresses and port numbers, show a similar behavior in networks with similar features, and the conclusions derived from the measurements of a given network could be extrapolated to a similar scenario. This study makes no starting assumption concerning this issue and undertakes a “spatial” analysis of network measurements. The measurement set comprises a six-month trace collected by RedIRIS (the Spanish National Research and Education Network) at different monitored points across the country. Our experiment shows that, although the frequency statistics of IP addresses and port numbers follow a Zipf distribution (as expected), the distributions’ characteristic parameter values vary significantly in a spatial dimension (i.e., across individual university networks), even when the profile of the networks’ user bases are similar. In practical terms, this means network designers, analysts, and operators should not assume that statistics for Internet site and applications usage for one network may accurately characterize other networks, even when those networks have similar user bases and environments. Furthermore, we show that experiment durations of approximately 30 days are necessary for the traffic processes to display stationarity. Hence, in order to obtain accurate statistics on traffic characteristics of large internetworks using state-of-the-art measurement techniques, long and spatially diverse experiments may be necessary.
Network traffic measurements collected across the Internet provide very meaningful information for researchers, service providers, and other members of the Internet community [1]. On one hand, network operators may benefit from such information in their goal of ensuring the appropriate quality of service (QoS) to their customers. Indeed, the ever-increasing user demands and wide variety of application requirements are forcing Internet service providers (ISPs) to develop network capacity plans very carefully, not only to maintain the QoS provided, but also to reduce the need for investment. ISPs have not underestimated the benefits of traffic measurements, and have traditionally applied their potential to other related fields, namely the performance evaluation of networks, the detection of anomalies and denial of use attacks, and even the generation of the clients’ invoices [2]. On the other hand, the research community has also found essential the use of real network measurements to better understand Internet dynamics and further apply this knowledge to the development of network models, with direct application to network operators’ needs mentioned above [3]. However, the collection of representative traffic measurements is not a straightforward process. In light of this, the authors in [4] provide a detailed explanation of the problems that can be found in the simulation of the Internet, some of which also arise in the process of measuring networks. Examples of such problems include the large size and heterogeneous nature of the Internet, the ever-increasing number of new applications being introduced to the network, the fast and unpredictable way the Internet changes, the size and date of the sample collected, and the handling of outliers in the
0163-6804/08/$25.00 © 2008 IEEE
IEEE Communications Magazine • November 2008
DORADO LAYOUT
10/22/08
3:33 PM
Page 149
measuring process. To overcome these limitations, the authors in [4] try to identify invariants in Internet behavior in order to reduce the complexity of its characterization. An invariant is defined as a facet of behavior that is empirically shown to persist for some time in a wide set of measured samples. Examples include diurnal patterns of activity, the probability distributions that describe connection sizes and durations, and the distribution of interarrival times between consecutive packets in aggregated Internet traffic and between network user sessions. In this article we pinpoint two additional difficulties: first, the spatial diversity of measurements, that is, whether the information arisen from measurements collected at diverse locations with similar features differs significantly or not; and second, the time required to capture stationarity, the temporal diversity, that is, the amount of measuring time needed to bring a sampled distribution that persists over time. Essentially, we try to answer the following two questions: Can the conclusions derived from a measurement experiment in a given network be further applied to a similar network/scenario? And, how long should the measurement experiments last until stability in the metrics under study is reached? Throughout this article, the term similar networks shall refer to networks that share certain common intrinsic features. In this light the research community has generally accepted that the conclusions derived from a given network are valid for a scenario with similar characteristics, such as population size, bandwidth capacity, and filtering policy. Therefore, measurements have been taken from links that are believed to be sufficiently representative of the Internet, typically university, residential, or even smaller networks. To answer the questions above, this work studies the distribution of the most popular IP addresses and port numbers (often bound to specific services/applications) in a set of university network access points nationwide. It is worth noting that this study is not focused on the measurement results themselves, which have been reported elsewhere, but instead on the representativeness of network measurement experiments in terms of spatial and temporal diversity. Temporal diversity is related to the concept of “horizontal aggregation” introduced in [5], whereby the authors study the necessary timescale such that aggregated traffic follows a Gaussian distribution. However, in this article we follow a rather different approach: the problem is not to estimate the timescale to reach Gaussianity but to rather find the time horizon above which the distribution parameters remain stable. Such a time horizon is typically in the range of days or weeks, much coarser than those often considered in such horizontal aggregation studies (seconds or milliseconds). Other work has aimed at ranking the top traffic generators in a network scenario, often known as “heavy hitters,” and their persistence over time in such ranking [6]. Again, this is not the purpose of this article since we are only taking into account the traffic distribution for the most active ports and IP addresses, without making an explicit identification of them. Concerning spatial diversity, this has received
IEEE Communications Magazine • November 2008
little attention from the research community. For instance, the authors in [7] make a comparison study of the inter- and intra-use of mainframes between seven Japanese regions in the late 1980s; nonetheless, the spatial diversity of the measurements was not analyzed. We believe that such lack of spatial diversity related studies is due to the difficulties in capturing traffic from a large number of distant networks and over large periods of time. In fact, this work analyzes an extensive set of measurements (Netflow records) collected from a large number of university networks kindly donated by RedIRIS (the Spanish National Research and Education Network [NREN]). The following analysis is performed over the traffic flow records collected from April to September 2007, comprising a total of 13,000 million flows. RedIRIS spans more than 70 universities whose size, user population, and organization is well documented in central repositories by the Spanish Ministry of Education for statistical purposes. Therefore, it is possible to group universities by similar features, such as number of users, bandwidth, and traffic filters (e.g., restrictions on peer-to-peer [P2P] applications such as music file sharing), and proceed with the analysis to check whether or not university networks with similar intrinsic characteristics produce similar traffic patterns. The remainder of this work is organized as follows. The next section describes in detail the topology of the Spanish NREN and the measurement set under study. We then present the experiments performed and results obtained in both the time and space dimensions. Finally, we conclude this work and summarize the main findings obtained.
RedIRIS spans more than 70 universities whose size, user population, and organization is well documented in central repositories by the Spanish Ministry of Education for statistical purposes. Therefore, it is possible to group universities by similar features.
MEASUREMENTS The Spanish NREN serves more than 260 institutions, mainly universities and research centers, and comprises 18 points of presence across the country, as shown in Fig. 1. For the experiments, RedIRIS provided the traffic measurements at the access routers of a large number of universities interconnected by the Spanish NREN, typically of bandwidth ranging from 100 Mb/s to 1 Gb/s. In what follows we denote downstream traffic as the collection of flows that are sourced by a host located somewhere in the Internet and destined for a host located in the university network, and we denote upstream traffic as the converse (i.e., the collection of flows that are sourced by a host in the university network and destined for a host in the Internet, Fig. 2). Note that with these definitions, interuniversity traffic is neither downstream nor upstream traffic; indeed we did not include such traffic in our experiments.
DATA COLLECTION INFRASTRUCTURE In this section we describe the data collection infrastructure and data format. All the access routers feature flow monitoring (Netflow) capabilities. A flow is a sequence of packets that share the same source and destination IP addresses, port numbers, and protocol. In this
149
DORADO LAYOUT
10/22/08
3:33 PM
Page 150
Processing system 2
Flow collector 1
3
Data repository
Monitoring system
■ Figure 1. Measurement system architecture (on the left) and RedIRIS network topology (on the right).
UNIVERSITY NETWORKS UNDER STUDY Destination IP addresses and port numbers Internet side
University network side Upstream Downstream
Origin IP addresses and port numbers
■ Figure 2. Analyzed data: Destination IP addresses and port numbers for upstream flows, and origin IP addresses and port numbers of downstream flows.
light, a flow summary includes traffic volume in bytes and packets, port numbers, source and destination IP addresses, type of service, input and output interface indices (as per Simple Network Management Protocol [SNMP] management information base [MIB]), together with timestamps for the flow beginning and end. For a thorough description of Netflow, the reader is referred to Internet Engineering Task Force Request for Comments (IETF RFC) 3955. The flow summaries are sent to a central repository, located at the Universidad Autónoma de Madrid (UAM) campus. The average input rate to the repository was 2 Mb/s (flow summaries) over a six-month period (April to September 2007). Figure 1 shows the measurement system architecture. First, the Flow-Tools software package was used for data collection at the repository. Then a number of statistics were obtained by the processing subsystem, which included total bandwidth consumption per university, peak hour bandwidth requirements, and most active IP addresses and port numbers. Finally, the monitoring system provides a graphical interface through which such processed information can be accessed via the Web and properly visualized (this is the third stage).
150
The collected traffic sample comprised more than 70 universities, with different user base populations, access link capacities, filtering policies (P2P applications), proxies, and Network Address Translation (NAT) capabilities. Clearly, such intrinsic features have an impact on the traffic pattern. For instance, if NAT services or proxies are available, it is very possible to find that most traffic comes from a single IP address, but the truth is that a large number of traffic sources are sharing the same IP address. In the same way, NAT not only affects IP addresses but also port numbers, since every traffic source under the same IP address is given a different port number. Consequently, we made a choice of universities with similar features, and compared the resulting most popular ports and IP addresses distribution. In this light we have carefully selected nine universities out of the total set for which the above intrinsic features are very much alike. First, regarding the filtering policy, we have chosen universities in which most noneducational traffic is allowed with no rate control except for well-known peer-to-peer applications. Additionally, it is worth noticing that the analyzed measurements comprise traffic to the Internet only, not between campuses. Thus, such interuniversity traffic from supercomputing or grid facilities is explicitly not included. Furthermore, we also performed an inspection of the most active flows in order to ensure that no outliers were present in the sample. Second, concerning the use of NAT, we focus on most frequently accessed IP addresses and ports on the Internet side, that is, destination IP addresses and port numbers of upstream flows from campus networks, and origin IP addresses and port numbers of downstream flows (Fig. 2). Such measurements provide a more meaningful and representative portrait of user behavior when browsing Internet content, rather than pursuing a characterization of Internet users that
IEEE Communications Magazine • November 2008
DORADO LAYOUT
10/22/08
3:33 PM
Page 151
Universities
Population (ratio students/staff)
No. of flows per day
Different IP addresses in the peak hour (from university/to Internet)
U1
40,000 (9.6)
1,400,000
4000/23,000
similar features, and
U2
29,000 (10.8)
1,300,000
4000/22,800
compared the
U3
20,000 (12)
2,000,000
3200/30,000
U4
31,500 (11)
5,870,000
5000/90,000
We made a choice of universities with
resulting most popular port and IP addresses distribution. In this U5
30,500 (10.3)
3,000,000
4300/66,000
U6
36,000 (11.2)
4,000,000
5600/66,000
U7
33,500 (12.2)
3,500,000
4500/58,000
U8
26,500 (11.2)
2,400,000
6500/30,000
U9
28,000 (10.5)
2,500,000
light, we have carefully selected nine universities out of the total set, for which the above intrinsic features are
2000/30,000
very much alike.
■ Table 1. User base population size, average number of flows collected per day, and average IP addresses in the peak hour per day for all universities under study. access hosts in university campuses. Anyway, it is worth mentioning that the selected centers make negligible use of NAT and proxies, if any. The population size of the universities under study ranges from 20,000 to 40,000 members with a similar proportion between subpopulations (strata, i.e., students, faculty, and administration), thus favoring the representativeness of the aggregated traffic (Table 1). Furthermore, this table shows the number of collected Netflow summaries for the selected universities, along with the number of active IP addresses in the peak traffic hour. The latter gives a hint of the population activity, to reinforce the fact that the sample is representative in terms of number of active users. In addition to this, the access bandwidth capacity in all universities under study is exactly 1 Gb/s, and they are connected to the Internet through a single exchange point located in Madrid. We conclude that the selected universities are similar in terms of user base populations, access link capacity, filtering policies (P2P applications), and availability of proxies and NAT services. It is finally worth remarking that the measurements were collected over the same time period, thus avoiding any contamination of the spatial diversity by temporal factors.
EXPERIMENTS AND RESULTS The following presents a measurement analysis from the spatial diversity point of view, that is, whether or not equivalent universities share similar behavior. It also shows the timescale for which the observed behavior becomes stable (i.e., the sampling distribution does not significantly change as the sample size increases). A typical invariant that can be observed from measurements of a university network concerns the IP addresses and port numbers most widely found in the traces. It is well known that, although the amount of possible destination IP addresses of flows and port numbers is huge, most users typically connect to the same sites
IEEE Communications Magazine • November 2008
and use the same services [8]. Moreover, the amount of traffic either sourced or destined to the most popular IP addresses and port numbers follows a Zipf distribution. Zipf-like phenomena has been observed in the past in internetwork traffic traces [9], and often appears in other disciplines, such as economics, sociology, and linguistics. The Zipf cumulative distribution function is given by F (k ) =
∑ nk=11 / n s , ∑ nN=11 / n s
k = 1,…, N ,
where s > 0 characterizes the Zipf distribution, N is the number of most popular IP addresses or port numbers included in the study, and k refers to their rank. In our spatial analysis we study the most popular (comprising most exchanged traffic in bytes) IP addresses and port numbers. Thus, we shall use F(k) to represent the cumulative fraction of traffic (in bytes) over the total that are sent to the kth most popular IP address or port number k = 1, …, N in the Internet. For example, in Zipf distributions with s = 1, the most popular port number (k = 1) or IP address comprises as much as twice the traffic exchanged by the second (k = 2) most popular one, and thrice the traffic of the third (k = 3) most popular one, and so on. For s > 1, the percentage of total traffic of the most popular port numer or IP address with respect to the others is even larger and vice versa (i.e., if s < 1, such percentage is smaller). Hence, the s parameter is related to the tail decay of the Zipf distribution. The purpose of the following experiments (spatial diversity) is to check whether or not university networks with similar intrinsic features, as discussed in the previous section, show the same behavior in terms of the s parameter of the Zipf law. However, prior to any spatial analysis, it is
151
DORADO LAYOUT
10/22/08
3:33 PM
Page 152
1 day
30 days
0.35
0.35 U1 real data Zipf fit s=1.5689
U1 real data Zipf fit s=1.2732 0.3
0.3
CDF
CDF
0.25 0.25
0.2 0.2
0.15
0
5 10 Rank index of most popular port numbers
0.1
15
0
5 10 Rank index of most popular port numbers
1 day
30 days 0.1
0.4 U1 real data Zipf fit s=0.6
U1 real data Zipf fit s=1.099 0.08
CDF
CDF
0.3
0.2
0.06
0.04
0.1
0
15
0
5 10 Rank index of most popular IP numbers
15
0.02
0
5 10 Rank index of most popular IP numbers
15
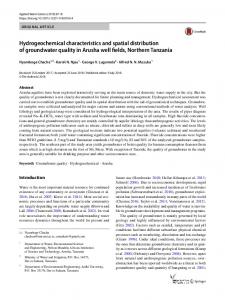
■ Figure 3. Cumulative distribution function of most popular port numbers and IP addresses (upstream) for U1 and its Zipf distribution fit, assuming one day of data (left) and 30 days of data (right).
first necessary to find a timescale at which the parameters under study are stable. This is the purpose of the next section.
TEMPORAL DIVERSITY ANALYSIS This section examines the temporal aspect of the measurement set over which we perform the spatial diversity analysis in the next section. In other words, this section aims to check that the measurement set under study shows stationarity features (i.e., distributions that do not change with time). To do so, we evaluate the number of days worth of data required until the s parameter of the Zipf distribution for the most popular IP addresses and port numbers remains stable. Figure 3 shows the most active destination IP addresses and port numbers of upstream flows for University U 1 (for 1-day and 1-month time slots), together with its most likely Zipf distribution, obtained following the linear least squares regression technique described in [10]. The accuracy between the measured data and the theoretical Zipf fit can be visually checked in the figure. Note that only the 15 (N = 15) most popular IP addresses and port numbers were taken into account in the estimation of the Zipf parameter s. We remark that similar behavior was observed for N = 8 and N = 20, although such results have not been included for the sake of brevity. This figure also shows that the Zipf model most accurately matches the measurements when 30 days worth of data is assumed (Fig. 3,
152
right). Additionally, the estimated s values vary for different timescales. Hence it is necessary to consider a large traffic sample until the s parameter becomes stable. Following this, Fig. 4 shows the estimated s value assuming several days of measurements. As shown, the s parameter estimate becomes smoother as we increase the trace length, bringing a stable value after 30 days of data. We consider an s estimate stable if it varies less than 5 percent after five consecutive days. It is also worth noticing that the s estimate after 30 days of data is different for all networks under consideration. This issue is analyzed in the next section.
SPATIAL DIVERSITY OF MOST POPULAR IP ADDRESSES AND PORT NUMBERS Figure 5 shows the cumulative distribution function (CDF) of the 15 most popular IP addresses (on the right) and port numbers (on the left) for all universities under study, in both the upstream (top) and downstream (bottom) directions from the Internet side. The numbers shown refer to the cumulative ratio of transferred bytes over the total in the trace. Following the results of the previous section, we have used 30 days worth of data in order to obtain a reliable estimate of the CDF. Surprisingly, although the networks under study were carefully chosen with similar intrinsic features (large aggregation level, filtering policy, access bandwidth, proxies, NAT, and population
IEEE Communications Magazine • November 2008
DORADO LAYOUT
10/22/08
3:33 PM
Page 153
University 1
University 2
1
2 Zipf s parameter
1.5
0.5
1.5 1 0.5
0
10
20 Days
30
40
10
University 4
30
40
0
1 0.5 30
1.5 1
40
10
University 7
20 Days
30
1.5 1 0.5
0
10
20 Days
0
10
30
40
40
0
10
2 Zipf s parameter
Zipf s parameter
0.5
20 30 Days University 9
1
University 8
1
40
1.5
40
2
1.5
30
0.5 0
2
20 Days University 6
0.5 20 Days
10
2 Zipf s parameter
1.5
10
1
University 5
Zipf s parameter
Zipf s parameter
20 Days
2
0
1.5
0.5 0
2
Zipf s parameter
University 3
2 Zipf s parameter
Zipf s parameter
2
1.5 1 0.5
0
10
20 Days
Most popular port numbers
30
40
20 Days
30
40
Most popular IP addresses
■ Figure 4. Most-likely Zipf distribution s value for the 15 most popular port numbers and IP addresses for all university networks (only upstream flow direction) for various timescales of traffic statistics (from 1 to 40 days of aggregated data). size and strata), the observed traffic profiles, as measured by the s parameter values, are different from one another. It is worth noticing that the population sizes of all networks under study are large enough (more than 20,000 Internet users) that the CDFs are expected to converge to the same distribution. In conclusion, the most popular IP addresses and port numbers of each university network follow a Zipf distribution, but the spatial analysis has shown that the particular s parameter is different in each case (Fig. 4). Hence, measurements collected at one university are not generally valid for another, even if they have similar intrinsic features.
CONCLUSIONS AND FUTURE WORK This work provides a new point of view in the study of network measurements: spatial analysis. Essentially, spatial analysis aims to check whether or not the conclusions derived from the analysis of a given set of measurements gathered from a particular network scenario are valid for another similar network scenario. The answer to this question is negative. Although a number of invariants have been identified that persist across
IEEE Communications Magazine • November 2008
different scenarios, our findings show that when measurements from networks with similar intrinsic features are compared, the distribution of the most popular port numbers and IP addresses differ from one network to another. Additionally, the experiments have shown that the distribution of the most popular IP addresses and port numbers experience high variability, and only reach some stability when long periods of measurements are considered, typically in the range of weeks. However, it is important to remark that, given the heterogeneous nature of the Internet and the fast and unpredictable way it changes, the results do not remain valid for long periods of time, thus requiring continuous monitoring and measuring, as noted in [4]. This involves two important consequences. First, the duration of internetwork experiments must last until the measurements under study become stable, which involves a much longer traffic trace than usually believed; second, single-link measurements do not suffice for a meaningful analysis, and hence a spatially diverse measurement experiment must be carried out. As a result, the required measurement infra-
153
DORADO LAYOUT
10/22/08
3:33 PM
Page 154
Upstream
Upstream 0.2
0.35 0.3
0.15
0.2
CDF
CDF
0.25
0.15 0.1
0.1
0.05
0.05 0
0 0
10 5 Rank index of most popular port numbers
15
10 5 Rank index of most popular IP addresses
0
Downstream
15
Downstream
0.8
0.12
0.7
0.1
0.6
0.08
CDF
CDF
0.14
0.5
0.06
0.4
0.04
0.3
0.02
0.2
0 0
10 5 Rank index of most popular port numbers U1
U2
15
U3
U4
U5
10 5 Rank index of most popular IP addresses
0
U6
U7
U8
15
U9
■ Figure 5. CDF of most popular IP addresses and port numbers for all universities under study. structure must be designed accordingly, and may involve sophisticated and costly equipment, in terms of both storage capabilities and number of probes. While this result is worthwhile to report itself, a number of interesting research directions appear from these conclusions, for instance, the search for an explanation of why spatial diversity occurs. As future work, the authors will focus their attention on the most active users, since they are highly variable and seem to be responsible for the majority of traffic generated in an internetwork.
ACKNOWLEDGMENTS This work has been partially funded by the Spanish Ministry of Education and Science under projects DIOR (TEC2006-03246) and CONSOLIDER i-MATH (CSD2006-00032), and the F.P.I. fellowship program. The authors would also like to acknowledge the support of the IMDEA Mathematics Research Institute. The authors are grateful to Dr. Michael O’Donnell for his careful proofreading of this article. Finally, we would also like to thank the anonymous reviewers and liaison editor who helped us to improve the quality of the article.
REFERENCES [1] N. Brownlee and K.C. Claffy, “Understanding Internet Traffic Streams: Dragonflies and Tortoises,” IEEE Commun. Mag., vol. 40, no. 10, Aug. 2002, pp. 110–17.
154
[2] C. Fraleigh et al., “Packet-Level Traffic Measurements from the Sprint IP Backbone,” IEEE Network, vol. 17, no. 6, Aug. 2003, pp. 6–16. [3] S. Floyd and E. Kohler, “Internet Research Needs Better Models,” ACM Comp. Commun. Rev., vol. 33, no. 1, 2003, pp. 29–34. [4] S. Floyd and V. Paxson, “Difficulties in Simulating the Internet,” IEEE/ACM Trans. Net., vol. 9, no. 4, Aug. 2001, pp. 392–403. [5] J. Kilpi and I. Norros, “Testing the Gaussian Approximation of Aggregate Traffic,” Proc. Internet Measurement Wksp., 2002, pp. 49–61. [6] J. Wallerich and A. Feldmann, “Capturing the Variability of Internet Flows Across Time,” Proc. IEEE INFOCOM, 2006, pp. 1–6. [7] J. Murai et al., “Construction of Internet for Japanese Academic Communities,” Proc. ACM/IEEE Conf. Supercomputing, 1989, pp. 737–46. [8] A. Feldmann et al., “Deriving Traffic Demands for Operational IP Networks: Methodology and Experience,” IEEE/ACM Trans. Net., vol. 9, June 2001, pp. 265–80. [9] L.A. Adamic and B.A. Huberman, “Zipf’s Law in the Internet,” Glottometrics, vol. 3, 2002, pp. 143–50. [10] P.T. Nicholls, “Estimation of Zipf Parameters,” J. Amer. Soc. Info. Sci., vol. 38, no. 6, Nov. 1987, pp. 443–45.
BIOGRAPHIES J OSÉ L UIS G ARCI’ A -D ORADO (
[email protected]) received an M.Sc. degree in computer science from Universidad Autónoma de Madrid, Spain, in 2006. He then joined the Networking Research Group at the same university as a researcher in the ePhoton/One Plus Network of Excellence, where he is collaborating on national and European research projects. In 2007 he was awarded a four-year fellowship by the Ministry of Education of Spain (F.P.I scholarship). His research interests are in the analysis of network traffic: its management, modeling, dimensioning, and evolution.
IEEE Communications Magazine • November 2008
DORADO LAYOUT
10/22/08
3:33 PM
Page 155
JOSÉ ALBERTO HERNA’NDEZ (
[email protected]) completed a five-year degree in telecommunications engineering at Universidad Carlos III de Madrid, Spain, in 2002, and a Ph.D. degree in computer science at Loughborough University, Leicestershire, United Kingdom, in 2005. After this, he joined the Universidad Autónoma de Madrid, where he participates in both national and European research projects concerning the modeling and performance evaluation of communication networks. His research interests include the areas in which mathematical modeling and computer networks overlap. JAVIER ARACIL (
[email protected]) received Ph.D. degrees (Honors) from the Technical University of Madrid in 1995, both in telecommunications eengineering. He was a Fulbright scholarship postdoctoral researcher at the University of California, Berkeley, and research scholar at the University of Texas at Dallas. He is currently a full professor at the Universidad Autónoma de Madrid. He has authored more than 100 papers in international conferences and journals. JORGE E. LOPEZ DE VERGARA (
[email protected]) is currently an associate professor in the Computer Science Department of the Universidad Autónoma de Madrid. He received his M.Sc. degree in telecommunications from the Technical University of Madrid in 1998 and finished his Ph.D. in telematics engineering at the same university in 2003, where he held a research grant. He has participated in several Spanish and EU research projects. His current research topics include network, service, and distributed application management and monitoring.
IEEE Communications Magazine • November 2008
F RANCISCO J. M ONSERRAT (
[email protected]) holds a degree in computer engineering from the Universidad de Murcia, Spain. He has been working for RedIRIS, the Spanish NREN, since 1999, with responsibilities in various international forums such as FIRST and TF-CSIRTT. His duties at RedIRIS include forensic and cryptographic analysis, together with participation in the Computer Security Incidents Response Teams. ESTHER ROBLES (
[email protected]) is head of the Network Department at RedIRIS. She is responsible for the network engineering and capacity planning of RedIRIS, with more than 10 years of experience. Additionally, she coordinates the network operational center, and has led the specification and deployment of two national backbones (RedIRIS2 and RedIRIS10). She has participated in several national and international research projects: GN2, FEDERICA, EGEE-III, MUPBED, EUMEDGRID, and EELA. TOMAS P. DE MIGUEL (
[email protected]) is an associate professor at the Telematic Systems Engineering Department (DIT) of the Technical University of Madrid since 1987. He has been involved since 1982 in R&D tasks, participating as researcher and technical manager in many national and international research projects. Actually, he is director of RedIRIS. His current research interests include the development of a new Internet generation for highspeed services and secure services federation.
155