... that we see approaches being presented where the developer only asserts .... In: Galloway Jr R, editor. ... (http://www.waset.org/journals/waset/v54.php).
On the Usability of 3D Display in Parallel Coordinates: Evaluating the Efficiency of Identifying 2D Relationships
Abstract In recent years, several different attempts have been made to extend the well-known technique of parallel coordinates by using a 3D display. This article presents an evaluation that investigates the performance of the 3D parallel coordinates technique and compare it with standard, 2D parallel coordinates for analysis of 2D relationships. 3D parallel coordinates, based on parallel planes instead of parallel axes, has been used for many years within the information visualization community for a variety of applications. Despite its quite common use no formal evaluation detailing its usefulness for different tasks has been conducted. The evaluation presented in this article is the first step towards determining the usefulness of this type of 3D parallel coordinates. The study compared 3D parallel coordinates, using two different axis configurations commonly seen in the literature, with standard 2D parallel coordinates for identification of 2D relationships between variables in multivariate data. This type of task and the relationships to be judged are known to be well supported by 2D parallel coordinates and multi-relational 3D parallel coordinates. The results show, that for identification of 2D relationships, 2D parallel coordinates are superior to the 3D extensions, both in terms of response time and accuracy. Subjective opinions were also in favour of 2D parallel coordinates. The study adds to the much-needed body of work examining the usability of 3D representations in information visualization and for what tasks and data a proposed method is or is not appropriate.
Keywords Information visualization, evaluation, usability, parallel coordinates, 3D parallel coordinates.
1
Introduction
Parallel coordinates are commonly used within the information visualization community for the display of multivariate data. The technique was proposed by Inselberg for analysis of hyperdimensional geometry.1, 2 Parallel coordinates were later used for analysis and visualization of abstract, multivariate data (see, for example, the work by Wegman3 ) and today the technique is considered to be a standard method within this field. During the last 20 years parallel coordinates have been the target of many research projects, primarily within the information visualization community. It has also been adopted within scientific visualization and the more recent research field of visual analytics, with numerous application areas such as bioinformatics, medicine and climate science. The technique is today also incorporated in several commercial applications and frameworks, making it available to a large number of users. A major part of the research on parallel coordinates has aimed at investigating different axis configurations. In parallel coordinates the variables of a data set are represented as parallel axes and each data item is represented as a polyline intersecting all axes at their corresponding values. A popular approach is to extend standard, 2D parallel coordinates to a 3D representation based on the assumption that by adding a third dimension more relationships can be conveyed simultaneously, thus more information about structures in the data can be investigated. The concept of 3D parallel coordinates was proposed by Wegenkittl et al.4 This method, where parallel planes instead of parallel lines, are linked (see figure 1) was the original version that was called 3D parallel coordinates and is the one most commonly seen today. Since then, different variations of this technique have been proposed (see review in the related work section). In this article, the focus is on the originally proposed 3D parallel coordinates technique. Figure 1 illustrates the standard 2D technique with two common 3D extensions using different axis configurations. The basic idea is to extend the one-dimensional axes of standard, 2D parallel coordinates, figure 1(left), into two-dimensional planes where each plane is composed of two axes (variables). In figure 1(middle) each plane is constructed using different variables (V1 , V3 and V2 , V4 ) while in figure 1(right) both planes share one common variable, V3 (extended outwards from the screen, towards the user). The variable(s) used for the third dimension will, hereinafter, be referred to as the Z−variable(s). A screen shot of 3D parallel coordinates with four planes using the different Z−variable configuration, displaying eight variables, is shown in figure 2. The motivations behind extensions of parallel coordinates into 3D often seem quite legitimate: adding a third dimension makes it possible to allow more information to be simultaneously analysed. However the addition of a third dimension has inherent problems, such as clutter, and we need to be aware of possible misleading distortions and take into consideration how these may affect the usability (effectiveness and efficiency6 ) of the representations.5 There are certain conditions where a third dimension is beneficial and others where it will make the representation useless. Different axis arrangements, the amount of information presented in one view, the amount of noise in data and the perspective view are examples of crucial features in visualization that influence the relative usability of each representation for each user task. With respect to the large number of research papers proposing extensions of standard, 2D parallel coordinates into 3D, a very limited number address such usability aspects by providing scientific evaluations. As a matter of fact, to the best of our knowledge, no research paper exists that presents a scientific evaluation of the originally proposed 3D parallel coordinates technique, described above. This lack of justification of the proposed technique should be a major concern within the information visualization community. From a visualization perspective, a lack of knowledge and results about users’ actual performance when using 3D parallel coordinates under different conditions means that we can expect them to misinterpret data or to overlook features in data that actually exist and are being presented.
Figure 1: Illustrations of 2D parallel coordinates and 3D parallel coordinates with two different axis configurations. Left: 2D parallel coordinates. Middle: 3D parallel coordinates with different Z−variables, in this example 4 variables are represented. Right: 3D parallel coordinates with common Z−variable, in this example 3 variables are represented.
Figure 2: An example of 3D parallel coordinates with four planes using the different Z−variable configuration, displaying eight variables.
Evaluation is necessary in order to understand and communicate the potential and limitations of 3D parallel coordinates. In general, evaluation will advance information visualization research by promoting promising research ideas and also preventing less promising ideas from being accepted as valid ones to be expanded upon. This is also how we can present evidence of measurable benefits that will encourage more widespread adoption by real users.7 The main aim of this article is to add to this essential body of knowledge by presenting an evaluation that investigates the usability of 3D parallel coordinates compared with standard 2D parallel coordinates for identification of 2D relationships (patterns) between variables. The reason for focusing only on 2D patterns as reference patterns is that it is not possible to construct unique patterns in a 3D display of parallel coordinates due to the fact that they are the result of the current projection (rotation). In addition, 2D patterns have a clear mathematical description, via the point←→line duality,1 and are the patterns for which users often search when using parallel coordinates. More complex multidimensional patterns are the subject for future studies, as discussed in the future work section. The key research contributions of this article are: • An investigation of the usability of 3D parallel coordinates using two different axis configurations (common Z−variable and different Z−variables) for 2D pattern identification. • A comparison of 3D parallel coordinates versus 2D parallel coordinates • Dissemination of the need and importance of scientific evaluation in visualization.
The remainder of the article is structured as follows. The next section presents and discusses related work on 3D parallel coordinates and issues on usability and evaluation relevant to the research presented in this paper. The following section describes, in detail, the evaluation and the experimental method applied in this study. The final sections discuss the general results, our conclusions and outlines some issues to be considered in future research.
2
Related Work
Parallel coordinates is a highly active field of research which generates a large number of publications each year. Consequently, this related work section does not attempt to cover a full review of the topic. It has a strict focus on, and discusses in detail, the many 3D extensions of parallel coordinates that relate to this work. It also covers the most related evaluation studies within this area. Regarding 2D parallel coordinates we refer the interested reader to the vast amount of literature published by the information visualization community.
2.1
3D Parallel Coordinates and Their Variations
The concept of using 3D parallel coordinates was introduced in 19974, 8 for analysis of higher dimensional systems. This method, where parallel planes instead of parallel lines are linked, see figure 1(middle,right), was the original version that was called 3D parallel coordinates and is the one most commonly seen today. Other attempts where the third dimension, in some way, is used exist in various application domains.
Since 3D parallel coordinates were introduced, different variations have been proposed by researchers for use in various domains. Falkman developed the ‘Cube’ specifically for pattern recognition and statistical analysis of patient medical records.9, 10 With a similar goal, Pham and Cai11 presented a version of 3D parallel coordinates for analysis of clinical data in Chinese medicine. Using the same 3D parallel coordinates technique, R¨ ubel et al.12, 13 investigated its use within Biology and Genetics. Their main aim is to support the biologist studying gene expression patterns. Cvek et al.14 also use a version of 3D parallel coordinates, coupled with self-organizing maps, for analysis of expression data. Streit et al.15 proposed a version for visualization of multidimensional data in the field of Cytomics. Another area where extensions of 2D parallel coordinates into 3D have been proposed is within the analysis and exploration of complex networks. Ahmed et al. use extended parallel coordinates as a main component in the system GEOMI.16 In a similar way, Dwyer et al. use it for analysis of network centrality.17 In a recent article, Viau et al. include a version of 3D parallel coordinates in their system for visualization of multivariate networks.18 Another example of work on extending parallel coordinates into 3D, however not tied to any specific application area, can be found in the work by Honda and Nakano.19 The focus of their research is on using the third dimension to increase the number of simultaneously displayed relationships in multivariate data. Similar versions have also been used to avoid over-plotting by stacking20 and for analysis of time-varying data.21, 22 Instead of extending parallel coordinates to parallel planes a circular axis arrangement can be used. A 3D multi-relational parallel coordinates technique was proposed by Johansson et al.23 that allows a simultaneous analysis of the relationships between a focus variable and all other included variables. A different approach was taken by Fanea et al.24 where parallel coordinates are unfolded, resulting in a circular view with the aim of reducing visual clutter. Of the many extensions of standard 2D parallel coordinates into 3D, the majority are identical or share their main characteristics with the originally proposed 3D parallel coordinates technique being evaluated in this article.
2.2
Evaluation
As reported in the previous section, a large number of 3D extensions of parallel coordinates exist. These are presented as visualization tools for a large number of application domains and all assert that adding an extra dimension is valuable and adds beneficial features to users. That they are subject to any form of evaluation in order to confirm this, on the other hand, is not as common. In the literature a few evaluation studies can be found, but most of them are not directly related to the work in this article since they concern various aspects of standard 2D parallel coordinates,25–27 not comparing parallel coordinates in 2D and 3D. In fact, as far as the authors are aware, no formal evaluation has been made of the originally proposed 3D parallel coordinates technique under study in this article. The only evaluations found are by Forsell and Johansson28 comparing 3D multi-relational parallel coordinates with standard 2D parallel coordinates for typical tasks in exploratory visualization and by Johansson et al.29 which investigates perceivable thresholds of noise and viewing angle in 2D and 3D multi-relational parallel coordinates. Both evaluations concern the multi-relational parallel coordinates technique introduced by Johansson et al.,23 not the one evaluated in this article which is the foundation for most of the 3D techniques found in the literature and which are still being expanded upon.
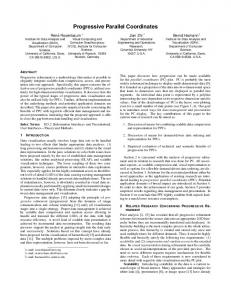
Figure 3: The five patterns used in the experiment. From left to right: a negative linear relationship, a negative linear relationship with a discontinuity, three sinusoidal relationships with one, two and three periods, respectively.
Figure 4: The rightmost 2D pattern illustrated in figure 3 shown in 3D parallel coordinates with the common Z−variable setup.
3
Evaluation of 2D and 3D Parallel Coordinates
The aim of the present study is to evaluate the usability of 3D parallel coordinates and we investigate the ability of humans to perceive 2D relationships (patterns) in 3D parallel coordinates using different axis configurations. More specifically, the experiment compares 3D parallel coordinates with a common Z−variable (figure 1(right)) and 3D parallel coordinates with different Z−variables (figure 1(middle)) and we compare them with their corresponding 2D representations. For the comparison to be as fair as possible, the same number of variables is always used in the 2D and 3D representations. For this first user study of 3D parallel coordinates the smallest possible number of variables was used, which is three for the common Z−variable configuration and four for the different Z−variables configuration. The motivation for this was to construct the visual stimuli to be as simple and straightforward to identify as possible. Adding more planes to the visual representations would potentially increase their complexity and make the identification and interpretation of patterns more difficult.
15$
15$
15$ 15$
Figure 5: Illustration of the rotation restrictions, forcing the participants to interpret the representation in 3D. Sectors in cyan represent the available rotation angles.
3.1
Task
To assess our capacity to perceive patterns represented in different types of parallel coordinates representations (2D and 3D) a judgement situation to be performed as a discrimination task was created. The participants were required in any individual experimental trial, to identify a stimulus pattern. Here, a pattern means a relationship in data created between a single pair of axes in a 2D parallel coordinates visualization (figure 3) or between a pair of planes in a 3D parallel coordinates visualization (figure 4). This pattern to be identified could be any one of the five different 2D reference patterns illustrated in figure 3. Any other pattern appearing in a representation (both 2D and 3D parallel coordinates showed more than one pattern at a time) was considered as a distractor. The starting view of the 3D representation was slightly rotated in order to clearly illustrate the 3D view. In the 3D representation the task could require the participant to interact with the visualization in order to get the ‘best’ view. These modifications were executed by rotating the visualization by moving a mouse horizontally or vertically with the left mouse button pressed. Rotation was constrained such that it was not possible to flip the representation upside down. This was implemented to prevent disorientation of the user and thus avoid complicating the execution of the task in a way that would confound the study. Rotation in the 3D representations was also restricted such that it was not possible to create a 2D view, forcing the participants to view the patterns in 3D. The reason for this was that the study aims at explicitly comparing 2D and 3D. Figure 5 illustrates the rotational restrictions. Pilot studies indicated that a restriction of 15 ◦ was necessary to prevent users from seeing the display as a 2D view. From an experimental point of view these facts could be considered as confounding factors jeopardizing the validity of the results. Also, it could be argued that since a 3D representation requires interaction the comparison between 2D and 3D is not just. However, these facts lie in the nature of the differences between these two type of representations and are therefore representative of their behaviour in real situations.
3.2
Experimental Design
The study was designed as a three factor mixed design with visualization method (2D versus 3D) as a within subject factor. The between subject factors were type of axis configuration (common Z−variable versus different Z−variables) and order of presentation of visualization method. Half of the participants
Figure 6: Depending on the position of two adjacent axes, a pattern can be mirrored. Except for the orientation, the two patterns are identical and convey the same relationships.
started with the 2D visualization and half of them started with the 3D visualization. In each visualization method the five patterns appeared eight times each in a randomized order. This design yielded a total of 80 trials per participant (2x5x8).
3.3
Stimuli
To create the patterns used in this study a synthetic data set was used. This was constructed such that it featured five pair-wise mathematical relationships: a negative linear relationship, a negative linear relationship with a discontinuity, and sinusoidal relationships with one, two and three periods respectively. In figure 3 the patterns are illustrated as they appear in a 2D frontoparallel representation and figure 4 shows an example of a 3D representation. The five patterns were formed by the rendering of 300 lines which is sufficient to clearly discriminate between the different patterns but small enough not to introduce any cluttering artefacts which are known to commonly occur in parallel coordinates. Hence, the present study is not investigating the scalability of 3D parallel coordinates for large data sets. This matter is further discussed in the section on future work. The lines were rendered semi-opaque and additively blended in order to make overlaps more visible. This is a common technique which is extensively used today and was first explored together with parallel coordinates by Wegman and Luo in 1997.30 Depending on how the axes were positioned with respect to each other, a stimulus pattern could be mirrored. These two patterns (the stimulus pattern and its mirror reflection) differ only in orientation and were to be regarded as one and the same pattern, see figure 6. The data set and the mathematical relationships were constructed in an earlier work and for a complete mathematical description and further details see Forsell and Johansson.28 The motivation for using these patterns was twofold. First, this type of evaluation requires clearly defined answers and it is vital to have full control over the patterns. This implies that the data set used needs to include patterns that are well defined and thus can be identified by the participants in an experiment without interference from other factors.31 Second, previous work has shown that there are no differences between the individual patterns, that is that none of them is more easy or more difficult to identify than the others. This has been shown for clean patterns and for patterns distorted by noise 29 and by different perspective viewing angles,29 and also when using a usability criterion of efficiency that restricts the actual viewing time of a pattern.29 Altogether, this means that the object under test in this study is the difference between type of visualization method (2D and 3D) and not any other factors that relate to the nature of the data. It should be noted that the reason for only using 2D patterns as reference patterns is that it is not possible to construct representative
Figure 7: Illustration of the common Z−variable configuration. Top-left: 2D parallel coordinates with three variables. Top-right: 3D parallel coordinates with a common Z−variable showing three variables. Bottom-left: screen shot from the experiment, 2D condition. Bottom-right: screen shot from the experiment, 3D condition.
patterns in a 3D display of parallel coordinates due to the fact that they are the result of the current projection (rotation). Even a slight change in rotation angle could completely change the appearance of a pattern, thus patterns in a 3D display can not be used as reference patterns. In addition, 2D patterns have a clear mathematical description, via the point←→line duality,1 and are the patterns for which users often search when using parallel coordinates. For 3D parallel coordinates with a common Z−variable a pattern was displayed between two planes of which one is constructed between variables V1 and V3 and one between variables V2 and V3 , meaning that both planes share the common variable V3 , as illustrated in figure 7 (top-right). This 3D parallel coordinates setup with three variables is the smallest possible subset, using only a single pair of planes, of the example representation shown in figure 2. In the 2D visualization each stimulus display was also comprised of three variables (V1 , V2 , V3 ), in a parallel arrangement. Between each pair of variables a pattern was depicted (see figure 7 (top-left) for an illustration). The target pattern could appear between any of the axes but its actual location was not relevant. Screen shots from the experiment are shown in figures 7 (bottom-left) and 7 (bottom-right). For 3D parallel coordinates with different Z−variables a pattern was displayed between two planes of which one is constructed between variables V1 and V3 and one between variables V2 and V4 , see figure 8
Figure 8: Illustration of the different Z−variables configuration. Top-left: 2D parallel coordinates with four variables. Top-right: 3D parallel coordinates with different Z−variables showing four variables. Bottom-left: screen shot from the experiment, 2D condition. Bottom-right: screen shot from the experiment, 3D condition.
(top-right). Similar to the common Z−variable condition this 3D parallel coordinates setup with four variables is the smallest possible subset, using only a single pair of planes, of the example representation shown in figure 2. In the 2D visualization each stimulus display included four variables (V1 , V2 , V3 ,V4 ) in a parallel arrangement, see figure 8 (top-left) for an illustration. As with the setup described above, the target pattern could appear between any of the variables but its actual location was not relevant. Screen shots from the experiment are shown in figures 8 (bottom-left) and 8 (bottom-right).
3.4
Participants
24 participants took part in the experiment, 17 male and 7 female. They were all students or staff at Link¨ oping University in Sweden, aged between 22 and 45 with a median age of 27. Some of the participants were familiar with the traditional 2D parallel coordinates representation but none of them were familiar with the kind of 3D representation used in the experiment. These differences should not affect the outcome of the study since the nature of the task is related to perception rather than expertise in visualization. Still, great care was taken (training and balancing of order) to prevent this aspect from having any negative effect as further described in the following sections. The participants had no prior
knowledge of the purpose of the experiment. All of the participants declared that they had normal, or corrected to normal, vision and normal colour vision. They received a small compensation for taking part in the experiment.
3.5
Apparatus and Viewing Setup
The experiment was carried out using a MacBook Pro connected to an external display set with a resolution of 1920 x 1200 pixels. The patterns were displayed through a program that showed each stimulus against a black background. Each participant was seated in front of the screen at a standard viewing distance of approximately 60 cm. The viewing position was unrestricted, though the chair was adjustable and the participants were assisted to adjust their viewing position such that their eyes were centred on the screen. The participants interacted with the program by means of an external keyboard and mouse.
3.6
Procedure
First, demographic background information was obtained from the participants regarding their age, sex, profession and experience in visualization. Participants then reviewed written instruction materials before the actual sessions in front of the computer began. The experiment consisted of two sessions, one for each visualization method. Each session, in turn, was divided into two parts: an introduction and training part for familiarizing the participant with the task and the experimental timed trials part. The participants were shown printed images representing the five patterns included in the task. They were extensively instructed about the specifics of each reference pattern and how distortions in the 3D viewing condition may affect their appearance in order to understand the concept. They also completed a block of practice trials. The instructor assisted the participants when needed during the training trials to resolve any confusion about how to operate the software and carry out the task. The participants’ task in any individual trial was to examine the displayed data and respond to which of the five possible standard reference patterns was the target pattern of each trial. The sequence of the trials was self-paced and the participants controlled the screen by pressing the space bar when they wished a trial to begin. Each experimental session began with a blank image appearing on the screen. Pressing the space bar caused the first stimulus to appear which remained until a response was given. This completed a trial and the blank screen reappeared and the experiment continued. To register a response the participant used the numbers 1–5 on the numerical keyboard. Each number corresponded to one of the five possible standard reference patterns. These were depicted and enumerated on the instructional materials. Accuracy and response times were recorded for each trial. No feedback was provided. Participants were instructed that although being timed they should be as accurate as possible. They were also informed that their answers could not be changed. After each separate part participants answered questions regarding how confident they were in leaving their responses with the 2D representation and the 3D representation respectively. They responded to the questions using a Likert scale that ranged from 1 (not confident at all) to 5 (very confident), the full range is presented in section 3.7. A full experimental session lasted approximately 45 minutes (including introduction and training).
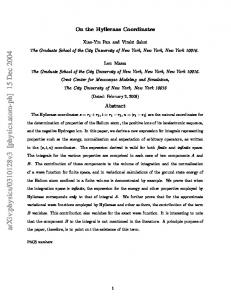
Figure 9: The main findings from the experiment in terms of response times. There was a significant effect between using 2D parallel coordinates and 3D parallel coordinates. On average, the participants took approximately 7 times longer to complete their tasks using 3D parallel coordinates. There was no significant effect between the different axis configurations (common Z−variable or different Z−variables).
3.7
Results
Data from all 24 participants were analysed. Dependent measures were compared with Analysis of Variance (ANOVA). When data did not adhere to the assumptions for this parametric test, non-parametric tests were used. For all statistical analysis, alpha levels of significance were p