the RJ interval, defined as the time between the R wave of the electrocardiogram (ECG) and the J wave of the BCG, under fast pressure changes induced by ...
34th Annual International Conference of the IEEE EMBS San Diego, California USA, 28 August - 1 September, 2012
On Time Interval Measurements Using BCG R. Casanella, Member, IEEE, J. Gomez-Clapers and R. Pallas-Areny, Fellow, IEEE
Abstract— Time intervals measured between the electrocardiogram (ECG), the photoplethysmogram (PPG) or the impedance plethysmogram (IPG), have long been used to noninvasively assess cardiovascular function. Recently, the ballistocardiogram (BCG) has been proposed as an alternative physiological signal to be used in time interval measurements for the same purpose. In this work, we study the behavior of the RJ interval, defined as the time between the R wave of the electrocardiogram (ECG) and the J wave of the BCG, under fast pressure changes induced by paced respiration and tracked by a beat-to-beat blood pressure (SBP and DBP) waveform monitor. The aim of this work is to gain a deeper understanding of these newly proposed time intervals and to further assess their usefulness to determine cardiovascular performance.
I. INTRODUCTION Measuring time intervals between physiological waves has been widely used for many years as a non-invasive alternative to assess many aspects of cardiovascular function [1-6]. Nowadays, two of these intervals are the pulse arrival time (PAT), defined as the time between typically the R wave of the electrocardiogram (ECG) and a fiducial point of an arterial pulse waveform [2], and the pulse transit time (PTT), which has also been used sometimes as an alternative name for PAT [6], but which is usually defined as the time delay between two arterial pulse waveforms simultaneously detected at different points of the body. The main difference between the two intervals is that the first includes the preejection period (PEP) whereas the second depends only on the propagation time along the major blood vessels. The arterial pulse waveform, traditionally obtained by applanation tonometers and Doppler ultrasound devices, is nowadays commonly obtained in an easier manner also from the photoplethysmogram (PPG) [7] or the impedance plethysmogram (IPG) [8]. Impedance methods are being also successfully employed to obtain the whole-body impedance cardiogram (ICG) [9], which is currently a routine method to estimate PEP. Recently, the ballistocardiogram (BCG) has been proposed as an alternative physiological signal to measure time intervals and estimate from them several cardiovascular parameters. The BCG has been traditionally attributed to the body reaction to the forces exerted by cardiac contraction
and blood acceleration in the major blood vessels [10]. Although in its first era of development and use in 1940 to 1960, the BCG was usually obtained using cumbersome floating platforms [10], nowadays it offers an interesting option for non-invasive cardiovascular monitoring at home because it can be obtained from electronic weighting scales [11,12] and other simple methods [13]. The most widely measured time interval based on the BCG is the RJ interval, defined as the time between the R wave of the electrocardiogram (ECG) and the J wave of the ballistocardiogram (Fig. 1). The RJ interval has been found to correlate with both systolic blood pressure (SBP) [14] and PEP variations [15] caused by Valsalva maneuvers. This fact cannot be considered surprising as PEP has been reported to play a prominent role in causing SBP changes [16, 17]. On the other hand, it should be taken into account that Valsalva maneuver, which implies exhaling against a closed glottis, causes a cascade of changes in most of the major cardiovascular parameters [18], and, in the time scale in which the measured changes occur, from 50 s to 100 s, it is difficult to clearly ascertain which parameter or combination of them are actually inducing RJ changes. One further issue is that the origin of the BCG, and specially that of its J wave, despite the modeling efforts performed during the first BCG era [10], is still considered controversial [19], and consequently, there is not, up to day, a fully-accepted explanation able to account for the cause of RJ interval dynamics either.
*Research supported by the Spanish Ministry of Science and Innovation (contract TEC2009-13022) and by the European Regional Development Fund. R. Casanella, J. Gomez-Clapers, and R. Pallas-Areny are with the Instrumentation, Sensors and Interfaces Group, Department of Electronic Engineering, EETAC, BarcelonaTech, Universitat Politècnica de Catalunya (UPC), 08860 Castelldefels, Barcelona (Spain) (phone: +34-93-413-7096; fax: +34-93-413-7007; e-mail: {joan.gomez-clapers, ramon.casanella, ramon.pallas} @upc.edu).
978-1-4577-1787-1/12/$26.00 ©2012 IEEE
5034
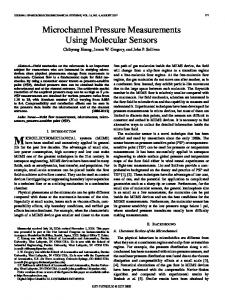
Figure 1. The RJ interval is defined from the ECG (top signal) and the BCG (bottom signal).
II. MATERIALS AND METHODS
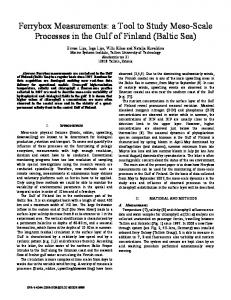
rates. Hemodynamic effects of respiration at higher rates could be masked by the sampling effect of normal heartbeat rate (1-2 Hz). ECG, BCG and blood pressure waveform were recorded during this process for 90 s for each test subject. III. RESULTS AND DISCUSSION Fig. 2 shows the systolic (SBP) and diastolic (DBP) pressure changes caused by paced respiration in subject 1 together with their related RJ interval variations. As it can be seen from the figure, SBP changes are much higher than those in DBP for this subject. On the other hand, it can be observed that RJ minima are somewhat synchronous to SBP maxima, thus suggesting an inverse SBP vs. RJ relationship as the one obtained in previous studies based on the Valsalva maneuver [14].
A. System design and data processing The BCG signal was obtained from four strain gauges of a bathroom scale connected in a Wheatstone bridge. The signal obtained was band-pass filtered (first-order) between 0.5 Hz and 25 Hz and amplified by 15,000. The ECG signal was sensed at the wrists by using dual ground dry electrodes [23] mounted in bracelets. This configuration provided signals with an acceptable level of 50/60 Hz and EMG interference, and dry electrodes are more comfortable and less expensive than wet electrodes. The signal was filtered between 0.5 Hz (first-order) and 40 Hz (first-order) and amplified by 1000. The blood pressure waveform was obtained from a finger arterial pressure monitor (Nexfin® from BMEYE BV) that obtains beat-to beat aortic pressure waveforms using the volume-clamp method. The three systems were connected to a 12 bit data acquisition system (μDAQ Lite®, Eagle Technology) and the signals were sampled at 1 kHz and sent to a PC. All data were processed offline with Matlab®. The QRS complexes on the ECG were detected with a simplified Pan-Tompkins algorithm [24], and the peaks in BCG waves were detected by windowed peak detection, as were the systolic and diastolic levels in the blood pressure waveform. B. Procedure Two test subjects were asked to perform paced respiration by synchronizing its respiration with an on-screen bar graph in order to produce the hemodynamic changes. The most relevant data from both subjects are shown on Table 1. Subject 1 has been practicing sport (cycling) on a regular basis for more than 25 years. TABLE I. Subject
DATA FOR THE TEST SUBJECTS
Age
Height
Subject 1
150
Weight
S1
47 years
173 cm
75 kg
S2
28 years
189 cm
72 kg
In order to record the evolution of the visible parameters in a beat-to-beat scale, the paced respiration was set at 0.1 Hz, which is in the lower range of regular respiration
240
Blood Pressure (mmHg)
130 230
RJ 110
SBP
220
90
RJ (ms)
In order to further elucidate these questions, we propose in this work to study RJ changes under paced respiration. Paced respiration is an alternative hemodynamic maneuver, which causes blood pressure changes related to the respiratory sinus dysrythmia [20 - 22], and has the advantage of being much easier to perform than Valsalva maneuver. Furthermore, pressure changes caused by paced respiration are much faster than those in Valsalva’s, thus allowing to better distinguish which cardiovascular parameters evolve simultaneously to the RJ interval and which ones start evolving at different times, hence being mediated by different factors.
210 70
DBP 50 0
20
40
60
80
200
Time (s) Figure 2. Changes in systolic blood pressure (top solid line), diastolic blood pressure (bottom solid line) and RJ interval (dotted line) during paced respiration in subject 1.
Fig. 3 shows the pressure pattern obtained for paced respiration for subject 2. In this case, in addition to SBP changes, there are large DBP changes that follow the respiration rate but that occur at a different moment of the respiration cycle with respect to SBP changes. For this subject, it can be observed that variations in the RJ interval tends more to display a trend inverse to that of DBP maxima and that the changes are not longer synchronous with SBP, hence showing a very different behavior from that observed in Valsalva maneuvers [14]. This divergence between cardiovascular parameters, which involves only some heartbeats, can be noticed because paced respiration causes fast enough pressure changes to clearly distinguish the different time occurrence of each parameter. This cannot be observed during a Valsalva maneuver because these short time differences are masked by the wider pressure changes at the longer time scales measured. Actually, changes in time intervals caused by respiration are often considered as “highfrequency noise” in most works that deal with these longer scale changes, induced by maneuvers or by drug administration [14-16].
5035
Subject 2
Blood Pressure (mmHg)
120
230
220
RJ
100
210
DBP 200
80
RJ
220
Time Intervals (ms)
SBP
140
Subject 1
240
240
RJ (ms)
160
200 180 160 140
RI
120 100 IJ
60 0
20
40
60
80
80 0
190
Time (s) Figure 3. Systolic blood pressure (top solid line), diastolic blood pressure (bottom solid line) and RJ interval (dotted line) changes measured during paced respiration in subject 2.
These results show that RJ interval seems to comprise two independent dynamics, one that depends on RI interval, which occurs in subject 1 more synchronously with SBP changes, and a second one, which is more evident in the subject with strong DBP variations, and that mainly affects the IJ part of the RJ values. The I wave is the first major peak in the BCG and it is commonly attributed [10] mainly to the acceleration of blood in the ascending aorta. On the other hand, J peak was traditionally attributed mostly to acceleration of blood in the
40
60
Time (s)
80
100
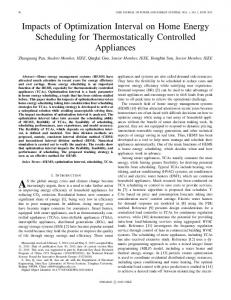
Figure 4. Changes in the RJ interval (solid line), RI interval (dotted line) and IJ interval (bottom dashed line) during paced respiration in subject 1.
Subject 2
240 220
RJ
200
Time Intervals (ms)
In order to further elucidate the reasons from the different behavior observed between these two subjects, we have decomposed the measured RJ intervals into two main components. On the one hand, the interval between the R wave of the ECG and the I wave of the BCG (see Fig. 1), which we name RI interval, and on the other hand, the time interval between the I wave and the J wave, called the IJ interval. Fig. 4 shows the changes of these three intervals for subject 1 and Fig. 5 for subject 2. For subject 1, the changes in the RJ interval are mainly caused by RI interval changes, whereas the IJ changes, which are smaller and not synchronous to RI changes play a minor role in the final RJ output. For subject 2 the opposite happens: RJ changes are mainly caused by IJ changes, which are much greater than those for subject 1 and greater than the RI changes. Table II shows the correlation coefficient r between the RJ interval and both SBP and DBP values and RI and IJ intervals for the two subjects (obtained with p-values, for the significance of the fitting,