WIND ENERGY Wind Energ. 2009; 12:574–593 Published online 20 January 2009 in Wiley Interscience (www.interscience.wiley.com) DOI: 10.1002/we.319
Research Article
Online Wind Turbine Fault Detection through Automated SCADA Data Analysis A. Zaher*, S.D.J. McArthur and D.G. Infield, Institute for Energy and Environment, Department of Electronic & Electrical Engineering, University of Strathclyde, Glasgow, UK Y. Patel, Scottish Power Ltd, UK
Key words: wind turbine; Online Fault Detection; SCADA Analysis; Multi-Agent System; Anomaly Detection; Normal Behaviour Modelling
This paper describes a set of anomaly-detection techniques and their applicability to wind turbine fault identification. It explains how the anomaly-detection techniques have been adapted to analyse supervisory control and data acquisition data acquired from a wind farm, automating and simplifying the operators’ analysis task by interpreting the volume of data available. The techniques are brought together into one system to collate their output and provide a single decision support environment for an operator. The framework used is a novel multi-agent system architecture that offers the opportunity to corroborate the output of the various interpretation techniques in order to improve the accuracy of fault detection. The results presented demonstrate that the interpretation techniques can provide performance assessment and early fault identification, thereby giving the operators sufficient time to make more informed decisions regarding the maintenance of their machines. Copyright © 2009 John Wiley & Sons, Ltd. Received 7 October 2008; Revised 12 December 2008; Accepted 12 December 2008
Introduction Wind energy is currently the fastest growing source of renewable energy used for electrical generation around the world. Wind farms are adding a significant amount of electrical generating capacity, with farms consisting of hundreds of units being built around the country. Over 10 GW of wind capacity is currently in planning in the UK alone. Once these projects are completed, the overall installed UK capacity will comprise of a total of 24 GW.1 This increase in the number of wind farms has led to the need for more effective operations and maintenance procedures. Improving the maintenance policies used helps to ensure that the operation of the wind farms is optimized by maximizing the availability of the individual turbines. Condition monitoring (CM) systems can be used to aid plant owners in achieving these goals. They aim to provide operators with information regarding the health of their machines, which, in turn, can help them improve operational efficiency by allowing more informed decisions regarding maintenance. This is a step towards condition-based maintenance, and a move away from typical scheduled maintenance policies that are in place in most industries today.2 In this way, any degradation or incipient faults can be detected and dealt with before they result in more serious and costly failures. In addition, healthy turbines can be left to operate, thereby reducing outages that result because of unnecessary scheduled maintenance operations. While the benefits of CM provide a strong case for their use in power plants, operators are weary of blindly adopting the technology without a reasonable economic justification. Most modern turbines are manufactured * Correspondence to: A. Zaher, Electronic & Electrical Engineering Department, University of Strathclyde, 204 George St, Royal College Building, Glasgow G1 1XW, UK. E-mail:
[email protected]
Copyright © 2009 John Wiley & Sons, Ltd.
Online Wind Turbine Fault Detection through Automated SCADA Data Analysis
575
with some form of integrated system that can monitor the main components. These systems typically monitor parameters such as temperatures of bearings, lubricating oil and windings. Some of the more recent systems monitor vibration levels of the drive-train.3 This monitored data is collated and stored via a supervisory control and data acquisition (SCADA) system that archives the information in a convenient manner, usually for all of the turbines in the wind farm. This data quickly accumulates to create large and unmanageable volumes that can hinder attempts to deduce the health of a turbine’s components. It would prove beneficial, from the perspective of utility companies, if the data could be analysed and interpreted automatically to support the operators in identifying defects. This paper describes a set of techniques that can be used to identify incipient faults in the main components of a turbine through the analysis of this SCADA data. The SCADA data sets are already generated by the integrated monitoring system, and therefore, no new installation of specific sensors or diagnostic equipment is required. The techniques developed revolve around the principle of anomaly detection in order to detect instances of abnormal behaviour indicative of incipient component failure. In this way, only interesting information is highlighted to the operator, therefore significantly reducing the volume of data they are faced with. It is believed that anomaly detection can provide early fault detection while minimizing the dependence on knowledge of the exact correlation between fault modes and the SCADA data generated. The final section of the paper describes a framework that can be used to gather and present the output of these detection modules in a comprehensible manner to wind farm operators.
Review of CM Systems for Wind Farms CM for wind farms has been widely researched over the past decade. The review in Hameed et al.4 provides a particularly insightful and detailed summary of the state of the art in wind turbine CM systems while also providing a comprehensive explanation of the new emerging techniques currently being researched. Some of the more recent methods described in the research literature include a blade monitoring system,5 a system called SIMAP6 based on artificial intelligence techniques aimed to detect and diagnose gearbox failures, and power performance analysis techniques varying from tailored statistical methods7,8 to power output estimation using neural networks.9,10 It can be identified from the literature that most of the techniques and research focus is on a specific problem or component of the turbine in isolation. This is mainly due to the complex nature of each individual problem. One key feature of the research described in this paper is to address this gap and provide a platform for wind farm CM systems. This will bring together a number of independent analysis techniques, process data from multiple sources and focus on a wider range of components or problems. In this way, a more complete view of the current status of the turbines in the wind farm can be achieved. This methodology is detailed in a later section. The research described also provides an improvement in diagnostic performance that will be discussed in the later stages of the paper.
SCADA Data Interpretation In order to analyse SCADA data successfully, it is necessary for the operator or analyst to have knowledge and understanding of the connection between actual defects and what they manifest in the data. In the case where this information is non-existent or unavailable, then detailed data-mining activities (the process of analysing data from different perspectives and summarizing it into useful information)11 can be used in an attempt to derive useful relationships. Successful interpretation of the data is predicated upon either of the following prerequisites:12 • Access to detailed knowledge of how defects manifest themselves in the monitored data; or • The availability of extensive historical data along with records of the actual defects in order to allow datamining activities to be used to extract defect knowledge for future fault identification. Copyright © 2009 John Wiley & Sons, Ltd.
Wind Energ 2009; 12:574–593 DOI: 10.1002/we
576
A. Zaher et al.
Fault record information (class 1 above) is viewed by wind farm operators as commercially sensitive, and gaining access to this kind of data was not possible. Access to historical data, however, is not so problematic, and permission was obtained to access almost 2 years worth of SCADA from a wind farm sited in Scotland comprising 26 Bonus 600 kW stall-regulated turbines commissioned in November 1995. The lack of access to defect records and expertise in how faults manifest themselves in the data is essentially the main challenge that has to be overcome. This highlights the main reason for the use of anomaly detection, since it places minimal dependence on the requirement of having access to this experience and knowledge whilst still achieving the objective of identifying faults as early as possible. Anomaly detection uses a model of the ‘normal’ behaviour of sensor data recorded from an item of plant or machinery. This model captures how the data evolves and changes with respect to factors that may influence it under normal circumstances. This model of ‘normality’ allows for the detection of anomalous behaviour, even when this type of behaviour has not been seen previously. The model is used to provide an estimate of the sensor output based on the inputs that can affect the values recorded by the sensor. This estimation can then be compared to the real value recorded by the sensor, where a significant deviation from the estimated value would be viewed as an abnormality. In this way, incipient faults can be highlighted and presented to the operator, dramatically reducing the complexity of their task, since only significant information of relevance to the health of the turbine is presented to them. It can be argued that anomaly detection cannot be used to classify faults since no knowledge of the different types of faults is included. Its use here, however, is to provide the initial stage of the fault identification process. Once the anomalies are detected, the opportunity of ‘labelling’ them according to specific fault classes can be achieved through the help of an experienced operator. The operator’s knowledge could be captured as rules and then used to classify various instances of failure. This, however, is out with the scope of this paper, and left for future research.
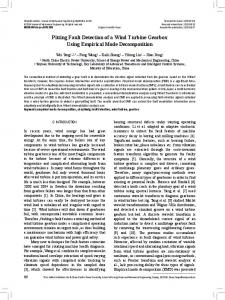
Normal Behaviour Modelling The success of the anomaly-detection approach is determined by the accuracy of the developed models. An inaccurate model might produce erroneous estimates, causing the system to flag up false alarms. Models of normal behaviour can be developed using a variety of learning approaches or techniques, depending on the nature of the data and the objective of the work. Examples of both statistical and artificial intelligence (AI) techniques being used to establish models of normal operation are provided.12–15 AI techniques can be used to model complex nonlinear behaviour or evaluate relations between measured signals and current operating conditions of the machinery. They have been utilized in a range of CM applications, ranging from transformers to aircraft.14,16–19 The normal behaviour models presented in this report are captured through the use of multilayer neural networks (NN). Tarassenko et al. and Devendra et al. demonstrate their application for anomaly detection in aircraft engines.14,15 NNs have the ability to model complex relationships by finding associations or patterns between inputs and outputs. They are particularly effective at capturing complex non-linear relationships that may exist between parameters, without having to derive the mathematical relationship. What they do require, however, is plentiful examples of the kind of behaviour of interest. This underlines their suitability for the normal behaviour modelling. With wind turbine SCADA data this can be achieved in two ways: • The complex nonlinear relationship between the data parameters can be captured, and an estimation of the output based on those inputs can be provided; and • Secondly, the wind farm data acquired provides numerous examples of the kind of behaviour that the system needs to model. Multilayer neural networks have three distinctive characteristics.20 The network consists of a set of nodes that constitute the input layer, one or more hidden layers of neurons and the output layer, as shown in Figure 1. Secondly, each neuron has a variable nonlinear transfer function that determines the internal activity of the neuron, and an activation function that determines whether or not it fires to produce an output, i.e. a threshold Copyright © 2009 John Wiley & Sons, Ltd.
Wind Energ 2009; 12:574–593 DOI: 10.1002/we
Online Wind Turbine Fault Detection through Automated SCADA Data Analysis
577
Figure 1. Neural network layers and neuron internals
check. Each of the inputs X1 to Xn is fed to each neuron and multiplied by the associated weight (W1 to Wn). This shows the third characteristic, which is the degree of connectivity the network exhibits, determined by the value of the weights. Experiential knowledge is gained through a supervised training process and is stored in these weights, determining the connectivity of the networks’ neurons. The supervised training process is achieved through splitting the data into training and testing data sets. The term supervised refers to the process of the training data consisting of inputs and known desired outputs, which the network attempts to relate through a nonlinear function by exposure to a sufficient number of examples. The weights in each neuron are initially set at random values. The input values are then propagated through the network, yielding an output with an error between the initial value and the desired output. This error is then fed back through the network and used to adjust the weights accordingly with the aim of minimizing the magnitude of the error term. This process of adjusting the weights is determined by the algorithm used to train the network. The back propagation algorithm was used for the networks trained in this research because of its suitability for pattern matching and prediction purposes.20 This process is then iterated until the weights no longer change or the set number of training cycles is complete. The network can then be tested on the second data set, which deliberately comprises data that the network has not been trained on or previously exposed to. Its success at estimating values that are as close as possible to the desired output values determines how well the network has learned or captured the relation between the inputs and outputs. NNs have been used in this research in order to develop normal behaviour models of key SCADA parameters that indicate the condition of the gearbox and the generator, and can estimate the power output of the turbine according to the specific wind profile it experiences. The power estimation model, however, is not detailed in this paper because of a lack of sufficient data to develop an accurate model, and as yet still requires further work.
Modelling Normal Behaviour of SCADA Parameters There are a number of parameters that are included in the SCADA data. Some integrated CM systems are more sophisticated than others, and this reflects the range of parameters that are available. The parameters existing in the data sets acquired are listed as follows: Copyright © 2009 John Wiley & Sons, Ltd.
Wind Energ 2009; 12:574–593 DOI: 10.1002/we
578
• • • • • • • • •
A. Zaher et al.
Active power output (10 min average and standard deviation (SD) over 10 min interval) Anemometer-measured wind speed (10 min average and SD over 10 min interval) Nacelle temperature (1 h average) Gearbox bearing temperature (10 min average) Gearbox lubricant oil temperature (10 min average) Generator winding (10 min average) Power factor (10 min average) Reactive power (10 min average) Phase currents (10 min averages)
The techniques presented utilize only the data mentioned above. The parameters listed above are typical of data collected by commercial wind turbine SCADA systems. This means the approach developed here can be widely applied by wind farm operators.
Gearbox Normal Behaviour Modelling The two gearbox parameters in the SCADA data, namely the gearbox main bearing and the lubrication oil temperature, give an indication of how hot the components are running, and therefore offer the possibility of detecting gearbox overheating. While a straightforward threshold check could be used to flag up temperatures exceeding a certain limit, this might well be too late to avoid significant damage to the gearbox. The desired functionality should take into consideration any relevant aspects of turbine operation. This approach would allow temperatures to be detected that are too high in the context of the concurrent level of power generation, leading to a quicker and more effective identification of anomalous behaviour.
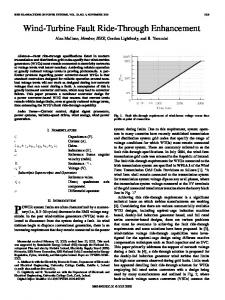
Parameter Selection for Model Capture In order to capture the normal behaviour of the two gearbox temperature parameters, the variables that can affect those temperatures must be taken into consideration so that an accurate model can be built. Wind turbines can only aerodynamically capture a proportion of the energy in the incident wind.21 This energy is converted by the rotor blades into mechanical power and is transmitted to the gearbox by the low-speed shaft. The gearbox then steps up the rotation rate to around 1500 rpm on the high-speed shaft that drives the electrical generator to produce electrical power. This means that the mechanical load and stress that the gearbox undergoes, and therefore its temperature, is closely related to the amount of power generated by the turbine. The temperature of the gearbox will also be affected by the ambient temperature inside the nacelle of the turbine, and so this also should be taken into consideration. The models built by Sanz-Bobi et al. in the SIMAP system6 also utilize as inputs the operation of a fan used to cool the gearbox oil. This provides information regarding whether the fan has been switched on to cool the oil or not. Their system uses three normal behaviour models in order to identify gearbox bearing anomalies in both the cooling mechanism and the gearbox bearing itself. These model the gearbox bearing, bearing cooling oil and the thermal difference between the oil temperatures entering and leaving the cooler. Their models use a number of input parameters that seem typical of an integrated CM system archived via a SCADA system, although this is not stated. Figure 2 details the inputs used in the model developed by Sanz-Bobi et al. and the model developed using the data acquired from the Scottish wind farm presented here. There are two noticeable differences between the two models. The first and foremost dissimilarity is that the models built for the purpose of this research do not model the thermal difference of the cooling oil as it flows in and out of the gearbox. The main reason for this is that information regarding the status of the cooling fans was not available in the SCADA data acquired from the Bonus wind turbines used in this study. The purpose of this inclusion, according to Sanz-Bobi et al., is to allow the model to identify problems that arise with the gearbox bearing. The second distinction is that the model developed in this work does not contain the information regarding the operation of cooling fans, since again this data was not available. However, results Copyright © 2009 John Wiley & Sons, Ltd.
Wind Energ 2009; 12:574–593 DOI: 10.1002/we
Online Wind Turbine Fault Detection through Automated SCADA Data Analysis
579
Figure 2. Model comparison
from experimentation and testing have proved that an accurate estimation of the gearbox and bearing temperature can be achieved without this additional information. The other distinction between the models is how their output is used. The model built by Sanz-Bobi et al. uses the output of the cooling oil model as a means to recognize faults with the cooling mechanism and not the gearbox itself or its bearings. The results from the models built here show that the output of this model could be used to identify overheating in the gearbox at a very early stage, and so provide insight into the current status of the mechanical health of the gearbox itself. Training the Model The models are trained using the parameters discussed in the previous section. When training the models, in order to yield an accurate representation for the parameter under study, the range of each of the inputs fed through for the training process should be as varied as possible while still ensuring they are within the bounds of normal operation. This was achieved through trending the complete data set and looking for patterns in the data. It was found that the majority of the turbines exhibit similar trends in their evolution of gearbox temperature. Data showing these similar trends were selected and their values were averaged to provide 3 months worth of training data for each of the inputs. This amounts to roughly 13,000 data points for each input. The range of values for each input parameter used to train the cooling oil model is depicted in Figure 3(a). What this shows is the typical spread of values under normal healthy turbine operation sorted in ascending order. The training process then attempts to capture the nonlinear relationship between these parameters, i.e. the associated gearbox oil and nacelle temperatures for the corresponding power output. The number of training cycles used, also known as epochs, was 1000. Determining the architecture for the network is an iterative process and depends solely on the structure that yields the best accuracy when tested. The final architecture used for both the gearbox models was 5-3-1, as shown in Figure 1. Copyright © 2009 John Wiley & Sons, Ltd.
Wind Energ 2009; 12:574–593 DOI: 10.1002/we
580
A. Zaher et al.
The trained model was tested on new data from a healthy turbine that had not been used in training. Figure 3(b) shows the input signals used from turbine 1 during the month of February 2006. Figure 3(c) shows that the model provides an accurate estimate of the expected temperature of the gearbox cooling oil. The difference signal shows the error between the estimated and actual values. The averaged error between the two trends is −0.049ºC, and the Root Mean Square (RMS) error was 1.18, which was deemed an
Figure 3. (a) Neural network cooling oil model training data;
Copyright © 2009 John Wiley & Sons, Ltd.
Wind Energ 2009; 12:574–593 DOI: 10.1002/we
Online Wind Turbine Fault Detection through Automated SCADA Data Analysis
581
Figure 3. (b) Cooling oil model testing input data (turbine 1, February 2006);
acceptable level of error for the diagnostics required by the industrial partner for successful fault detection. This means that the output of the model can be used directly as a comparison with the actual temperature trend to assess whether an anomaly is present. A straightforward difference of the two signals can be used. If the difference between the estimated value produced by the model and the actual value increases for a continuous number of instances, i.e. a prolonged period of time and not a minor fluctuation, then this would flag as an anomaly. This is to exclude false identification of anomalies as a result of erroneous but transient data. Copyright © 2009 John Wiley & Sons, Ltd.
Wind Energ 2009; 12:574–593 DOI: 10.1002/we
582
A. Zaher et al.
Figure 3. (c) Cooling oil model output (estimating turbine 1, February 2006 gearbox oil (t) parameter)
Validating Parameter Selection In order to ensure that the use of each input parameter is valid and is not used unnecessarily, a process of cross correlation is undertaken. The significance of each input is determined by assessing the model accuracy as each input is omitted one by one. The model accuracy can be quantified by the ability of the model to provide an estimation that is as close to the real value as possible. In this way, the significance of each input can be understood by assessing the impact on the models’ accuracy when omitting each parameter. The same set of data was used for training and testing the models in order to ensure fair results. The results of this crosscorrelation process are listed in Figure 4. The numbers show that each model performs best with all four inputs being used where the lowest mean and RMS errors are produced across all three component models. Both the gearbox oil and the gearbox bearing models follow a similar trend, with the RMS errors increasing in size with the ambient nacelle temperature input omitted first, followed by the regressive inputs and finally, the power omitted last. This shows that the importance of the input variables for both of the models starts with power being the most important, followed by the regressive inputs and lastly, the ambient nacelle temperature making the least impact on model accuracy. The generator model on the other hand does not follow the exact same trend on the period of data tested. The results show that the regressive inputs are the most important followed by ambient temperature and the power input comes in, giving the least impact on model performance. The outcome from this process allows us to conclude that each of the input parameters used is of significant importance, each improving the model accuracy by adding information that aids the models to produce realistic estimates, therefore, justifying their use as an input. Copyright © 2009 John Wiley & Sons, Ltd.
Wind Energ 2009; 12:574–593 DOI: 10.1002/we
Online Wind Turbine Fault Detection through Automated SCADA Data Analysis
583
Figure 4. Cross validation results
Detection of Gearbox Faults Once the normal behaviour models were trained, the complete 2 years worth of data acquired was processed in order to see how well the model estimates agreed with the remainder of the data set to which they had not previously been exposed. Figure 5(a) shows the evolution of the gearbox cooling oil temperature trend for turbine 16 from the period of August 2005 to January 2006 where it eventually fails. Figure 5(b) shows the corresponding error signal that depicts the difference between both the estimated output trend from the model as well as the actual temperature. The first significant deviation from the model estimates occurred towards the end of August 2005. From that point onwards, the frequency of deviations and their duration increased. In this specific example, it can be seen that the cooling oil model built here detected incipient problems in the form of overheating almost 6 months in advance of the actual failure. For comparison, the model built by Sanz-Bobi et al. was capable of detecting an incipient problem only 2 days before the actual failure. Figure 6(a),(b) shows the gearbox bearing model temperature output for the same time period and the error signal, respectively. Throughout this period, the deviations from the model estimations were minimal and not significant enough to be classed as gearbox bearing anomalies when compared to other anomalous temperatures detected by the model. An interesting point to note from the results was that the minimal Copyright © 2009 John Wiley & Sons, Ltd.
Wind Energ 2009; 12:574–593 DOI: 10.1002/we
584
A. Zaher et al. a
b
Figure 5. (a) Gearbox failure: gearbox cooling oil model output, anomalies detected from August 2005–January 2006 and (b) Gearbox failure: gearbox cooking oil anomalies detected from August 2005–January 2006
Copyright © 2009 John Wiley & Sons, Ltd.
Wind Energ 2009; 12:574–593 DOI: 10.1002/we
Online Wind Turbine Fault Detection through Automated SCADA Data Analysis
585
a
b
Figure 6. (a) Gearbox failure: corresponding gearbox bearing model output detected during August 2005–January 2006 and (b) Gearbox failure: corresponding gearbox bearing model error signal detected during August 2005–January 2006 showing no significant or prolonged periods of deviation Copyright © 2009 John Wiley & Sons, Ltd.
Wind Energ 2009; 12:574–593 DOI: 10.1002/we
586
A. Zaher et al.
deviations occurred at the same time the cooling oil deviations were spotted, which depicts the expected heat transfer between the gearbox components. According to these results, overheating was detected in the gearbox cooling oil while the gearbox bearing temperature conformed to the normal behaviour model. Corroborating the output from both models suggests that the failure was in fact a problem internal to the gearbox and not the gearbox bearing or cooling mechanism. This failure has been confirmed with the industrial contacts who supplied the data. Figure 7(a),(b) shows another example of gearbox problems detected by abnormally high temperatures in turbine 17’s gearbox oil parameter. In this example, the turbine experienced problems towards the end of April 2005, where it was taken offline as depicted by the trends. Data from before April 2005 was not available, however, to identify when the first model deviations occurred. Nevertheless, deviations were detected at the start of the month. These results highlight the importance of model accuracy, which, in turn, is achieved through good model selection and the effective training used to capture the normal behaviour of each parameter.
a
b
Figure 7. (a) Gearbox problems detected in turbine 17, April 2005 and (b) Gearbox problems detected in turbine 17, April 2005
Copyright © 2009 John Wiley & Sons, Ltd.
Wind Energ 2009; 12:574–593 DOI: 10.1002/we
Online Wind Turbine Fault Detection through Automated SCADA Data Analysis
587
Generator Normal Behaviour Modelling The method used for temperature anomaly detection for the gearbox was also adopted for the generator winding parameter available in the SCADA data. The approach used to train and test the model was identical to that of the gearbox. The parameters in the SCADA that can influence the generator winding temperature are again the power output, as this determines how hard the generator is working, and the ambient temperature inside the nacelle. The regression inputs were also used to give the neural network an understanding of how the generator winding temperature evolves over time. The results showed that the trained model also corresponded well to the real evolution of the generator winding temperature. A malfunctioning generator was detected using the trained generator model within the 2 year data set. The last month of its operation before failure or it being brought offline is shown in Figure 8(a),(b). The first noticeable deviations were detected in August 2005 and continued to increase in size and frequency until its failure in November 2006. A generator typically has a safety mechanism which cuts off power generation for a period of time whenever the windings overheat. (Author correspondence with Yusuf Patel, Scottish Power Ltd.) This safety feature attempts to prolong the lifetime of the generator by preventing continued operation of the generator at a dangerously high
a
b
Figure 8. (a) Turbine 8 generator failure or brought offline (November 2006) detected in generator winding temperature parameter and (b) Turbine 8 generator failure: generator winding model error signal
Copyright © 2009 John Wiley & Sons, Ltd.
Wind Energ 2009; 12:574–593 DOI: 10.1002/we
588
A. Zaher et al.
temperature. The repetitive spikes seen in Figure 8(a) are the effects on the temperature seen when the safety mechanism activates, interrupting normal power generation.
Results Conclusion The results produced by the models developed for this research are very positive. They provide an early warning of problems developing in the gearbox and generator that become apparent through abnormal temperatures. The anomalies detected by the models reduce the volume of data that must be analysed considerably, making the task of the operator much more practical. The models’ also supply this information in good time, allowing for a more informed decision regarding the appropriate action to be made. It can be seen that all of the factors involved in developing and training the models can have a significant impact on the accuracy of the relationship captured. Factors such as the training algorithm, the architecture of the network, as well as the data selected for training the model, all affect the output. The research carried out in Sanz-Bobi et al.6 was the most advanced research to date found in the literature in this area of study. However, the results of the models developed and described above provide earlier fault identification on the data set they were applied to, while the framework detailed in the next section also takes the research a step further. It allows techniques to be combined so that the analysis of many parameters and components of the turbine can be assessed simultaneously for corroboration purposes.
Integrating the Techniques In order to integrate all of the analysis techniques described into one convenient point of contact for an operator, a framework that is capable of integrating multiple data sources and multiple independent processes is needed. Multi-agent systems (MAS) provide a flexible and extensible structure for designing such systems, allowing different tasks to be encapsulated into separate modules (agents) with independent objectives.22 They have successfully been used for CM systems applied to transformers.16 The flexibility and extensibility of the framework allows new agents to be introduced into the system in real time, i.e. without having to start and stop all of the other agents (processes) that are running. It also provides a ‘yellow pages’-like facility known as the directory facilitator (DF), which allows each agent to register with it the services it provides along with the information or services it is interested in. In this way each of the other agents can learn about the newly introduced agent’s existence and the services it can provide that may be of use to them. This proves extremely useful in the development of a fault detection system, especially if new diagnosis techniques that aim to corroborate information with current techniques are later discovered.
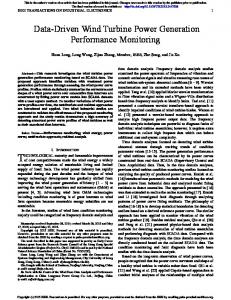
Proposed System Architecture The proposed system architecture is shown in Figure 9. It is composed of seven different kinds of agents consisting of four independent detection modules, an interface agent with which the user can interact and receive information, data parser agents to handle and prepare the data for processing, and, finally the data management agent that collects and formats the required parsed data reducing the overall volume of data into feature vectors, which can then be sent ready for processing by the appropriate detection module. By simply adding in a new data parser agent, this gives the system the capability of reading data files of different formats from different wind farms, while the detection agents can be easily retrained and updated to detect faults for different turbine models. The data management agent can also easily be given a new behaviour that can accommodate the new data type and incorporate this in its feature vector creation and sending process. This gives the system the flexibility to be applied to any wind farm of any size. The purpose of the interface agent is to allow the user to interact and view the information presented by the system. It will also provide the user with the option of selecting and viewing the turbines and alarms they are Copyright © 2009 John Wiley & Sons, Ltd.
Wind Energ 2009; 12:574–593 DOI: 10.1002/we
Online Wind Turbine Fault Detection through Automated SCADA Data Analysis
589
Figure 9. System architecture
interested in. This will give the user the control of further reducing the volume of data presented to them by selecting only what is important to them.
Developing a Multi-agent System Agents can exhibit social ability, reactivity and proactiveness.23 This permits for the development of more intelligent automated diagnostic functions since each of those features can be built into an agent’s functionality. In this research, JADE 3.524 is employed as the MAS platform. This requires each agent to be built around what is known as a behavioural architecture. Each agent’s responsibilities are split into behaviours that are executed and coordinated in such a way that enable it to complete its task. When developing an agent, the programmer is given the flexibility to produce the desired functionality using a number of different behaviour types. Some examples are generic behaviours that can be called at any point in time, reactive behaviours that can react to a specific situation and timer-based behaviours that execute in a timely fashion at set time intervals to name a few.23 For example, the functionality of the data parser agents can be split as follows. The data Copyright © 2009 John Wiley & Sons, Ltd.
Wind Energ 2009; 12:574–593 DOI: 10.1002/we
590
A. Zaher et al.
parser has the responsibility of reading the data files, parsing them for the appropriate data and then sending this data in an understandable format to the processing agents. This functionality is split into the following three behaviours: • Parse data behaviour; • Parse waker behaviour; and • Subscription responder behaviour The parse data behaviour is responsible for accessing the data file, finding the required data and storing it temporarily in a format that can be sent to the appropriate processing agent. The parse waker behaviour is a timed behaviour that controls the time interval between readings of the data file to parse the next available measured value. The data parser agents provide data to the processing agents and so they register with the DF that they can provide a specific type of data. In order to do so, they must exhibit a subscription manager interface that allows them to handle any number of agents that are interested in receiving this data that they can provide. The subscription responder behaviour allows it to do this by handling any subscriptions sent to it. It then takes care of all the subscribed agents (the processing agents that require this data to carry out their processing) by sending out the data to them as soon as it becomes available. Agent Communication Agent Communication is handled by the Foundation for Intelligent Physical Agents (FIPA) Agent Communication language (ACL). This language underpins the communication between agents, allowing them to coordinate their behaviour and achieve the subscription functionality described in the previous section. There are two main levels of protocol that an agent designer has to take into consideration when developing communication between agents. The first is the ACL message itself, and the second is the content language used for the syntax of the message content. At the ACL message protocol level, the only parameter actually required is the performative. This parameter indicates the type of communication such as inform, query ref, request and subscribe to name a few examples.25 Some of the other parameters of an ACL message include participant information (sending and receiving agents), conversation control headers (conversation identifier), content parameter (where the real meaning of the message is stored) and content descriptors, which can all be set to make the message more meaningful. Figure 10 shows an example of the communication process taking place between a data parser agent, one processing agent, the interface and the DF from system start up to an anomaly being identified and passed on to the user. The first three request–inform dialogues taking place between each of the agents and the DF correspond to the process of each agent registering itself with the DF to provide information of the services it can provide. The data parser registers that it can provide a specific type of data, the gearbox oil agent registers that it can provide alarms for excessive oil temperatures and the interface agent registers that it provides information to the user. The subscribe–inform dialogues in 4 and 5 correspond to the associated agents subscribing to the services that they require, namely the gearbox agent-requiring data and the interface agent-requiring alarms. Messages 6–n represent the data that is being sent to the gearbox agent. This data is processed by the normal behaviour model to see if it corresponds to the model output. Finally message n + 1 signifies information being sent by the gearbox agent to the interface in relation to the data that is anomalous and doesn’t correspond to the model. The second level of protocol, the content language, defines the format of a message’s content. In order for agents to understand what is being sent to them, it is necessary that they use a common vocabulary that both the sender and receiver can understand. This language is known as an ontology. An ontology defines the concepts and ideas that the agents communicate between them. To design an ontology suited to any particular domain, thorough knowledge of the sort of messages and information that will be exchanged between the agents is necessary. Good design of this language ensures that the agents within a system have a common ground regarding the information they can send request or query. Copyright © 2009 John Wiley & Sons, Ltd.
Wind Energ 2009; 12:574–593 DOI: 10.1002/we
Online Wind Turbine Fault Detection through Automated SCADA Data Analysis
591
Figure 10. Agent interaction example
Corroborating the Output of the Agents With the current system architecture, there are two immediate opportunities for bringing together the output of the techniques encapsulated in the agents in order for wind farm operators to yield a more accurate understanding of the current status of a turbine. Firstly, the output of the two gearbox agents can be used in conjunction with one another to inform operators of problems internal to the gearbox and with the bearing. As in the example shown previously, problems were identified in the gearbox oil, but were also reflected in the bearing model. The bearing model anomalies were, however, minor and occurred at the same point in time as the anomalies recorded by the oil model. This allows a more informed decision to be made regarding what is likely to be causing the problem in the gearbox. The second opportunity for corroboration arises from the generator problems that are reflected in the power estimation model. While the power estimation model has not been described in this paper, a model has been developed, which provides an estimate of the expected power output of a turbine, considering the specific wind profile it experiences. This is then used to calculate an overall efficiency figure rating the turbine’s performance in comparison to the estimated output over a specific month as a percentage. The reason generator problems can be reflected in this efficiency figure is that when the Copyright © 2009 John Wiley & Sons, Ltd.
Wind Energ 2009; 12:574–593 DOI: 10.1002/we
592
A. Zaher et al.
generator overheats, it cuts out resulting in zero power output for a short period of time. When this happens repeatedly, as in the example shown earlier, this has a bearing on the efficiency of the turbine for that month since it will not have performed as well as expected. When this happens, we know that the generator’s condition is deteriorating to the point of affecting turbine output. This leads to greater downtime and, therefore, will have an effect on revenues. Initial overheating was detected by the generator winding model 8 months before the safety mechanism began to cut in and affect power performance. The anomalies then continued in tandem with an increase in the frequency of generator cut offs, until the generator eventually failed in November 2006. These 8 months give the operator time to decide when to repair the generator rather than having to replace it altogether, which may be more costly and lead to a greater period of downtime. Techniques introduced in the future can also be easily incorporated into the MAS framework, which will also allow more opportunities for corroboration, and hence a more robust fault detection system. This corroboration can be built in automatically and carried out by the interface agent or another agent dedicated to correlating the various sources of information.
Conclusions This paper has described a set of techniques that can be used for early fault identification for the main components of a wind turbine. The results have shown that they can automatically interpret the large volumes of SCADA data presented to an operator and highlight only the important aspects that would be of interest to them. In this way, they dramatically reduce the information that is presented to the operator, therefore allowing them to make more informed decisions regarding the maintenance of the turbine. The proposed multi-agent platform allows the techniques to be brought together to corroborate their output for more robust fault detection. It also allows the development of a system that can be used to apply the techniques across a complete wind farm, therefore offering only one point of contact for an operator that provides all of this information in a clear and concise manner. The next steps of the research will focus on developing this agent architecture into a fully functioning automated fault detection system.
References 1. BWEA. UK Wind farm statistics. [Online]. Available at: http://www.bwea.com/statistics/, (Accessed 25 June 2007) 2. Schneider J, Gaul AJ, Neumann C, Hografer J, Wellssow W, Schwan M, Schnettler A. Asset management techniques. Electrical Power Energy Systems 2006; 28(9): 643–654. 3. Becker E, Poste P. Keeping the blades turning: condition monitoring of wind turbine gears, Refocus 2006; 7: 26–32. 4. Hameed Z, Hong YS, Cho YM, Ahn SH, Song CK. Condition monitoring and fault detection of wind turbines and related algorithms: a review. Renewable Sustainable Energy Reviews, 2009; 13(1): 1–39. DOI: 10.1016/ j.rser.2007.05.008. 5. Caselitz P, Giebhardt J. Rotor condition monitoring for improved operational safety of offshore wind energy converters. Journal of Solar Energy Engineering–Transactions of the ASME 2005; 127: 253–261. 6. Sanz-Bobi MA, Garcia MC, Del Pico J. SIMAP: intelligent system for predictive maintenance application to the health condition monitoring of a wind turbine gearbox. Computers in Industry 2006; 57: 552–568. 7. Leany V, Sharpe DJ, Infield DG. Condition monitoring techniques for optimisation of wind farm performance. International Journal of COMADEM 1999; 2: 5–13. 8. Leany V, Sharpe DJ, Infield DG. The applicability of spatial analysis techniques to monitoring wind farms. In Proceedings of the European Wind Energy Conference, 1–5 March 1999. 216–219. 9. Singh S, Bhatti TS, Kothari DP. Wind power estimation using artificial neural network. Journal of Energy Engineering 2007; 133(1): 46–52. 10. Baines N, Riddle AF, Hart DJ. Intelligent Data Management System for Wind Farm Monitoring and Operation Optimisation. Harwell Laboratory, Energy Technology Support Unit: Harwell. 1998. 11. Fayyad UM. Advances in Data Mining and Knowledge Discovery. MIT Press: Cambridge, Massachusetts, 1996. Copyright © 2009 John Wiley & Sons, Ltd.
Wind Energ 2009; 12:574–593 DOI: 10.1002/we
Online Wind Turbine Fault Detection through Automated SCADA Data Analysis
593
12. McArthur SDJ, Booth CD, McDonald JR, McFadyen IT. An agent-based anomaly detection architecture for condition monitoring. IEEE Transactions on Power Systems 2005; 20; 1675–1682. 13. Stephen B, Strachan SM, McArthur SDJ, McDonald JR, Hamilton K. Design of trip current monitoring system for circuit breaker condition assessment. IET Generation, Transmission & Distribution 2007; 1(1): 89–95. 14. Tarassenko L, Nairac A, Townsend N, Buxton I, Cowley P. Novelty detection for the identification of abnormalities. International Journal of Systems Science 2000; 31: 1427–1439. 15. Devendra T, Murat Y, Asok R, Vigor Y. Anomaly detection in aircraft gas turbine engines. Journal of Aerospace Computing, Information and Communication 2006; 3: 44–51. 16. McArthur SDJ, Strachan SM, Jahn G. The design of a multi-agent transformer condition monitoring system. IEEE Transactions on Power Systems 2004; 19: 1845–1852. 17. McArthur SDJ, Catterson VM, McDonald JR. A multi-agent condition monitoring architecture to support transmission and distribution asset management. Proceedings of the 3rd IEE International Conference on Reliability of Transmission and Distribution Networks, London, 2005. 18. Stack JR, Habetler TG, Harley RG. Fault classification and fault signature production for rolling element bearings in electric machines. IEEE Transactions on Industry Applications 2004; 40: 735–739. 19. Yang J, Montakhab M, Pipe AG, Davies TS. Application of multi-agent technology to fault diagnosis of power distribution systems. Proceedings of Engineering of Intelligent Systems, 2004. 20. Haykin S. Neural Networks: a Comprehensive Foundation. Prentice-Hall International Editions: Englewood Cliffs, NJ. 21. Hansen MOL. Aerodynamics of Wind Turbines (2nd edn). Earthscan: London, UK. 22. McArthur SDJ, Davidson EM, Catterson VM, Dimeas AL, Hatziargyriou ND, Pomci F, Funabashi T. Multi-agent systems for power engineering applications—Part I: concepts, approaches, and technical challenges. IEEE Transactions on Power Systems, 2007; 22: 1743–1752. 23. Wooldridge MJ, Jennings NR. Intelligent agents: theory and practice. Knowledge Engineering Revision; 1995; 10: 115–152. 24. Java Agent Development Framework (JADE). [Online]. Available: http://jade.cselt.it/. (Accessed 15 July 2008) 25. Foundation for Intelligent Physical Agents. FIPA Communication Act library specification, [Online]. Available: http:// fipa.org/specs/fipa00037. (Accessed 22 July 2008).
Copyright © 2009 John Wiley & Sons, Ltd.
Wind Energ 2009; 12:574–593 DOI: 10.1002/we