Optimal Futures: Multi-Objective Programming Models for Generating Landscape Futures under Alternative Policy Options and Scenarios Bryan, B.A. 1, N.D. Crossman1, and D. King1 1
CSIRO Land and Water, Urrbrae, South Australia Email:
[email protected]
Keywords: Landscape planning, futures analysis, scenario generation, GIS, integrated assessment on the Lower Murray region in Australia is used to demonstrate the technique. The models identify specific geographic locations in the landscape for six natural resource management actions such that regional targets are achieved. The models are developed for 5 different policy options – Go Anywhere, Cheapest, Best for Biodiversity, Best for NRM, and Most Cost Effective, under a baseline and four alternative future climate and economic scenarios. Multi-objective programming was able to identify the optimal arrangement of actions in the landscape according to the various policy options and hence, is an effective tool for quantifying the boundary conditions of the policy decision of how best to achieve regional targets.
EXTENDED ABSTRACT The future composition of Australia’s rural landscapes are uncertain and may be subject to substantial change following changes in climate, market prices, technology and social attitudes. Exploring alternative landscape futures can be useful for informing strategic policy decisions in regional natural resource management settings. Most studies of landscape futures involve a combination of participatory stakeholder involvement and quantitative modelling in identifying landscape futures. In this paper we present multi-objective programming as a landscape futures generation engine. A case study 1.
Victoria. The environmental, economic, and social impacts of landscape futures are more fully discussed in Bryan et al. (2007a,b).
INTRODUCTION
Through the National Action Plan for Salinity and Water Quality, regional catchment management and natural resource management agencies have developed plans and strategies for managing natural resources. The plans detail the principal environmental objectives and appropriate management interventions for their achievement. These are generally articulated as a set of targets aimed at achieving regional sustainability.
1.1.
Study Area
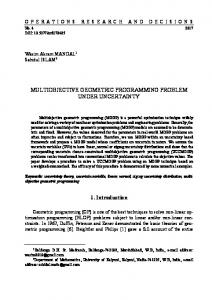
The Lower Murray is a diverse landscape ranging from the moist, hilly uplands of the upper Wimmera and Mt. Lofty Ranges, through large areas of productive agricultural cropping/grazing country, to semi-arid rangelands in the northern parts of the SAMDB. The River Murray also winds its way across the predominantly flat topography, supporting a corridor of high value irrigated agriculture.
In this paper we present a quantitative analytical method for generating alternative landscape futures. Landscape futures describe the spatial arrangement of natural resource management actions and land uses in the landscape which together, achieve stated regional targets. The techniques are applied to the dryland agricultural areas of the Lower Murray region in southern Australia. The Lower Murray region which includes the South Australian Murray-Darling Basin (SAMDB), and the Victorian Mallee and Wimmera Catchment Management Authorities. The specific parts of the landscape of interest include cleared agricultural areas and remnant vegetation, exclusive of urban, irrigated agriculture, and floodplain areas. The results are demonstrated for the Mallee CMA in western
The Lower Murray maintains significant biodiversity, land, and water resources. However, the cumulative impact of 90 years of land clearance and productive use has led to the ongoing degradation of these natural resources. Management is required to halt threatening processes and reverse this declining trend in the condition of natural resources in the Lower Murray.
247
modelling offers quantitative insights into socioeconomic and biophysical processes (Raskin, 2005). Many studies have defined landscape scale scenarios using qualitative techniques based on participation of stakeholder groups alone (Hulse et al. 2004; Patela et al., 2007). Others have combined participatory approaches with quantitative scenario modelling in the analysis of landscape futures. Quantitative modelling techniques have included systems modelling (Bellman, 2000), agent-based modelling (Happe et al., 2006), and the coupling of GIS with multiple process models (Stoms et al., 2004). Liu et al. (2007) found system models and optimisation techniques based on scenario analysis to be valuable tools for selecting engineering measures and policies for watershed management under uncertainty. In this study, we used participatory approaches to help define the specifics of alternative futures and use a data-centric, multipleobjective mathematical programming technique to model alternative spatially explicit landscape futures.
Figure 1. Location map and land use in Lower Murray region in southern Australia. 2.
MODELLING LANDSCAPE FUTURES
2.1. Environmental Objectives and Management Actions
Scenario analysis and futures thinking has become an increasingly popular and accepted methodology for planning, especially recently in the field of environmental management and planning. In this type of analysis scenarios are used to inform strategic planning. Scenarios are not intended to be the most likely outcomes nor are they in any way intended as predictions. Rather, scenarios are a plausible and internally consistent future. As a rule of thumb, the set of scenarios should cover a range of possible eventualities.
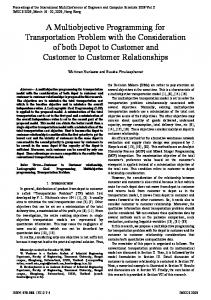
The aims of this study centre on the analysis of alternative futures arising from the implementation of regional plans. Through extensive review of the regional plans and consultation with stakeholders we identified four environmental objectives relevant to the dryland agricultural areas of the Lower Murray (Figure 2). All but the climate change objective have at least one formal target set for their mitigation in the regional plans of the SAMDB, Mallee, and Wimmera.
Scenario analysis has since been applied in a variety of environmental settings to assist decision makers with understanding future uses of natural resources (Schwartz, 1996). Within this context, there is a rich tradition in global scenario analysis development (IPCC, 2001; Raskin 2005) and there are many applications of scenario analysis on a landscape scale (Steinitz et al., 2003; Berger and Bolte, 2004; Hulse et al., 2004; Santelman et al., 2004; Cork and Delaney, 2005).
In addition, five management actions are also identified through the same process (Table 1). Actions are a plausible means of addressing the environmental objectives and achieving targets. Landscape futures are explicit spatial arrangements of management actions such that the regional targets are met. However, there is no simple one-to-one mapping of natural resource management actions to objectives. Rather, the linkages between actions and objectives are complex. Each action may address one or more objectives and contribute to meeting the targets associated with the objectives (Figure 2). Conversely, each objective may be addressed (and the associated targets achieved) through one or more natural resource management actions (Figure 2).
Scenarios are plausible stories about how the future might look based on existing patterns, new factors, alternative policies, and human choices (Raskin, 2005). The strength of scenario analysis lies in the blending of rich textural qualities of imagined narratives with the rigorous, structured and replicable traits of quantitative modelling. The narrative offers qualitative values while the
248
geographic areas for natural resource management actions in the landscape.
Figure 2. Linkages between NRM actions and environmental objectives. NRM Actions
Description
Ecological Restoration
Restoration of local native species, ecological structure and function
Conservation Farming
Incorporation of minimum tillage and stubble retention techniques in crop/fallow rotation
Deep-rooted Perennials
Plantation of fodder crops (e.g. lucerne, saltbush) for sheep grazing
Biomass
Oil mallee species grown for processing into activated charcoal, oil, and renewable energy
Biofuels
Wheat/canola rotation (using conservation farming techniques) for ethanol and biodiesel production
Spatial Strategy
Go Anywhere
Randomly select spatial units for actions
Cheapest
Minimise economic cost of actions including establishment costs and opportunity costs of foregone agricultural production
Best for Biodiversity
Maximise biodiversity benefit of actions
Best for NRM
Maximise benefits for multiple environmental objectives - biodiversity, deep drainage, wind erosion, and climate change
Most Cost Effective
Minimise the marginal cost of environmental benefits for multiple objectives biodiversity, deep drainage, wind erosion, and climate change
Table 2. Description of the spatial targeting strategy associated with the five policy options. 2.3.
Scenarios
Future scenarios are specified to enable assessment of the costs, benefits, and trade-offs involved with changes in external drivers such as the climate and commodity markets. In this study we consider changes in the external drivers of climate and commodity markets the specifics of which were designed through consultation with regional stakeholders and regional climate change predictions (Table 3). Changes in these drivers fundamentally affect the spatial distribution of environmental benefits and economic costs of natural resource management actions. Changes in these drivers may also affect how some targets are addressed. Thus, changes in these external drivers may lead to very different landscape futures and impacts.
Table 1. Natural resource management actions for addressing environmental objectives. 2.2.
Policy Option
Policy Options
Regional targets are almost always aggregate targets. That is, they specify an aggregate area of a specific action or threat amelioration over the entire region (e.g. SAMDB - increase area of remnant vegetation by 1% in the agricultural regions). Sometimes the aggregate target directs actions towards a geographically specific area (e.g. Mallee - 30% native vegetation cover across each bioregion). Largely however, actions could be undertaken anywhere in the region. As long as the aggregate amount is achieved, then the target is met. However, the region exhibits a high degree of heterogeneity in spatial processes across the landscape. Spatial variation in the costs and benefits of natural resource management actions is pronounced. To capture this spatial variation we assess the costs and benefits of achieving targets according to five strategic policy options (Table 2). Policy options represent different ways of targeting
S0
S1
S2
S3
S4
Temperature
Historical mean
+1oC
+2oC
+4oC
+1oC
Rainfall
Historical mean
-5%
-15%
-25%
+5%
Carbon Price
$0/t CO2-e
$15/t CO2-e
$7/t CO2-e
$2/t CO2-e
$15/t CO2-e
Biomass Price
$0/t
$50/t
$40/t
$30/t
$50/t
Biofuels Price
+0%
+50%
+30%
+10%
+50%
Table 3. Parameters for the baseline (S0) and four future scenarios analysed in this study. The scenario analysis complements the policy option approach in this study. Each policy option is assessed under each alternative future scenario enabling the comparison of the relative influence
249
of internal (policy and strategic decisions) versus external factors (climate and market forces). 2.4.
As described above, five natural resource management actions can be used to address environmental objectives - ecological restoration (ER), conservation farming (CF), deep-rooted perennials (DRP), biomass (BM), and biofuels (BF). The five actions (a) are represented by the set A where A = {ER, CF, DRP, BM, BF}. A variable was defined that contained the total amount of area within each spatial unit (j) that was subject to each of the five actions (a) for each of the five scenarios s in the set of scenarios S where S = {S0, S1, S2, S3, S4}. This variable is a vector X with dimension n x 5 x 5 and elements xjas.
Systematic Regional Planning
Bryan and Crossman (2007) developed the concept of systematic regional planning for natural resource management as a quantitative technique that utilises spatial optimisation within a multicriteria decision analysis framework. Systematic regional planning enables the identification of the geographic location of actions in the landscape to efficiently achieve multiple environmental and economic objectives.
Within each spatial unit (j) the linear programs selected areas (xjas) of each natural resource management action a under each scenario s that minimised a specific objective function for each policy option. The sum of the areas selected for the five actions in each spatial unit could not exceed the total area of the spatial unit (Areaj) for each scenario such that:
In this study, we used systematic regional planning as a landscape futures generation engine. The five different policy options analysed in this study define the objective function (minimise cost, maximise biodiversity benefits etc.) of the multiobjective programming models. The regional targets form the model constraints. Models were built for each policy option under the baseline and four climate change scenarios. For each policy option and scenario combination, landscape futures are characterised by an explicit spatial arrangement of natural resource management actions in the landscape such that the regional targets are met.
0 ≤ ∑ x jas ≤ Area j for j = 1...n , ∀ s in S a∈A
Unique objective functions were created for each policy option. Objective functions are multiobjective and weighted such that the costs scores are roughly similar to the benefits scores. Each policy option incorporates different elements of the economic costs of the five natural resource management actions and the benefits of these actions for biodiversity, deep drainage, wind erosion, and climate change. The objective functions are broadly described in Table 2 and the mathematics are presented in full in Bryan et al. (2007).
The multi-objective programming based systematic regional planning models of landscape futures were written in the General Algebraic Modelling System (GAMS) and solved using the CPLEX solver. 2.5.
Preliminary Spatial Analysis
Quantitative generation of landscape futures demanded large amounts of data capturing the full spatial heterogeneity and process complexity (environmental, economic, and social) of the Lower Murray. Various spatial and process modelling were used in the development of layers that both operationalise regional targets and quantify the costs and benefits of natural resource management actions under the baseline and future scenarios. These layers were key inputs to the generation of landscape futures using the systematic regional planning linear programming models. 2.6.
2.7.
Regional Targets as Constraints
Regional targets were set as constraints in the multi-objective programming models to ensure that regional targets are achieved in all landscape futures. Separate models were built for all three regions but here we present the Mallee region only as an example. The following targets/constraints are consistent across all scenarios S: Increase extent of each Ecological Vegetation Class to at least 15% of pre-1750 extent:
Multi-objective Programming Models
n
∑θ j =1
Sub-paddock scale spatial units were identified by combining several zonal databases including property boundaries, climate zones, soil classes, pre-European vegetation communities, and bioregions. A total of n spatial units formed the basis of the multi-objective programming models.
je
x jER + Ve
Areae
Where:
250
≥ 0.3
θ je∈ {0,1}, for ∀ e in E
θ je
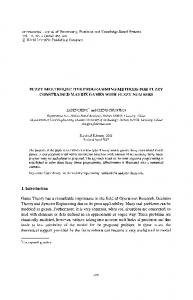
between policy options and scenarios (Figure 3). The environmental and economic impact of landscape futures also varies widely between policy options and scenarios (Figure 4, Table 4).
= 1 if spatial unit j occurs in Ecological Vegetation Class e, 0 otherwise E = the set of all Ecological Vegetation Classes occurring in the Mallee
Under the baseline, regardless of policy option, achieving regional targets is likely to have a significant economic impact in the Mallee ($65 to $349 M/yr, Table 4). With the introduction of new incentives and industries providing economic returns for natural resource management actions under scenarios S1 to S4, the achievement of regional targets is less expensive (maximum cost $204 M/yr) and an economic gain to the region’s farmers of up to $173 M/yr may even be made depending on the scenario (Table 4).
Ve = the total extant area of Ecological Vegetation Class e (i.e. still under remnant vegetation) Areae = the total pre-1750 area of Ecological Vegetation Class e 30% native bioregion: n
∑θ j =1
jb
vegetation
cover
across
each
x jER + Vb
θ jb∈ {0,1}, for ∀ b in B
≥ 0.3
Area b
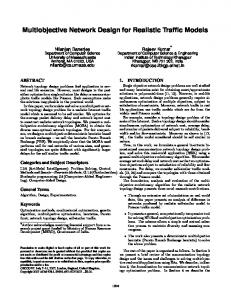
Under the Go Anywhere policy option, the landscape future is a random mix of natural resource management actions. Total environmental benefits are very high under the Go Anywhere policy option due to the high aggregate areas of actions required to reach targets without the benefit of strategic spatial targeting. However, the economic impact is very high (-$99 to -$349 M/yr, Table 4), and the cost-effectiveness and efficiency is poor (Figure 4).
Where: B = the set of all bioregions occurring in the Mallee Vb = the total area of remnant vegetation occurring in bioregion b Areab = the total area of bioregion b Land threatened by salinisation reduced from 10% to 8% of the total land surface: n
∑ s (x j =1
j
jER
+ x jDRP + x jBM ) ≥ 0.2
n
∑ s Area j =1
The landscape future resulting from the Cheapest policy option has the lowest economic cost to the Mallee (-$65 to $173 M/yr, Table 4). The landscape future is characterised by those actions that have the greatest economic returns rather than the greatest environmental benefits such as biofuels, biomass, and conservation farming located in areas with the lowest opportunity cost (Figure 3). The cost effectiveness of Cheapest policy option is variable but generally an improvement on the Go Anywhere policy option due to the reduced cost.
j
s j ∈ {0,1}
j
Where: sj = 1 if spatial unit j is classified as land threatened by salinisation (Bryan et al., 2007b) 20% reduction in recharge from farming systems: n
∑ ( DD j =1
jTrad
− DD jDRP )( x jER + x jDRP + x jBM ) ≥ 0.2
n
∑ DD j =1
jTrad
s j ∈{0,1}
Area j
Where: DDjTrad = The average annual deep drainage (mm/yr) of spatial unit j under traditional farming system rotations as modelled by APSIM (Bryan et al., 2007b)
Ecological restoration dominates the landscape futures under the Best for NRM and Most Cost Effective policy options because it provides benefits for multiple objectives (Figure 2). Biofuels is also an important part of the Most Cost Effective landscape future due to the potential economic returns generated. Both of these policies achieve targets efficiently and are characterised by reasonably good aggregate environmental benefits
DDjDRP = The average annual deep drainage (mm/yr) of spatial unit j under deep-rooted perennials as modelled by APSIM (Bryan et al. 2007b) 3.
The Best for Biodiversity policy option targets the highest biodiversity benefit sites located in the south-eastern Mallee for ecological restoration (Figure 3). However, due to this policy only targeting biodiversity, other actions are randomly distributed (not mapped) leading overall to similar total costs, benefits, and cost effectiveness to the Go Anywhere option (Figure 4, Table 4).
EXAMPLE RESULTS
Landscape futures generated through systematic regional planning models vary significantly
251
S0
S1
S2
S3
S4
Carbon Benefits (‘000s cars off the road)
High Risk Wind Erosion Areas Managed (‘000's ha)
Total Biodiversity Benefit Score (Millions) High Risk Deep Drainage Areas Managed (‘000's ha)
Scenario and Policy Option
Net Economic Returns ($ Millions)
The results suggest that climate change has only a relatively minor impact on the geographic character of landscape futures, and on the impacts of landscape futures through the effect on crop yields, carbon productivity, and increases in wind erosion and biodiversity risk. Strategic policy drivers, economic incentives, and commodity prices tend to have a much stronger influence.
Total Area of NRM Actions Required (Millions ha)
and lower areal requirements and economic costs (Table 4).
Go Anywhere
2.29 -348.6
3.1 14.2
372 1,484
Cheapest
0.89
1.1
3.5
264
327
Best for Biodiversity
2.29 -257.5
1.6 10.9
371
337
Best for NRM
0.84 -142.5
2.7
5.8
272 1,060
Most Cost Effective
0.85 -139.1
2.7
5.5
269 1,070
Go Anywhere
2.29
-99.1
3.1
8.0
498 1,661
Cheapest
1.00
99.6
1.4
2.5
367
617
Best for Biodiversity
1.84
-44.2
1.9
6.8
499
904
Best for NRM
0.92
-77.7
3.6
7.8
373 1,235
Most Cost Effective
0.95
28.7
2.7
7.6
371
Go Anywhere
2.29 -129.3
3.3
4.9 1,091 1,581
Cheapest
1.05
33.8
1.5
1.7
450
565
Best for Biodiversity
1.86
-81.0
2.0
4.3 1,089
828
Best for NRM
0.98
-82.9
4.0
2.2
440 1,356
Most Cost Effective
0.99
-55.0
3.6
2.2
429 1,194
Go Anywhere
2.29 -108.7
4.3
5.0 1,291 1,498
Cheapest
2.26
-9.3
1.9
0.4 1,242
458
Best for Biodiversity
1.84
-81.6
2.6
4.4 1,288
732
Best for NRM
2.26 -204.3 13.9
7.9 1,257 4,291
Most Cost Effective
2.26 -196.3 13.6
7.9 1,300 4,214
Go Anywhere
2.29 -174.4
3.2 27.3
368 1,729
Cheapest
1.17
173.0
1.4
8.2
287
814
Best for Biodiversity
1.85
-80.9
2.0 21.7
366
985
Best for NRM
1.01 -149.1
4.0 14.1
285 1,479
Most Cost Effective
1.07
3.1 12.4
286 1,209
-65.0
22.5
946
Table 4. Selected performance indicators of landscape futures by policy option and future scenario for the Mallee. Figure 3. Alternative landscape futures for each policy option under the mild warming/drying scenario.
4.
Effective scenarios examine the range of plausible futures to enable the anticipation of and planning for surprises and shocks. Scenario analysis and the analysis of landscape futures involve the quantification of impacts across a broad spectrum of indicators. The outcome of this process can provide decision makers with quantitative assessments of possible outcomes of strategically defined scenarios.
Mallee - Cleared Agricultural Areas
6
2 S0
Cost B enefit R at
3
io
5 4
Developing the quantitative landscape futures generation engine described in this paper presented a challenge due to the complexity of the environmental objectives and the natural resource management actions considered (Figure 2). We opted to extend the systematic regional planning approach of Bryan and Crossman (2007) across multiple objectives and actions. In the generation of landscape futures this formalisation provides a set of extreme or optimal futures based on clearly
1
S1 0
S2
yw An
i ty ers div Bi o for re he
Go st pe ea Ch
RM
st Co
N for
st Mo
st Be
S4
st Be
S3
DISCUSSION AND CONCLUSION
tiv ec Eff e
Figure 4. Cost effectiveness of policy options under the baseline and future scenarios.
252
identified objectives and targets. The multiobjective programming framework was particularly suitable for landscape futures analysis because it produced a manageable set of options for considering the range of possible outcomes. The analysis of strategic policy options manifest as different objective functions provides a clear, consistent and optimal set of landscape futures, each of which is known to achieve regional targets at minimum cost, or maximum benefit or some combination thereof. The costs, benefits and tradeoffs of which are directly comparable.
Volume 3 – Preliminary analysis and modelling, CSIRO Water for a Healthy Country Flagship, 378 pp. Cork, S. and K. Delaney (2005), Thinking about the future of Australia’s landscapes, Land and Water Australia, Canberra. Happe, K., K. Kellermann, and A. Balmann. (2006), Agent-based analysis of agricultural policies: an illustration of the agricultural policy simulator Agripolis, its adaptation and behavior, Ecology and Society, 11, U481-U507.
Many analyses of landscape futures rely on qualitative scenarios. These are often developed with stakeholders and essentially take the form of lines drawn on maps. Based on stakeholder consultation, the systematic regional planning generation engine was able to integrate a variety of spatial information about multiple environmental, economic, and social objectives. The outputs were mapped landscape futures that achieve regional targets according to clearly stated strategic policy objectives. The techniques used effectively identify the endmember possibilities for landscape futures. 5.
Hulse, D.W., A. Branscomb, and S.G. Payne (2004), Envisioning alternatives: using citizen guidance to map future land and water use, Ecological Applications, 14, 325-341. Liu, Y., H.C. Guo, Z.X. Zhang, L.J. Wang, Y.L. Dai, and Y.Y. Fan (2007), An optimization method based on scenario analysis for watershed management under uncertainty, Environmental Management, 39, 678-690.
REFERENCES
Baker, J.P. et al. (2004), Alternative futures for the Willamette River Basin, Oregon, Ecological Applications, 14, 313-324.
Patela, M., K. Kok, and D.S. Rothman (2007), Participatory scenario construction in land use analysis: an insight into the experiences created by stakeholder involvement in the northern Mediterranean, Land Use Policy, 24, 546-561.
Bellmann, K. (2000), Towards to a system analytical and modelling approach for integration of ecological, hydrological, economical and social components of disturbed regions, Landscape and Urban Planning, 51, 75-87.
Raskin, P.D. (2005), Global scenarios: background review for the Millennium Ecosystem Assessment, Ecosystems, 8, 133–142. Santelman, M.V. et al. (2004), Assessing alternative futures for agriculture in Iowa, U.S.A., Landscape Ecology, 19, 357-374.
Berger, P.A. and J.P. Bolte (2004), Evaluating the impact of policy options on agricultural landscapes: an alternative-futures approach, Ecological Applications, 14, 342-354.
Schwartz, P. (1996), The art of the long view: planning for the future in an uncertain world. Doubleday, New York.
Bryan, B.A. and N.D. Crossman (in press), Systematic regional planning for multiple objective natural resource management, Submitted to Journal of Environmental Management.
Steinitz, C. et al. (2003), Alternative futures for changing landscapes - the Upper San Pedro River Basin in Arizona and Sonora, Island Press, Washington, DC.
Bryan, B.A. et al. (2007a), Lower Murray landscape futures dryland component: Volume 2 – Analysis of regional plans and landscape futures, CSIRO Water for a Healthy Country Flagship, 172 pp.
Stoms, D.M., K.M. Chomitz, and F.W. Davis (2004), Tamarin: a landscape framework for evaluating economic incentives for rainforest restoration, Landscape and Urban Planning, 68, 95-108.
Bryan, B.A. et al. (2007b), Lower Murray landscape futures dryland component:
253