vol. 157, no. 4
the american naturalist
april 2001
Optimal Size and Number of Propagules: Allowance for Discrete Stages and Effects of Maternal Size on Reproductive Output and Offspring Fitness
Andrew P. Hendry,1,* Troy Day,1,† and Andrew B. Cooper 2,‡
1. Department of Zoology, University of British Columbia, Vancouver, British Columbia V6T 1Z4, Canada; 2. Quantitative Ecology and Resource Management, University of Washington, Seattle, Washington 98195 Submitted January 18, 2000; Accepted November 16, 2000
abstract: Existing optimality models of propagule size and number are not appropriate for many organisms. First, existing models assume a monotonically increasing offspring fitness/propagule size relationship. However, offspring survival during certain stages may decrease with increasing propagule size, generating a peaked offspring fitness/propagule size function (e.g., egg size in oxygen-limited aquatic environments). Second, existing models typically do not consider maternal effects on total reproductive output and the expression of offspring survival/propagule size relationships. However, larger females often have greater total egg production and may provide better habitats for their offspring. We develop a specific optimality model that incorporates these effects and test its predictions using data from salmonid fishes. We then outline a general model without assuming specific functional forms and test its predictions using data from freshwater fishes. Our theoretical and empirical results illustrate that, when offspring survival is negatively correlated with propagule size, optimal propagule size is larger in better habitats. When larger females provide better habitats, their optimal propagule size is larger. Nevertheless, propagule number should increase more rapidly than propagule size for a given increase in maternal size. In the absence of density dependence, females with greater relative reproductive output (i.e., for a given body size) should produce more but not larger propagules. * Corresponding author. Present address: Organismic and Evolutionary Biology Program, University of Massachusetts—Amherst, Massachusetts 010035810; e-mail:
[email protected]. †
Present address: Department of Zoology, University of Toronto, Toronto, Ontario M5S 3G5, Canada. ‡ Present address: National Audubon Society, Living Oceans Program, 550 South Bay Avenue, Islip, New York 11751.
Am. Nat. 2001. Vol. 157, pp. 387–407. q 2001 by The University of Chicago. 0003-0147/2001/15704-0003$03.00. All rights reserved.
Keywords: reproductive trade-offs, egg number, clutch size, fecundity, parental care, sockeye salmon.
Optimality models of propagule size and number have a long tradition in evolutionary biology (e.g., Lack 1947; Smith and Fretwell 1974; Parker and Begon 1986; Lloyd 1987; McGinley et al. 1987; reviewed by Clutton-Brock 1991), and these models are an important foundation of life-history theory (Roff 1992; Stearns 1992). Common elements of propagule size/number optimality models are a trade-off between propagule size and number for a given level of overall investment, a monotonically increasing relationship betweensurvival (fitness) and propagule size, and maternal fitness as the product of average offspring fitness and propagule number. Optimal propagule size and number are found by maximizing maternal fitness. Certain aspects of existing propagule size/number models are not appropriate for many natural systems. First, the sign of the first derivative (positive or negative) of the relationship between offspring survival and propagule size may vary between different stages of development. As a particularly clear example, survival in oxygen-limited aquatic environments is expected to decrease with increasing egg size before hatching (Krogh 1959) but to increase with increasing egg size after hatching (Heath and Blouw 1998). Other natural systems where large propagules would be at a disadvantage during certain stages include animals with limited pelvic canal sizes and plants in environments where seed predators are size selective. The result of opposing offspring survival/propagule size relationships during two discrete stages will be a peaked offspring fitness/propagule size function. To our knowledge, no optimality model has considered this possibility. Second, attributes or behavioral choices of the parent may influence optimal propagule size and number (Parker and Begon 1986; Bernardo 1996; Kaplan 1998; Morris 1998). These influences may be manifested as positive correlations between female size and total reproductive output and between female size and the quality of the incubation
388 The American Naturalist or juvenile habitat. In fish, for example, larger females typically have greater total egg production and, in some species, may obtain (or prepare) better incubation environments for their eggs (i.e., more oxygen). We develop optimality models that incorporate two discrete stages of development (allowing for differences in the shape of offspring survival/propagule size relationships) and effects of maternal phenotype on total reproductive output and the expression of offspring survival/ propagule size relationships (e.g., through effects on habitat quality). Our first model assumes specific functional forms for relationships between egg size and fitness components, based on sockeye salmon (Oncorhynchus nerka) as a model system (“Specific Model”). We provide an empirical test of this model’s predictions using data from 84 discrete sockeye salmon populations and from four other salmonid species (56 additional populations). Our second model uses a general formulation that does not assume specific functional forms (“General Model”). This model is used to consider how optimal propagule size and number are influenced by maternal phenotype (size). These influences take the form of effects of female size on total reproductive output, which can lead to negative density dependence (as egg number increases, average offspring survival decreases), and on habitat quality. We apply this general model to the consideration of relationships between maternal size and egg size and between maternal size and egg number, in Canadian freshwater fishes and their congeners. Strong empirical support for both models suggests that our approach provides a useful modification to previous formulations. Specific Model A Model Organism We develop our specific optimality model in the context of salmonid fishes, particularly sockeye salmon, because doing so provides clear justifications for our assumptions and because exemplary data are available for empirical tests. During breeding in the fall, females prepare a nest in the gravel, deposit their eggs in the nest, cover the eggs with gravel, and then defend the nest against encroachment by other females (Foote 1990). The intensity of competition for nest sites can be very high within populations, with up to 0.74 females m22 (Hendry et al. 1995). Competitive ability in breeding females is determined by their body size and prior residence (Foote 1990; Fleming and Gross 1994). Males compete for access to breeding females but do not provide parental care (Foote 1990; Quinn et al. 1996). All adults die days to weeks after they start breeding (Hendry et al. 1999), which negates investment in future reproduction and exerts intense selection to maximize reproductive success during
a single breeding season (Fleming and Gross 1994; Quinn and Foote 1994). The eggs of sockeye salmon typically incubate in the gravel for 2–4 mo before hatching and then remain in the gravel for another 1–2 mo before emerging (Hendry et al. 1998). Oxygen levels can be quite low within the gravel, and many eggs die of suffocation (reviewed by Chapman 1988). After hatching but before emerging, salmonid embryos can respire through their gills and skin (Rombough and Moroz 1990) and can move through the gravel (Dill and Northcote 1970) to seek areas of higher oxygen content (Fast 1987). After emerging in the spring, larvae move immediately to adjacent lakes (where they grow for 1 or 2 yr) and then to the ocean (where they spend another 2 or 3 yr), before finally returning to their natal breeding sites as mature adults (Burgner 1991). Salmonids have large egg sizes relative to most other teleost fishes, particularly those breeding in freshwater (Elgar 1990; Winemiller and Rose 1992), and sockeye salmon have intermediate egg sizes relative to other salmonids (Scott and Crossman 1973; Beacham and Murray 1993). Egg size and number vary considerably within salmonid populations, owing primarily to female size (larger females have larger eggs and more of them) but also to a constraint imposed by the trade-off between egg size and number for a given body size (Quinn et al. 1995; Heath et al. 1999; Jonsson and Jonsson 1999; McGurk 2000). Variation in egg number among populations is typically related to average female size and migration distance (long migration p fewer eggs; Beacham and Murray 1993). Variation in egg size among populations is not correlated with female size (Quinn et al. 1995) but is correlated with adult migration distance (long migration p small eggs; Beacham and Murray 1993), latitude (higher latitude p larger eggs; Fleming and Gross 1990), and the size of the gravel in which eggs incubate (Quinn et al. 1995). In general, populations that spawn in sites with large gravel sizes have large eggs, presumably because oxygen is more available and eggs are less limited by surface-to-volume ratio constraints (Quinn et al. 1995). Model Development We assumed that each female has a single optimum egg size, as opposed to an optimal range of egg sizes (see discussion in McGinley et al. 1987); that egg size does not influence hatching or emergence times within populations (contrary to Shine 1978; Sargent et al. 1987); that individual offspring do not act cooperatively so as to maximize their inclusive fitness; that egg survival is density independent (this assumption is relaxed in our general model); and that maternal fitness is frequency independent. The biology of salmon indicates that the first three assumptions are valid
Optimal Size and Number of Propagules 389 (e.g., Burgner 1991; Hutchings 1991; Quinn et al. 1995; Hendry et al. 1998) but that the last two may sometimes be violated (Holtby and Healey 1986; Chapman 1988). The first step was to define the relationship between egg size and offspring fitness. Salmon, and many other organisms, have at least two discrete stages during which egg size can influence offspring fitness: before hatching (prehatching) and after hatching (posthatching). For salmon, the effects of egg size during these two stages oppose each other, requiring different offspring survival/egg size functions. For the posthatching period, we assumed larger eggs have higher survival (along with other positive contributions to fitness), as is typical for most organisms (Roff 1992, pp. 348–352), including salmonids (Bagenal 1969; Hutchings 1991; Einum and Fleming 1999, 2000a, 2000b; Heath et al. 1999; reviewed by Heath and Blouw 1998). We therefore modeled the posthatching survival/egg size function (Fpost(s)) in the standard manner (after McGinley et al. 1987; fig. 1A), where Fpost(s) p 1 2 (s min /s)a,
(1)
provided that s 1 s min; otherwise, Fpost(s) p 0,
(2)
where s is egg size, smin is minimum viable egg size, and a is a constant determining the rate at which the function approaches the asymptote. For our baseline scenario, s min p 0.070 g (wet mass of a fresh unfertilized egg) because this was near the minimum egg size observed in sockeye salmon. For the prehatching period, we assumed larger eggs have lower survival. This relationship arises because, as the size of aquatic eggs increases, oxygen acquisition cannot keep pace with oxygen demand (oxygen uptake is proportional to egg surface area whereas oxygen demand is proportional to egg volume; Krogh 1959). Oxygen-limited environments are common at salmon incubation sites (reviewed by Chapman 1988), and large eggs appear to be at a disadvantage in lower-quality sites (van den Berghe and Gross 1989). To represent this effect, we modeled the prehatching survival/egg size function (Fpre(s); fig. 1A) as Fpre(s) p k[1 2 (s/ks max)b],
(3)
provided that s ! ks max; otherwise, Fpre(s) p 0,
(4)
where s is egg size, smax is maximum viable egg size, b is a constant determining the rate at which the function approaches the asymptote (when b 1 1 ), and k is a constant
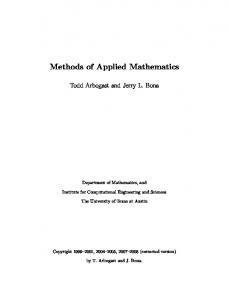
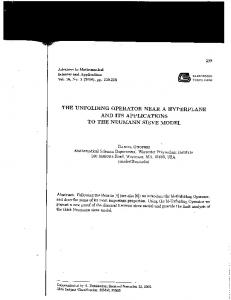
Figure 1: Properties of the specific optimality model. Posthatching survival functions intersect the X-axis at the minimum viable egg size (smin), prehatching survival functions intersect the X-axis at the maximum viable egg size (smax), and offspring fitness functions are bounded by smin and smax. A, Prehatching and posthatching survival functions and the corresponding offspring fitness function. B, Prehatching survival functions in habitats of three different qualities (large k p high quality) and the corresponding offspring fitness functions. C, Prehatching survival functions of different shapes and the corresponding offspring fitness functions. Optimal egg size occurs where offspring fitness peaks.
390 The American Naturalist related to the quality of the incubation habitat. Note that k influences both maximum viable egg size (k inside the brackets affects the X-axis intercept) and maximum survival (k outside the brackets affects the Y-axis intercept). For our baseline scenario, we assumed incubation habitats of three different qualities (good, k p 1; intermediate, k p 0.85; poor, k p 0.70; fig. 1B) and s max p 0.175 g, which is slightly larger than the maximum observed in sockeye salmon. The actual shape of the prehatching survival/egg size function is not known because a definitive experiment has yet to be performed. We therefore considered several different shapes (convex: b 1 1; linear: b p 1; concave: b ! 1; fig. 1C). For offspring fitness, we assumed posthatching habitat quality was independent of prehatching habitat quality. This assumption is tenable because salmonid embryos move extensively in the gravel after hatching (Dill and Northcote 1970; Fast 1987) and because juvenile sockeye salmon typically move to lakes immediately after they emerge (Burgner 1991). Offspring fitness (F(s)) thus becomes the product of prehatching and posthatching survival: F(s) p Fpre(s)Fpost(s).
(5)
If a p b, optimal egg size with respect to offspring fitness (so) can be determined analytically by setting dF(s)/ds p 0, yielding so p ÎkÎs minÎs max .
(6)
If a ( b, a closed-form solution could not be found, and so was determined numerically. Maternal fitness is the product of offspring fitness and egg number (Smith and Fretwell 1974; McGinley et al. 1987; Einum and Fleming 2000a), and egg number is the total mass of egg produced (E) divided by the average mass of individual eggs (s). Thus, maternal fitness (W(s)) is W(s) p F(s)(E/s).
(7)
It is important to recognize that our specific model assumes offspring fitness is not influenced by egg number (i.e., density dependence is ignored). As a result, the contribution of egg number to maternal fitness is a linear function (a female with 20 offspring of a given size will have twice the fitness of a female with 10 offspring of that size). We relax this assumption in our general model (see below). If a p b p 2 (baseline scenario), optimal egg size with respect to maternal fitness (sw) can be determined analytically by setting dW (s) /ds p 0, yielding
sw p
2 2 4 2 2 4 Î2k 2s max 2 s min 1 Îk 4s max 1 14k 2s max s min 1 s min
Î2
.
(8)
Other closed-form solutions can be found for a p b ( 2 but, if a ( b, sw was determined numerically. Optimal egg number (nw) is total egg production divided by optimal egg size (i.e., E/sw). We explored the effect of maternal phenotype (body size) on optimal egg size and number by considering females of three different sizes, approximating the range commonly observed in sockeye salmon populations (large p 525 mm, medium p 475 mm, small p 425 mm; middle of eye to end of hypural plate [MEH]). Female size could influence two parameters in the model: total egg production (E) and incubation habitat quality (k). Total egg production for females of each size was estimated empirically using the relationship for female sockeye salmon in the Cedar River, Washington: E p l 2.9141025.2, where l is female MEH length (see Hendry 1998, p. 69, for details). Large, medium, and small females were thus estimated to have an average total egg production of 533, 398, and 288 g, respectively. If the body length/egg production relationship for some other population or species was used, none of our important conclusions changed (only total egg number and absolute maternal fitness varied). Female size could also influence incubation habitat quality. Large female salmon are better competitors (Fleming and Gross 1994) and typically obtain preferred nesting sites (Foote 1990), which are of higher quality (van den Berghe and Gross 1989). We refer to this situation as “phenotype/ habitat matching” or “habitat matching.” For our baseline scenario, we assumed that 525-mm females would occupy habitats of quality k p 1.0, 475-mm females in habitats of quality k p 0.85, and 425-mm females in habitats of quality k p 0.70. The effects of phenotype/habitat matching on optimal egg size and number were evaluated by calculating the proportional difference in sw and nw between a 425-mm female and a 525-mm female (i.e., loge of optimal egg size or number for a 525-mm female minus loge of optimal egg size or number for a 425-mm female). The greater the proportional difference in egg size or number, the greater the change in that trait per unit of fish length. Proportional differences were useful because the sum of the proportional difference in egg size and the proportional difference in egg number equals the proportional difference in total egg production, log e 533 2 log e 288 p 0.616. Finally, we considered the effect that variation in relative egg production (i.e., for a given body size) has on optimal egg size and number (also for a given body size). We did so by considering three females that had total egg productions of 533, 398, and 288 g but that did not vary in length. As a result, females with these levels of egg pro-
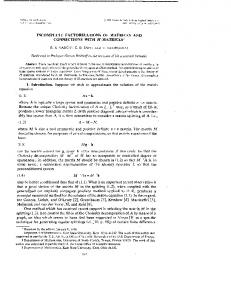
Optimal Size and Number of Propagules 391 duction would occupy similar average habitats (because habitat quality is related to female size, not relative egg production). This range in egg production is more than would typically be observed for females of a common size but was chosen to allow direct comparison to the habitat matching situation. Predictions and Empirical Tests Our specific model generated several predictions. First, when incubation habitat varies, optimal egg size is larger in better habitats (fig. 2A–2B). This was because we considered a stage where large eggs had lower survival than small eggs. Second, when larger females obtain (or provide) better incubation habitats, their optimal egg size is larger (fig. 2C). Third, optimal egg number increases more rapidly than optimal egg size for a given increase in female size (fig. 3). This was because maternal fitness gains associated with increasing egg number are stronger than those associated with increasing egg size. Fourth, optimal egg number but not optimal egg size increases with increasing relative egg production (fig. 4). This was because females with greater egg production for their body size are not expected to obtain (or to prepare) better incubation habitats. These predictions were robust to realistic ranges of parameter values. (We tested a p 0.3–3.5; b p 0.3–3.5; s min p 0.060–0.080; s max p 0.165–0.185; and k p 1.0, 0.95, 0.90–1.0, 0.70, 0.40.) Empirical support for the first prediction is implied by van den Berghe and Gross (1989), wherein the survival of small eggs was greater than that of large eggs in a given incubation site. A direct test of this prediction, however, has yet to be attempted. Empirical support for the second and third predictions was obtained using published and unpublished data for variation in egg size (mass) and body length for sockeye salmon (32 populations, 2,543 fish), coho salmon (Oncorhynchus kisutch: 22 populations, 495 fish), and masu salmon (Oncorhynchus masou: 7 populations, 153 fish) and variation in egg number and body length for sockeye salmon (74 populations, 9,335 fish), coho salmon (17 populations, 330 fish), masu salmon (7 populations, 149 fish), chinook salmon (Oncorhynchus tshawytscha: 18 populations, 1,902 fish), and brown trout (Salmo trutta: 9 populations, 135 fish). For each population, we determined slopes for log-log relationships (base e or base 10) between egg mass and female length and between egg number and female length, by reference to published slope coefficients or by calculation from original raw data. This analysis revealed that egg number and egg size almost universally increase with body length and that the egg number/body length slopes are almost always steeper than the egg size/body length slopes (table 1). Paired t-tests, comparing the two types of slopes for pop-
Figure 2: Optimal egg sizes with respect to prehatching habitat quality. A, Offspring fitness (rescaled to max p 1) in three different quality habitats. Arrows indicate the optima in each habitat. B, Maternal fitness (rescaled to max p 1) for a 525-mm female in these three habitats. C, Maternal fitness (rescaled to max p 1) for females of three different sizes under phenotype/habitat matching (larger females provide better prehatching habitats). Top line, 525-mm females, k p 1; middle line, 475mm females, k p 0.85; bottom line, 425-mm females, k p 0.70.
ulations with both types of data, confirmed that, for an increase in body length, the proportional increase in egg number is greater than the proportional increase in egg size (table 1).
392 The American Naturalist 1994), and Pick Creek, Alaska (24 females in 1995, 105 females in 1996). The Cedar River population is described in detail in Hendry and Quinn (1997) and Hendry et al. (1998), and the Pick Creek population is described in detail in Hendry et al. (1999) and Hendry and Berg (1999). Detailed methods for measuring egg size, egg number, and total egg production appear in Hendry (1998, pp. 67–70). Residuals from the relationships between each trait and body size (log10 transformed) were calculated for each fish
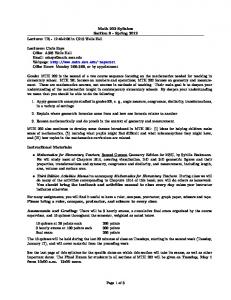
Figure 3: Demonstration that optimal egg number increases more rapidly than optimal egg size for a given increase in female size. Surfaces show the proportional difference in egg number minus the proportional difference in egg size between 525-mm and 425-mm females under phenotype/habitat matching. A, Weak habitat matching (525-mm females, k p 1.0; 425-mm females, k p 0.90). B, Very strong habitat matching (525-mm females, k p 1.0; 425-mm females, k p 0.50). Note that, when habitat matching is stronger, the difference between egg number and egg size slopes decreases.
Empirical results appropriate for testing the fourth prediction were available only from our own unpublished data. Briefly, we measured egg size (fresh wet mass of unfertilized eggs), egg number, and total egg production (total mass of all eggs produced) in two populations of sockeye salmon: Cedar River, Washington (81 females in
Figure 4: Effects of habitat quality and relative egg production (i.e., for a given body size) on optimal egg size and number. A, As the quality of the incubation environment increases, optimal egg number decreases, and as relative egg production increases, optimal egg number increases. B, As the quality of the incubation environment increases, optimal egg size increases, but as relative egg production increases, optimal egg size remains constant.
Optimal Size and Number of Propagules 393 Table 1: Relationships between egg size (mass) and female length and between egg number and female length for studies of salmonid fishes with at least five populations Egg number vs. body length
Egg size vs. body length 2
2
Paired t
Pops. (fish)
Slope (SD)
r (SD)
Pops. sig.
Pops. (fish)
Slope (SD)
r (SD)
Pops. sig.
Paired N (S 1 N)
t (P)
1.25 (.18) 1.05 (.31) 1.15 (.66) 1.01 (.93) 1.30 (.21) …
.19 (.15) .39 (.16) .32 (.20) .27 (.30) .49 (.06) …
14
14 (4,731) 10 (160) 17 (330) 7 (149) …
1.86 (.31) 2.03 (.30) 2.28 (.51) 1.94 (.90) …
.31 (.14) .61 (.16) .68 (.18) .35 (.23) …
14
…
14 (11) 8 (8) 14 (13) 7 (5) …
2.64 (.01) 7.63 (!.001) 5.75 (!.001) 1.78 (.04) …
Sockeye salmonf
14 (1,755) 8 (202) 22 (495) 7 (153) 10 (586) …
…
…
…
…
…
8
…
…
Sockeye salmonh
…
…
…
…
19
…
…
Sockeye salmoni
…
…
…
…
11
…
…
Chinook salmonj
…
…
…
…
15
…
…
Brown troutk
…
…
…
…
.33 (.06) .34 (.23) .45 (.16) .63 (.13) .40 (.19) .92 (.05)
…
…
1.58 (.26) 1.07 (1.36) 1.87 (.54) 2.50 (.33) 1.49 (.45) 2.42 (.24)
6
Sockeye salmong
6 (488) 14 (863) 19 (1,581) 11 (1,512) 18 (1,902) 9 (135)
9
…
…
Species Sockeye salmona Sockeye salmonb Coho salmonc Masu salmond Sockeye salmone
8 12 3 10
10 16 5
Note: Columns indicate the number of discrete populations (Pops.) with the number of fish in parentheses; the slope coefficient averaged across populations, r 2 averaged across populations, and the number of populations with significant slopes (Pops. sig.). The second column in from the right gives the number of populations for which both egg size and egg number slopes were available (Paired N) with the number of populations in which the egg number slope was greater in parentheses. The last column provides the t statistic (one-tailed P in parentheses) for paired t-tests of the difference in slope between egg size and egg number, both with respect to body length. All data were log transformed (loge or log10) to allow a direct comparison. a
Slopes are those reported in Linley (1993). Egg data were for dry mass, which gives the same log-log slope coefficients as wet
mass. b
Wetzel (1993); slopes were calculated from raw data provided by L. Wetzel.
c
Egg number slopes are those reported in Fleming and Gross (1990). Log-log egg-size slopes were calculated directly from raw
data by I. Fleming (personal communication). d
Slopes are those reported in Tamate and Maekawa (2000).
e
Quinn et al. (1995); log-log slopes were calculated from raw data provided by T. P. Quinn. We exclude all populations originally
analyzed by Wetzel (1993). f
Mathisen and Gunnerød (1969); years were pooled and slopes were calculated using raw data provided by T. Quinn.
g
Slopes are for all ages and years pooled for each population, as reported in Manzer and Miki (1986).
h
Slopes are those for anadromous sockeye salmon reported in McGurk (2000). For populations with more than one slope
reported, we considered only the slope with the larger sample size. We exclude all populations originally analyzed in Linley (1993), Wetzel (1993), Mathisen and Gunnerød (1969), and Manzer and Miki (1986). i
Slopes are those for nonanadromous sockeye salmon (kokanee) reported in McGurk (2000).
j
Slopes are those reported in Healey and Heard (1984).
k
Slopes are those reported in L’Abe´e-Lund and Hindar (1990). Egg diameter/female length slopes (not shown) were positive
for all nine populations (six of the slopes were significant).
within each of the three collections. In each case, residual egg production was positively correlated with residual egg number (Pearson’s r p 0.77–0.80, P ! .01 for each) but was not correlated with residual egg size (Pearson’s r p 0.07–0.27, P 1 .25 for each). These results confirmed that females with greater egg production for their body size have relatively more, but not larger, eggs.
Numerous other studies of salmonids lacked data necessary for our standardized analysis (i.e., they measured egg diameter or female weight rather than egg mass and female length) but nevertheless provided additional, qualitative support for the second and third predictions. Specifically, egg number increases strongly and egg size moderately with increasing female size (e.g., Jonsson and
394 The American Naturalist Jonsson 1999). In short, the specific model’s predictions were unequivocally supported by empirical data. General Model The essence of our overall approach is the consideration of discrete stages of development during which the direction of the offspring survival/propagule size relationship may vary and the consideration of the potential effects of maternal size on total reproductive output and on offspring survival/propagule size relationships. This conceptual framework can be applied to many questions regarding variation in propagule size and number within and among populations and species. Here, we illustrate a general application of our approach by developing a general model that predicts the direction of propagule size/female size relationships. The following analysis provides a general solution for how maternal size influences optimal propagule size when offspring survival during one stage (stage 1) is a decreasing function of propagule size, when offspring survival during another stage (stage 2) is an increasing function of propagule size, when larger females have greater total reproductive output, when female size can positively influence offspring survival during stage 1, and when greater total reproductive output by females can decrease the survival of individual offspring (i.e., negative density dependence). We first outline the analytical framework for this model (“Analytical Framework”) and then examine effects of female size on optimal propagule size under negative density dependence (i.e., more eggs reduce individual offspring survival; “Effects of Female Size Acting through Total Reproductive Output”), when large females provide better environments for their offspring during stage 1 (“Effects of Female Size Acting through Phenotype/Habitat Matching”), and when both density-dependent effects and habitat matching are present (“Effects of Female Size through Reproductive Output and Habitat Matching”). We also provide a general solution for how maternal size influences optimal propagule number under these conditions (“Effects of Female Size on Optimal Egg Number”). Analytical Framework Maternal fitness (W ) is the product of the number of propagules produced (N ), offspring survival during the first stage (F1), and offspring survival during a second stage (F2). Offspring survival during the first stage can be influenced by propagule size (s), habitat quality (k), and the total reproductive output of a female (total biomass of propagules produced, E). This latter effect represents density dependence and was not part of our specific model. Here, we assume that F2 is only a function of propagule
size, but the model could be modified to consider variation in habitat quality and density dependence during stage 2. The number of propagules produced is a function of total reproductive output (E ) and the size of propagules (s). Both k and E can be influenced by maternal size (l ). Thus, W can be written as W (s, k (l ) , E (l )) p F1 (s, k (l ) , E (l )) F2(s)N (s, E (l )) .
(9)
The optimal propagule size (sw) must satisfy the following criteria: W(s, k(l ), E(l)) s
F
2W(s, k(l), E(l)) s 2
p 0,
(10)
! 0.
(11)
sps w
F sps w
To evaluate the effect of female size on optimal propagule size, we implicitly differentiate equation (10) with respect to l: 2W ds 2W dk 2W dE 1 1 p 0. s 2 dl sk dl sE dl
( )( )(
)
(12)
This is the fundamental equation for evaluating effects of female size on optimal propagule size. We are interested in the sign (positive or negative) of ds/dl, when female size influences habitat quality (terms in the second set of brackets) and total reproductive output (terms in the third set of brackets). When ds/dl is positive, optimal propagule size is larger for larger females. When ds/dl is negative, optimal propagule size is smaller for larger females. Effects of Female Size Acting through Total Reproductive Output When larger females have greater total reproductive output, how should female size influence optimal propagule size? Assuming for this part that female size does not influence habitat quality (i.e., no habitat matching, dk/dl p 0), equation (12) can be simplified and rearranged to yield ds 2W dE p2 dl sE dl
(
)Z
2W . s 2
(13)
We know that 2W/s 2 ! 0 (we are looking for a maximum) and dE/dl 1 0 (larger females have greater total reproductive output). Therefore, ds/dl will be negative if 2W/sE ! 0 but will be positive if 2W/sE 1 0. Thus, evaluating the sign of 2W/sE will tell us whether in-
Optimal Size and Number of Propagules 395 creasing female size increases or decreases optimal propagule size. To find the sign of 2W/sE, we first differentiate equation (9) with respect to s: W F dF N p 1 F2 N 1 F1 2 N 1 F1F2 s s ds s
(14)
and then differentiate equation (14) with respect to E, grouping terms that include effects of E on F1 (i.e., density dependence) separately from those that do not: 2W 2F1 F1 dF2 F1 N p F2 N 1 N1 F2 sE sE E ds E s
(
1
)
F1 N dF N 2N F2 1 F1 2 1 F1F2 . s E ds E sE
(
)
(15)
Terms in the first set of brackets include any densitydependent effects of total reproductive output on propagule survival, whereas terms in the second set of brackets include any density-independent effects. Fortunately, terms in the second set of brackets sum to 0. This can be shown by noting that these terms are proportional to W/s, which from equation (10) equals 0. In particular, by assuming total propagule number (N ) equals total reproductive output (E) divided by propagule size (s), we have N p E/s and N/s p (2E/s 2), and therefore W F 1 dF 1 21 p E 1 F2 1 F1 2 1 F1F2 2 . s s s ds s s
(
)
2W 2F1 E F dF E F 2E p F 1 1 2 1 1 F2 2 . sE sE 2 s E ds s E s
)(
)
(17)
The second bracketed portion of this equation can be simplified further by recognizing from equation (16) that dF2 1 21 2F1 F2 1 1 F2 2 p . ds s s s F1 s
(18)
The resulting equation is 2W 2F1 E F F F 1 p F 2 1E 1 2 . sE sE 2 s E s F1 s
(
)(
)
Effects of Female Size Acting through Phenotype/Habitat Matching When larger females provide better stage 1 habitats for their offspring (i.e., habitat matching), how should female size influence optimal propagule size? Assuming for this part that density dependence does not occur ( 2W/sE p 0), equation (12) becomes
(16)
Because E 1 0, the bracketed terms of equation (16) sum to 0, and because N/E p 1/s and 2N/Es p (21/s 2), the terms in the second set of brackets of equation (15) sum to 0. We can thus rewrite equation (15) as
(
abilities), E 1 0, s 1 0 , and F1/s ! 0 (because larger propagules are assumed to have lower stage 1 survival). We further assume that F1/E ! 0 because a larger total biomass of propagules will decrease stage 1 survival (negative density dependence). Finally, we assume that 2F1/sE ! 0 because, as the total biomass of propagules increases, the disadvantage to large propagules, relative to small propagules, becomes progressively worse. Considering the signs of all these terms, it is apparent that 2W/sE ! 0, and from equation (13), ds/dl ! 0. Thus, without phenotype/habitat matching, increasing female size should decrease optimal propagule size when offspring survival decreases with increasing propagule density. We can also see from equation (13) that, if no density dependence occurs (i.e., [ 2W/sE][dE/dl] p 0), then ds/dl p 0. This result, that without density dependence and without habitat matching increasing female size should have no effect on optimal propagule size, can also be inferred from our specific model (see fig. 4B) and has long been recognized as a part of the Smith and Fretwell (1974) optimality framework.
(19)
In this equation, F1 1 0 and F2 1 0 (because they are prob-
( )Z
ds 2W dk p2 dl sk dl
2W . s 2
(20)
Following the procedures outlined in “Effects of Female Size Acting through Total Reproductive Output,” evaluating the sign of 2W/sk reveals whether increasing female size increases or decreases optimal propagule size. To find 2W/sk , we differentiate equation (14) with respect to k: 2W 2F1 F dF F N p F N 1 1 2 N 1 1 F2 p 0. sk sk 2 k ds k s
(21)
Factoring, substituting, and simplifying in a manner analogous to that in “Effects of Female Size Acting through Total Reproductive Output” yields 2W 2F1 E F1 F1 F2 1 p F 2 E . sk sk 2 s k s F1 s
(
)(
)
(22)
As before, F1 1 0, F2 1 0, E 1 0, s 1 0, and F1/s ! 0. We
396 The American Naturalist assume that F1/k 1 0 because better habitats increase stage 1 survival and that 2F1/sk 1 0 because, as habitat quality increases, the disadvantage to large propagules (relative to small propagules) becomes progressively less. Thus, 2W/sk 1 0, and because dk/dl 1 0 (larger females provide better habitats), equation (20) reveals that ds/dl 1 0. Thus, without density dependence, increasing female size should increase optimal propagule size when larger females provide better stage 1 habitats. This is the same result as that obtained in our specific model (fig. 2).
Effects of Female Size through Reproductive Output and Habitat Matching When larger females have greater total reproductive output (with associated density dependence) and provide better stage 1 environments for their offspring (habitat matching), how should female size influence optimal propagule size? To address this question, equation (12) becomes ds 2W dk 2W dE p2 1 dl sk dl sE dl
[( ) (
)]Z
2W . s 2
(23)
We have shown that 2W/s 2 1 0, ( 2W/sk)(dk/dl) 1 0, and ( 2W/sE)(dE/dl) ! 0. Thus, the sign of ds/dl in equation (23) will depend on the relative strength of density dependence versus habitat matching. If the influence of female size on habitat quality has a stronger effect on propagule size than does the influence of female size on density dependence, larger females should have larger propagules. If the converse is true, larger females should have smaller propagules.
Effects of Female Size on Optimal Egg Number How should egg number vary with female size? As defined above, optimal propagule number is a function of propagule size and total reproductive output, which are functions of female length (i.e., N[s(l ), E(l )]). Differentiating this relationship with respect to l yields dN N dE N ds p 1 . dl E dl s dl
(24)
If dN/dl is positive, larger females produce more propagules. If dN/dl is negative, larger females produce fewer propagules. Equation (24) can be specified more explicitly by substituting 1/s for N/E and 2E/s 2 for N/s (as above), yielding
N 1 dE ds p 2N . l s dl dl
(
)
(25)
Because 1/s 1 0 , N 1 0, and dE/dl 1 0, we can consider how propagule number should vary with female size in each of the above three scenarios by considering the sign of ds/dl in each. When greater total reproductive output of larger females has negative density-dependent effects on propagule survival, and larger females do not provide better stage 1 habitats, ds/dl ! 0 (“Effects of Female Size Acting through Total Reproductive Output”), and increasing female size should result in increased propagule number (dN/dl 1 0). When density-dependent effects are absent but larger females provide better habitats, ds/dl 1 0 (“Effects of Female Size Acting through Phenotype/Habitat Matching”), and the effect of female size on propagule number will depend on whether the effects of female size on propagule size acting through habitat quality are greater or less than the effects of female size on total reproductive output. If dE/dl 1 N(ds/dl), larger females should have more propagules, but if dE/dl ! N(ds/dl), larger females should have fewer propagules. Based on empirical data, we suspect the former inequality is more likely but that N(ds/dl) 1 0. If so, both propagule size and number should increase with increasing female size, but the increase should be less for propagule size than for propagule number. This situation would echo the third prediction of our specific model (fig. 3). When both density dependence and habitat matching occur, the sign of dN/dl will depend in complex ways on the strength of the various effects. A General Application Our general model can serve several purposes. First, it illustrates a conceptual framework useful for developing quantitative models that adopt specific functional relationships. Specific models can then be used to examine variation in propagule size and number for the organism in question. Our model for salmon provides an example. Second, the general model can be used to make broader predictions about patterns that might be expected for species with different types of life history or reproductive behavior. A fundamental prediction of our model that deviates from previous analyses is that positive correlations between propagule size and female size should evolve when larger females provide better habitats during a stage when large eggs would otherwise negatively influence offspring fitness (e.g., incubation of aquatic eggs). Conversely, a correlation should not arise in species where female size does not influence incubation habitat quality. We tested this prediction using data from freshwater fishes.
Optimal Size and Number of Propagules 397 Freshwater fishes exhibit a remarkable diversity in life history and reproductive behavior (Balon 1975). We restricted our analysis to a tractable subset of these species: freshwater fishes that occur in Canada (24 taxonomic families with 181 species; Scott and Crossman 1973). This particular subset was chosen because they are relatively well understood taxonomically and ecologically. Our first step was to group species into general reproductive behavior categories delineating a decreasing likelihood that female size could influence the quality of the egg incubation environment. Category 1 included fish where females construct nests, a situation where female size may positively influence the ability to acquire a high-quality nesting site, the quality of nest construction, or the success of nest defense (i.e., dk/dl 1 0). Category 2 included fish where males construct nests and females choose males or their nests. In this category, a positive correlation between egg size and female size might be expected when larger females mate with males that provide more oxygen to their eggs. This could occur when males compete for nest sites that vary in water flow or oxygen, or when males “fan” eggs (use their pectoral fins to create a flow of water). Category 3 included fish where males are territorial but do not generally construct nests or fan eggs, a situation where positive egg size/female size correlations should evolve only if larger females mate with males occupying better territories. Category 4 included fish where neither males nor females are overtly territorial and where eggs are broadcast (spread seemingly at random over the substrate or in the water column). Correlations between female size and egg size should be least common in this category because parental care (other than egg provisioning) is absent. Within each general category of reproductive behavior, we grouped species by taxonomic family because members of a given family often have similar reproductive behaviors. When reproductive behavior varied within a family, that family was accorded representation (with the relevant species) in each appropriate category. We next recorded, for each family, aspects of reproductive behavior, life history, and development that might influence the likelihood of adaptive correlations between egg size and female size. First, overall egg size may influence whether oxygen constraints during incubation have any relevance (egg size should have stronger effects on the probability of suffocation when eggs tend to be large). Second, the duration of the egg incubation period may influence the importance of oxygen limitation (shorter incubation periods should be less likely to cause problems). Third, the importance of oxygen limitation may be influenced by variation in spawning substrate type (sediment or vegetation), the nature of egg deposition (burial, attachment, demersal), and forms of paternal and maternal care.
Having established the above criteria for as many species as possible (starting with Scott and Crossman 1973, and then using other sources; see table 2 and list of references available from the author on request), we searched for published information on egg size/female size and egg number/ female size correlations within populations. Information was lacking for a number of the families when only Canadian species were considered, so the analysis was expanded to include congeners found elsewhere. To facilitate unbiased data collection, we searched the Aquatic Sciences and Fisheries Abstracts database (ASFA 1980–1999), using as keywords each genus name of Canadian freshwater fishes and “egg” or “ova” or “oocyte” or “fecundity” or “clutch” or “spawning.” We printed out all relevant abstracts and obtained all papers that could be found in the University of Massachusetts, Amherst, library system. Additional papers published earlier were obtained by scanning collected papers for appropriate references. We then searched all papers (or abstracts when the papers could not be obtained) for evidence of the correlations in question. Ideally, we would have reported log-log slopes for egg mass/female length and egg number/female length relationships, which would allow direct comparisons between traits and among species (as in table 1). Unfortunately, egg diameter is the most commonly used measure of egg size for nonsalmonid fishes, and log-log slopes based on egg diameter are not directly comparable to log-log slopes for egg number. Thus, we instead tallied for each species and population, egg size (diameter, circumference, volume, dry mass, wet mass) versus female size (length, mass) slopes as either significantly positive (POS), significantly negative (NEG), or nonsignificant (NS). In some cases, results varied among species, populations, studies, or years (see table 2). Nearly all egg number/female size slopes were significantly positive (see also Wootton 1979), so we only recorded quantitative egg number/female length (log-log) slope coefficients. We then calculated average egg number/female length slopes, by averaging all reported slopes within species and then within families. Egg number/female mass slopes are excluded because they are not directly comparable to slopes based on female length. Positive egg size/female size slopes should be most common for species with large eggs and long egg incubation periods, particularly salmonids (category 1, largest eggs, longest egg incubation period). Indeed, salmonids had the most common and strongest positive egg size/female size slopes (table 2). Based on our incomplete but unbiased survey of the vast literature for salmonids, we recorded positive egg size/female size slopes in 72 populations of 11 species (1172) and nonsignificant slopes in only 19 populations of five species (519). All but one of the 19 nonsignificant slopes were positive in direction, and all of these had small sample sizes. Also, average egg number/female
Table 2: Relationships between egg size (diameter, circumference, volume, mass) and female size (length, mass) and between egg number and female size for Canadian freshwater fishes and their congeners Spawning
GR VG GR
Egg traits
ES/FS slope POS
NS
NEG
EN/FL slope
mo d wk
3.0–7.0 3.0–4.0 .6–1.3
1172 13 24
519 0 223
0 0 0
1.81 (5125) 1 3.46 (119)
NO
wk
2.2–3.0
?
?
?
?
NO
d
3.5–4.0
22
0
12
1
NO
d–wk
1.5–2.8
11
11
0
1
NO
d–wk
1.2–1.7
49
29
0
1
NO
wk
1.0–1.5
11
0
0
2.38 (23)
NO
d–wk
1.0–2.0
11
0
0
1
NO
d
1.0–1.7
0
12
0
3.04 (12)
NO NO NO NO NO
NO NO NO NO NO
wk d wk d–wk d
2.5 1.2–4.0 1.5–2.0 1.1–1.8 .9–1.2
11 ? 22 34 0
0 ? 0 914 116
0 ? 0 0 0
1 1 1 1 1
NO NO NO NO NO NO NO NO NO NO NO NO NO NO NO NO
NO NO NO NO NO NO NO NO NO NO NO NO NO NO NO NO
mo wk d d wk d–wk wk d d wk d d d wk wk wk
1.8–3.7 4.0 2.5–3.5 2.1–3.2 1.4–3.5 1.3–3.5 1.2–3.0 .7–3.5 1.5–2.0 1.3–1.9 1.0–1.7 .8–1.5 .8–1.4 .5–1.8 .7–1.1 .6–1.2
11 ? 11 0 0 23 12 25 0 0 ? 68 0 ? 11 ?
33 ? 12 12 11 12 11 35 11 11 ? 614 12 ? 22 ?
0 ? 0 0 0 0 0 11 0 0 ? 22 0 ? 0 ?
3.32 (49) ? 1 3.82 (11) 3.43 (16) 2.83 (11) 1 2.87 (29) 1 3.03 (11) 1 2.34 (814) 1 1 1 ?
BR DM BR
NO DF, FN, GR CN
CN, DF CN, DF, FN, GR CN
VG, GR
DM
Ictaluridae (2)e
VG, CV
DM
Percidae (1)f
CV
AT
Gasterosteidae g
VG
DM
Cottidaeh
CV
AT
Cyprinidae (1)i
CV, GR
AT, BR
Centrarchidae j
VG, GR
DM
CN, DF, FN, GR CN, DF, FN CN, DF, FN CN, DF, FN, GR CN, DF, FN CN, DF, FN CN, DF, FN, GR
GR GR VG VG, GR CV
BR, DS DM, DS CL, DM AT, BR DM
GR N/A GR VG VG VG, GR GR GR VG GR N/A GR VG, GR GR VG, GR VG, GR
DM PL DM DM DM DM, BR DM DM DM DM PL DM DM DM? DM DM
Category 3: Coregonidaek Catostomidae (1)l Cyprinodontidaem Percidae (2)n Cyprinidae (2)o Category 4: Coregonidaep Hiodontidaeq Acipenseridaer Lepisosteidaes Esocidaet Percidae (3)u Catostomidae (2)v Clupeidaew Umbridaex Percopsidaey Sciaenidaez Cyprinidae (3)aa Percicichthyidaebb Gadidaecc Osmeridaedd Atherinidaeee
Strategy
mm
Female
Category 1: Salmonidaea Ictaluridae (1)b Petromyzontidaec Category 2: Amiidaed
Substrate
Types of parental care Male
Taxonomic family
Duration
Note: Category 1 p females construct nests, category 2 p males construct nests, category 3 p males are territorial but do not construct nests, category 4 p territoriality is minimal or absent and eggs are broadcast. “Spawning-substrate” types include rocks, gravel, sand, or silt (GR); vegetation (VG); cavity (CV); and not applicable (N/A). “Spawning-strategy” types include burial (BR), attachment (AT), demersal (DM), and pelagic (PL). “Types of parental care” include none (NO), nest construction (CN), nest defense (DF), fanning or cleaning of eggs (FN), and guarding of brood (GR). “Egg traits–duration” refers to the length of time embryos remain as eggs, grouped as 1–9 d (d), 9–35 d (wk), and 35 or more days (mo). “Egg traits–mm” refers to the range of egg diameters reported in the literature. “ES/FS slope” indicates instances of significantly positive (POS), significantly negative (NEG), or nonsignificant (NS) slopes between egg size and female size. Numbers in these columns indicate the number of species showing each type of slope, with the number of populations as a subscript. “EN/FL slope” provides average slopes of log-log relationships between egg number and female length as well as the number of species and populations (subscript) on which that average was based. In the absence of slope coefficients, the direction of the slope is indicated as positive (1) when data are available. In all columns a lack of appropriate data is indicated by “?”. Reproductive categories, spawning substrates and strategies, parental care, duration of the egg stage, and the range of egg size were determined for species in each taxonomic family using Breder and Rosen (1966), Scott and Crossman (1973), Balon (1975), Becker (1983), Potts and Wootton (1984), Bart and Page (1992), Johnston and Page (1992), and references specific to each species. The following notes provide information on egg size/female size (ES/FS) slopes reported in the literature as significantly positive (POS), significantly negative (NEG), or nonsignificant (NS). Each citation is for a single population unless otherwise noted. Egg number/female size slopes were almost invariably significant. Here we report only quantitative log egg number/log female length (EN/FL) slopes. a
Positive ES/FS relationships are nearly ubiquitous in salmon, trout, and charr. Heath and Blouw (1998) reviewed ES/FS relationships for an additional 20
populations (eight species, 17 studies), 18 of which were significantly positive. Other studies providing information on ES/FS and egg number/female size relationships include Quinn and Bloomberg (1992), Beacham and Murray (1993), Trippel (1993), Fleming (1996), Lobon-Cervia et al. (1997), Heath et al. (1999), Jonsson and Jonsson (1999), and Morita et al. (1999).
398
b
ES/FS slopes, Ictalurus nebulosus: POS within each of three Lake Erie tributaries (Lesko et al. 1996).
c
ES/FS slopes, Ichthyomyzon gagei: NS within 19 populations (Beamish et al. 1994); Lampetra aepyptera: POS in three populations and NS in four populations
(Docker and Beamish 1991); Petromyzon marinus: POS (Barker et al. 1998). EN/FL slopes, I. gagei: 3.46 (19 populations pooled; Beamish et al. 1994). d
No relevant data.
e
ES/FS slopes, Ictalurus punctatus: NEG in two populations (Broussard and Stickney 1981); Noturus gyrinus: POS (Mahon 1977); Noturus hildebrandi: POS
(Baker and Heins 1994). f
ES/FS slopes, Etheostoma nigrum: POS for one type of egg and NS for another type (Parrish et al. 1991).
g
ES/FS slopes, Gasterosteus aculeatus: POS (Fletcher and Wootton 1995), POS (Ali and Wootton 1999), POS in four populations and NS in eight populations
(Baker et al. 1998). Craig and Fitzgerald (1982) found POS slopes for G. aculeatus, Gasterosteus wheatlandi, and Pungitius pungitius and a NS ES/FS slope in Apeltes quadracus. Many other studies not reported here have also examined egg size, egg number, and female size in these species, particularly G. aculeatus. h
ES/FS slopes, Cottus gobio: POS (Marconato and Bisazza 1988). Interestingly, Marconato and Bisazza (1988) also found that larger males tend to have larger
eggs in their nests (r p 0.78), suggesting that larger females selected larger males. EN/FL slopes, Cottus cognatus: 2.36 (Foltz 1976); C. gobio: 2.57 and 2.24 (same population before and after impoundment; Crisp and Mann 1991). i
ES/FS slopes, Pimephales promelas: POS (Smith et al. 1978).
j
ES/FS slopes, Lepomis gibbosus: NS in two populations (Deacon and Keast 1987). EN/FL slopes, Pomoxis nigromaculatus: 3.23 (Barwick 1981); Lepomis
macrochirus: 2.84 (Panek and Cofield 1978). k
ES/FS slopes, Thymallus arcticus: POS (Skopets 1993).
l
No relevant data.
m
ES/FS slopes, Fundulus olivaceus and Fundulus euryzonus: POS (Blanchard 1996).
n
ES/FS slopes, Etheostoma caeruleum: NS in seven samples from one river (Heins et al. 1996), POS (Fuller 1998); Etheostoma zonale: POS in one population
and NS in two populations (Guill and Heins 1996), POS in one population and NS in two populations (Guill and Heins 2000); Etheostoma fonticola: NS (Schenck and Whiteside 1977); Etheostoma bellum: NS (Fisher 1990); Etheostoma spectabile: NS (Marsh 1984), NS (Hubbs et al. 1968); Etheostoma whipplei: POS in one population and NS in two populations (Heins and Machado 1993); Etheostoma lepidum: NS (Hubbs et al. 1968); Percina vigil: NS in four samples from one river (Heins and Baker 1989); Ammocrypta bifascia: NS (Heins 1985). o
ES/FS slopes, Notropis venustus (Cyprinella venusta): NS in 16 populations (Heins and Baker 1987).
p
ES/FS slopes, Coregonus lavaretus: POS in one lake and NS in one lake (Sinis and Petridis 1993); Coregonus sardinella: NS (Moulton et al. 1997); Coregonus
pidschian: NS (Moulton et al. 1997). EN/FL slopes, Coregonus clupeaformis: 3.05, 3.67, 4.53, 4.56, 3.99, and 3.39 (6 yr in Lesser Slave Lake, pooled slope p 3.18; Healey 1984), 2.29 (Healey 1984), and 2.34, 3.81, 3.60, and 5.15 (4 populations; Ihssen et al. 1981); C. sardinella: 5.47 (Moulton et al. 1997); C. pidschian: 1.25 (Moulton et al. 1997); Coregonus albula: 3.13 (Zawisza and Backiel 1970). q
No relevant data.
r
ES/FS slopes, Acipenser oxyrinchus: POS (Van Eenennaam and Doroshov 1998); Acipenser transmontanus: NS (Chapman et al. 1996), NS (Lutes et al. 1987).
s
ES/FS slopes, Lepisosteus osseus: NS in two populations (Johnson and Noltie 1997). EN/FL slopes, L. osseus: 3.82 (Netsch and Witt 1962).
t
ES/FS slopes, Esox lucius: NS (Wright and Shoesmith 1988). EN/FL slopes, E. lucius: 3.33 (two lakes pooled; Treasurer 1990), and 3.17-3.93, 3.49, 3.56, and
3.13-3.56 (other studies reviewed by Treasurer 1990). u
ES/FS slopes, Perca flavescens: POS (Clugston et al. 1978); Stizostedion vitreum: POS in one population and NS in two populations (Craig et al. 1995), POS
(Johnston 1997). EN/FL slopes, Perca fluviatilis: 2.83 (Treasurer 1981). v
ES/FS slopes, Catostomus commersoni: POS (Fuiman and Trojnar 1980), POS in one year and NS in another year (Johnston 1997).
w
ES/FS slopes, Dorosoma cepedianum: NS in two reservoirs (Michaletz 1998); Alosa pseudoharengus and Alosa aestivalis: POS in five populations, NEG in one
population, NS in three populations (Jessop 1993). EN/FL slopes, A. pseudoharengus: 3.48, 2.45, 2.54, 3.25, and 2.80 (pooled slope p 2.89; Jessop 1993); A. aestivalis: 3.52, 2.33, 2.28, and 3.84 (pooled slopes p 1.89 and 3.80; Jessop 1993). x
ES/FS slopes, Dallia pectoralis: NS (based on our interpretation of table 2 in Blackett 1962). Scott and Crossman (1973) indicate that this species does not
build nests or provide parental care, but males build nests and guard young in other members of the family (Becker 1983). y
ES/FS slopes, Percopsis omiscomaycus: NS (based on our interpretation of table 2 in Lawler 1954). EN/FL slopes, P. omiscomaycus: 3.03 (Magnuson and Smith
1963). z
No relevant data.
aa
ES/FS slopes, Notropis longirostris: NS (Heins and Clemmer 1976), POS in one population and NS in six populations (Heins 1991); Notropis sp.: POS (Heins
et al. 1980); Notropis umbratilis: NS (Matthews and Heins 1984); Notropis texanus: POS in one river and NS in another river (Heins and Rabito 1988); Notropis roseipinnis: NS (Heins and Bresnick 1975); Hybopsis sabinae: POS (Heins 1981), POS in two populations (Heins and Baker 1992); Hybopsis ammophilus: POS in one population and NEG in one population (Heins and Baker 1992); Hybopsis longirostris, POS in one population, NS in three populations (Heins and Baker 1992); Chrosomus (Phoxinus) erythrogaster: NEG (Settles and Hoyt 1978). EN/FL slopes, N. longirostris: 4.36 (Heins and Clemmer 1976) and 2.19, 2.66, 3.40, and 3.32 (four populations; Heins and Baker 1992); Notropis scepticus: 2.37 (Harrell and Cloutman 1978); N. umbratilis: 2.75 (Matthews and Heins 1984); H. sabinae: 3.37 and 3.18 (two populations; Heins and Baker 1992); H. ammophilus: 3.93 and 2.14 (two populations; Heins and Baker 1992); Rhinichthys cataractae: 2.83 (Brazo et al. 1978); Phoxinus phoxinus: 2.73 and 2.45 (same population before and after impoundment; Crisp and Mann 1991); Phoxinus eos: 1.91 (Das and Nelson 1990); Phoxinus neogaeus: 0.07 (Das and Nelson 1990). bb
ES/FS slopes, Morone saxatilis: NS in two rivers (Secor et al. 1992).
cc
No relevant data.
dd
ES/FS slopes, Spirinchus thaleichthys: POS in one year and NS in one year (Chigbu and Sibley 1994); Osmerus mordax: NS (Bailey 1964).
ee
No relevant data.
399
400 The American Naturalist length slopes were shallower in salmonids (1.81) than in all other taxonomic families (2.38–3.82; table 2). This result implies that egg size/female length slopes must be steepest in salmonids, assuming that their total reproductive effort/female length slopes are not appreciably lower. Largely because category 1 included salmonids, it also had the most frequent positive egg size/female size slopes (POS p 1479, NS p 742, NEG p 0). Positive correlations were next most common in category 2 species (POS p 914, NS p 412, NEG p 12) and least common in category 3 species (POS p 6 7, NS p 1030, NEG p 0) and category 4 species (POS p 14 21, NS p 22 36, NEG p 33). These comparisons are qualitative and should be subjected to more rigorous analysis when additional data become available (i.e., more log-log slopes for egg mass vs. female length and egg number vs. female length). Although the prediction of our general model was qualitatively supported, numerous exceptions call for explanation. Why, for instance, are some positive egg size/female size slopes found in species where eggs are broadcast? One possibility is that positive correlations are selectively reported. Many studies reported positive egg number/female size correlations and average egg sizes but did not mention whether egg size and female size were correlated. In many instances, the relationship was probably not reported owing to a lack of statistical significance. Thus, the positive correlations in category 4 species may reflect, in part, multiple hypothesis testing (i.e., across studies), where significant correlations are selectively reported. Another possibility is that aspects of reproductive behavior, life history, or development in certain species can generate significant slopes for reasons other than those examined by our model. These exceptions should be examined using species-specific models. Discussion We developed theoretical models of propagule size and number that allowed offspring survival/propagule size relationships to differ between discrete stages and that incorporated effects of maternal size on total reproductive output and offspring survival/propagule size relationships. A model specific to sockeye salmon predicted that optimal egg sizes should be larger in better incubation habitats, that larger females should produce more and larger eggs, that increasing female size should result in greater proportional increases in egg number than in egg size, and that females with greater relative egg production (i.e., for a given body size) should produce more but not larger eggs. A general model predicted that, when offspring fitness is negatively density dependent, larger females should produce smaller propagules; that, when larger females provide better habitats during a stage when large propagules would otherwise do poorly, larger females should produce
larger propagules; and that, when offspring fitness is density dependent and when larger females provide better habitats, the direction of the propagule size/female size relationship will depend on the relative strength of the two effects. Data from salmon populations confirmed the specific model’s predictions, and data from freshwater fishes confirmed the general model’s predictions. Optimal Egg Size and Number in Fish Our models emphasized organisms for which the implications and assumptions were particularly clear and justified: organisms that lay eggs in water, particularly fish. In aquatic environments, where egg survival is influenced by oxygen availability (Krogh 1959; Chapman 1988; Seymour and Bradford 1995; Lee and Strathmann 1998), offspring survival before hatching is expected to decrease with increasing egg size, whereas offspring survival after hatching is expected to increase with increasing egg size (fig. 1A). Offspring fitness will therefore be maximized at an intermediate egg size (i.e., a peaked offspring fitness/egg size function). In heterogeneous incubation environments, spatial variation in incubation habitat quality (e.g., oxygen availability) leads to variation in prehatching offspring survival for a given egg size (fig. 1B). As a result, optimal egg size from the offspring’s perspective (based on offspring fitness) varies among incubation habitats, with larger eggs favored in better habitats (fig. 2A). This result is the opposite of that found by other authors, whose models predict that optimal egg size should increase with decreasing habitat quality (e.g., McGinley et al. 1987; Morris 1987; Winkler and Wallin 1987; Hutchings 1991; Winemiller and Rose 1993). The reason for this difference is that our model included a stage during which large eggs are at a disadvantage in poor habitats. By incorporating this effect, our model may prove useful in explaining variation in egg size among populations that vary in incubation habitat quality (e.g., Quinn et al. 1995). Maternal fitness is the product of average offspring fitness and the number of propagules. Hence, optimal egg size from the mother’s perspective increases with increasing habitat quality (fig. 2B). However, the difference in optimal egg sizes among different habitats is less with respect to maternal fitness than with respect to offspring fitness (cf. fig. 2A, 2B). This difference arises because parents and offspring are in conflict as to the optimal investment strategy (Trivers 1974; reviewed by CluttonBrock 1991). From an offspring’s perspective, egg size should be optimized, but from a mother’s perspective, the trade-off between egg size and number should be optimized. The relative benefits of increasing egg size with increasing habitat quality are less for mothers than for offspring because an increase in egg size decreases egg
Optimal Size and Number of Propagules 401 number. Recent empirical evidence in salmon confirms that egg sizes are optimized with respect to maternal fitness (Einum and Fleming 2000a). When large females obtain or prepare better incubation environments for their eggs (“phenotype/habitat matching”), optimal egg sizes are larger for larger females (fig. 2C). This provides a mathematical formulation of suggestions by previous authors that larger salmonid females should have larger eggs because they provide better incubation environments (e.g., van den Berghe and Gross 1989; Fleming and Gross 1990; Quinn et al. 1995; Jonsson and Jonsson 1999). In exploring our specific model, we also found support for the argument of Holtby and Healey (1986) that, when habitat conditions are generally poor, large females can have lower fitness than small females (because large females have egg sizes farther from the optimum). Our results are also consistent with those of Sargent et al. (1987) in predicting that females providing better conditions for their incubating offspring (i.e., better parental care) should produce larger eggs. Owing to the stronger relationship between egg number and maternal fitness than between egg size and maternal fitness, our specific model predicted that egg number would increase more rapidly than egg size for a given increase in female size (fig. 3). Our general model showed the conditions under which a positive egg size/female size relationship should hold: weak or no density-dependent egg survival. Parker and Begon (1986) also presented models that provide predictions for optimal egg size and number in relation to maternal size. The combination of conditions in their models that were most likely to generate predictions similar to ours occurred “if sib competition and egg size are both important components of larval success” (Parker and Begon 1986, p. 579). In their model, egg number would increase more rapidly than egg size (with increasing female size) if intrinsic effects of egg size were less important than effects of competition (acting through negative density dependence). Females of a given size can vary in their relative egg production but this variation might not correlate with incubation habitat quality. Optimal egg size should therefore not vary among females with respect to their relative egg production (assuming no density dependence), and egg number should increase in direct proportion to relative egg production. It is at this juncture that our model departs in its predictions from Parker and Begon (1986, p. 578), wherein optimal egg size increases with increasing relative egg production (under sib competition). Empirical data indicated that our model’s predictions were more accurate than those of Parker and Begon (1986), at least for salmon. Winkler and Wallin (1987) addressed a similar question but from a different perspective, by asking how total reproductive effort should vary with effort per offspring. It
can be inferred from their model that variation in total reproductive effort should have no effect on optimal effort per offspring, as long as total effort does not influence minimal viable effort per offspring (smin in our specific model) or the rate at which juvenile survival increases with increasing effort per offspring (a in our model). Under these conditions, our model is consistent with Winkler and Wallin (1987). The predictions we generated and tested were based mainly on variation within populations and species. However, many of the empirical trends found within species are similar to those found among species. For example, larger fishes have greater total egg production, more eggs (strongly so), larger eggs (weakly so), and a very strong trade-off between egg size and number (Duarte and Alcaraz 1989; Elgar 1990; Winemiller and Rose 1992; Visman et al. 1996). The utility of our model in explaining these patterns within species suggests that a similar analytical framework may be useful for addressing interspecific variation. At even higher levels, the surface-to-volume constraint placed on aquatic eggs may explain why fishes tend to have small but numerous eggs relative to other vertebrates. Further Applications and Extensions The partitioning of fitness into discrete stages is obviously appropriate for the group of organisms on which we focused: fish that lay eggs. Oxygen limitation has also been implicated in the evolution of egg size and number in amphibians (Seymour and Bradford 1995) and aquatic invertebrates (Lee and Strathmann 1998). Partitioning fitness effects of propagule size into discrete stages is also appropriate for many terrestrial organisms. For example, offspring size may be constrained by the amount of nourishment parents can provide (a larger growing embryo requires more energy) or by the size of the pelvic canal through which the egg or neonate must pass (Roff 1992, pp. 352–356; Strathmann 1995; Bernado 1996). For example, large size at birth is often adaptive for juvenile lizards but egg size is constrained by the size of the pelvic girdle (Sinervo and Licht 1991; Sinervo and Doughty 1996). Another possible situation where discrete stages may be particularly relevant is in annual desert plants, where survival during the long pregermination period may be negatively correlated with seed size (large seeds may be more attractive to predators), whereas postgermination success may be positively influenced by seed size (Donohue and Schmitt 1998). Other examples where offspring survival is negatively correlated with propagule size are discussed by Kaplan (1998). We emphasized the novel predictions of our models by focusing on variation in the quality of the prehatching (stage 1) habitat, where better conditions select for larger prop-
402 The American Naturalist agules. In many cases, however, habitat quality will also vary during posthatching (stage 2) phases, where better conditions select for smaller propagules. For example, variation in posthatching conditions has been invoked to explain differences in egg size among salmon populations (Tamate and Maekawa 2000) and between pelagic and demersal fishes (Duarte and Alcaraz 1989). Our model could be extended to consider the effects of variation in habitat quality and maternal condition during two or more stages. When predicting absolute variation in propagule size at some levels (e.g., between species), it will also be important to consider the length of time in each stage (e.g., Shine 1978; Sargent et al. 1987). This is because selection during longer stages will often have stronger effects on offspring fitness, and therefore on the evolution of propagule size. Allowance for maternal effects influencing both total reproductive output (e.g., total mass of propagules released) and offspring survival/propagule size relationships should also be widely applicable. Certainly, correlations between reproductive output and body size are common within and among many taxa (e.g., Visman et al. 1996). The size of females has the potential to influence characteristics of the offspring’s environment in many ways. In the propagule size/pelvic canal size constraint scenario, larger females have larger pelvic canals and so their optimal egg or neonate size may be larger. As other examples, maternal traits may correlate with characteristics of the nesting or oviposition environment (e.g., Roosenburg 1996) or with the traits of mates (e.g., size-assortative mating; Crespi 1989). Another maternal effect that may influence both reproductive output and the quality of the offspring’s environment is breeding date. For example, clutch size in birds decreases during the breeding season, and chicks hatching late experience poorer conditions (Price 1998). Consideration of maternal effects (e.g., size or timing) may help provide a general explanation for variation in the direction and strength of propagule size/ female size relationships among species and perhaps even higher taxa. Optimality models of propagule size and number have been criticized because some feel they cannot “explain widespread, multivariate correlations between maternal characteristics and clutch parameters, namely the positive phenotypic covariances of maternal age, size, fecundity, and per-propagule investment found in many organisms” (Bernado 1996, p. 216). In contrast to this assertion, our specific optimality model performed admirably in explaining covariation among maternal size, egg production, egg size, and egg number. A key to our success was incorporating realistic effects of maternal size on the quality of the incubation environment for eggs. Although optimality models should be considered tentative hypotheses that must withstand empirical testing, a combination of theoretical and empirical approaches forces us to be explicit about our as-
sumptions, and allows us to make specific predictions that can be tested directly. Acknowledgments Unpublished data for salmon populations were provided by I. Fleming, T. Quinn, and L. Wetzel. The manuscript was improved through comments by S. Einum, I. Fleming, M. Hendry, T. Johnston, J. Kenagy, M. Kinnison, M. McPeek, A. Poon, S. Proulx, T. Quinn, and two anonymous reviewers. A.P.H. was supported by a Natural Sciences and Engineering Research Council of Canada postdoctoral fellowship and a Darwin postdoctoral fellowship (University of Massachusetts, Amherst). Literature Cited Ali, M., and R. J. Wootton. 1999. Effect of variable food levels on reproductive performance of breeding female three-spined sticklebacks. Journal of Fish Biology 55: 1040–1053. ASFA (Aquatic Sciences and Fisheries Abstracts). 1980– 1999. Database. Cambridge Scientific Abstracts, Bethesda. http://www.csa.com. Bagenal, T. B. 1969. Relationship between egg size and fry survival in brown trout Salmo trutta L. Journal of Fish Biology 1:349–353. Bailey, M. M. 1964. Age, growth, maturity, and sex composition of the American smelt, Osmerus mordax (Mitchill), of western Lake Superior. Transactions of the American Fisheries Society 93:382–395. Baker, J. A., and D. C. Heins. 1994. Reproductive life history of the North American madtom catfish, Noturus hildebrandi (Bailey and Taylor 1950), with a review of data for the genus. Ecology of Freshwater Fishes 3: 167–175. Baker, J. A., S. A. Foster, D. C. Heins, M. A. Bell, and R. W. King. 1998. Variation in female life-history traits among Alaskan populations of the threespine stickleback, Gasterosteus aculeatus L. (Pisces: Gasterosteidae). Biological Journal of the Linnean Society of London 63: 141–159. Balon, E. K. 1975. Reproductive guilds of fish: a proposal and definition. Journal of the Fisheries Research Board of Canada 32:821–864. Barker, L. A., B. J. Morrison, B. J. Wicks, and F. W. H. Beamish. 1998. Potential fecundity of landlocked sea lamprey larvae, Petromyzon marinus, with typical and atypical gonads. Copeia 1998:1070–1075. Bart, H. L., Jr., and L. M. Page. 1992. The influence of size and phylogeny on life history variation in North American percids. Pages 553–572 in R. L. Mayden, ed. Systematics, historical ecology, and North American
Optimal Size and Number of Propagules 403 freshwater fishes. Stanford University Press, Stanford, Calif. Barwick, D. H. 1981. Fecundity of the black crappie in a reservoir receiving heated effluent. Progressive FishCulturist 43:153–154. Beacham, T. D., and C. B. Murray. 1993. Fecundity and egg size variation in North American Pacific salmon (Oncorhynchus). Journal of Fish Biology 42:485–508. Beamish, F. W. H., P. K. Ott, and S. L. Roe. 1994. Interpopulational variation in fecundity and egg size in southern brook lamprey, Ichthyomyzon gagei. Copeia 1994:718–725. Becker, G. C. 1983. Fishes of Wisconsin. University of Wisconsin Press, Madison. Bernardo, J. 1996. The particular maternal effect of propagule size, especially egg size: patterns, models, quality of evidence and interpretations. American Zoologist 36: 216–236. Blackett, R. F. 1962. Some phases in the life history of the Alaskan blackfish, Dallia pectoralis. Copeia 1962:124–130. Blanchard, T. A. 1996. Ovarian cycles and microhabitat use in two species of topminnow, Fundulus olivaceus and F. euryzonus, from the southeastern United States. Environmental Biology of Fishes 47:155–163. Brazo, D. C., C. R. Liston, and R. C. Anderson. 1978. Life history of the longnose dace, Rhinichthys cataractae, in the surge zone of eastern Lake Michigan near Ludington, Michigan. Transactions of the American Fisheries Society 107:550–556. Breder, C. M., Jr., and D. E. Rosen. 1966. Modes of reproduction in fishes. Natural History Press, New York. Broussard, M. C., Jr., and R. R. Stickney. 1981. Evaluation of reproductive characters for four strains of channel catfish. Transactions of the American Fisheries Society 110:502–506. Burgner, R. L. 1991. Life history of sockeye salmon (Oncorhynchus nerka). Pages 3–117 in C. Groot and L. Margolis, eds. Pacific salmon life histories. University of British Columbia Press, Vancouver. Chapman, D. W. 1988. Critical review of variables used to define effects of fines in redds of large salmonids. Transactions of the American Fisheries Society 117:1–21. Chapman, F. A., J. P. Van Eenennaam, and S. I. Doroshov. 1996. The reproductive condition of white sturgeon, Acipenser transmontanus, in San Francisco Bay, California. Fishery Bulletin 94:628–634. Chigbu, P., and T. H. Sibley. 1994. Relationship between abundance, growth, egg size and fecundity in a landlocked population of longfin smelt, Spirinchus thaleichthys. Journal of Fish Biology 45:1–15. Clugston, J. P., J. L. Oliver, and R. Ruelle. 1978. Reproduction, growth, and standing crops of yellow perch in
southern reservoirs. American Fisheries Society Special Publication 11:89–99. Clutton-Brock, T. H. 1991. The evolution of parental care. Princeton University Press, Princeton, N.J. Craig, D., and G. J. FitzGerald. 1982. Reproductive tactics of four sympatric sticklebacks (Gasterosteidae). Environmental Biology of Fishes 7:369–375. Craig, J. F., J. A. Babaluk, S. G. Stevenson, and P. C. Williams. 1995. Variation in growth and reproduction of walleye (Stizostedion vitreum) in three Manitoba lakes. Canadian Journal of Fisheries and Aquatic Sciences 73: 367–372. Crespi, B. J. 1989. Causes of assortative mating in arthropods. Animal Behaviour 38:980–1000. Crisp, D. T., and R. H. K. Mann. 1991. Effects of impoundment on populations of bullhead Cottus gobio L. and minnow, Phoxinus phoxinus (L.), in the basin of Cow Green Reservoir. Journal of Fish Biology 38:731–740. Das, M. K., and J. S. Nelson. 1990. Spawning time and fecundity of northern redbelly dace, Phoxinus eos, finescale dace, Phoxinus neogaeus, and their hybrids in Upper Pierre Grey Lake, Alberta. Canadian Field-Naturalist 104: 409–413. Deacon, L. I., and J. A. Keast. 1987. Patterns of reproduction in two populations of pumpkinseed sunfish, Lepomis gibbosus, with differing food resources. Environmental Biology of Fishes 19:281–296. Dill, L. M., and T. G. Northcote. 1970. Effects of some environmental factors on survival, condition, and timing of emergence of chum salmon fry (Oncorhynchus keta). Journal of the Fisheries Research Board of Canada 27:196–201. Docker, M. F., and F. W. H. Beamish. 1991. Growth, fecundity, and egg size of least brook lamprey, Lampetra aepyptera. Environmental Biology of Fishes 31:219–227. Donohue, K., and J. Schmitt. 1998. Maternal environmental effects in plants: adaptive plasticity? Pages 137–158 in T. A. Mousseau and C. W. Fox, eds. Maternal effects as adaptations. Oxford University Press, Oxford. Duarte, C. M., and M. Alcaraz. 1989. To produce many small or few large eggs: a size-independent reproductive tactic of fish. Oecologia (Berlin) 80:401–404. Einum, S., and I. A. Fleming. 1999. Maternal effects of egg size in brown trout (Salmo trutta): norms of reaction to environmental quality. Proceedings of the Royal Society of London B, Biological Sciences 266:2095–2100. ———. 2000a. Highly fecund mothers sacrifice offspring survival to maximize fitness. Nature (London) 405: 565–567. ———. 2000b. Selection against late emergence and small offspring in Atlantic salmon (Salmo salar). Evolution 54:628–639. Elgar, M. A. 1990. Evolutionary compromise between a
404 The American Naturalist few large and many small eggs: comparative evidence in teleost fish. Oikos 59:283–287. Fast, D. E. 1987. The behavior of salmonid alevins in response to changes in dissolved oxygen, velocity and light during incubation. Ph.D. diss. University of Washington, Seattle. Fisher, W. L. 1990. Life history and ecology of the orangefin darter Etheostoma bellum (Pisces: Percidae). American Midland Naturalist 123:268–281. Fleming, I. A. 1996. Reproductive strategies of Atlantic salmon: ecology and evolution. Reviews in Fish Biology and Fisheries 6:379–416. Fleming, I. A., and M. R. Gross. 1990. Latitudinal clines: a trade-off between egg number and size in Pacific salmon. Ecology 71:1–11. ———. 1994. Breeding competition in a Pacific salmon (coho: Oncorhynchus kisutch): measures of natural and sexual selection. Evolution 48:637–657. Fletcher, D. A., and R. J. Wootton. 1995. A hierarchical response to differences in ration size in the reproductive performance of female three-spined sticklebacks. Journal of Fish Biology 46:657–668. Foltz, J. W. 1976. Fecundity of the slimy sculpin, Cottus cognatus, in Lake Michigan. Copeia 1976:802–804. Foote, C. J. 1990. An experimental comparison of male and female spawning territoriality in a Pacific salmon. Behaviour 115:283–314. Fuiman, L. R., and J. R. Trojnar. 1980. Factors affecting egg diameter of white suckers (Catostomus commersoni). Copeia 1980:699–704. Fuller, R. C. 1998. Fecundity estimates for rainbow darters, Etheostoma caeruleum, in southwestern Michigan. Ohio Journal of Science 98:2–5. Guill, J. M., and D. C. Heins. 1996. Clutch and egg size variation in the banded darter, Etheostoma zonale, from three sites in Arkansas. Environmental Biology of Fishes 46:409–413. ———. 2000. Interannual variation in clutch and egg size of the banded darter, Etheostoma zonale. Copeia 2000: 230–233. Harrell, R. D., and D. G. Cloutman. 1978. Distribution and life history of the sandbar shiner, Notropis scepticus (Pisces: Cyprinidae). Copeia 1978:443–447. Healey, M. C. 1984. Variation in fecundity of lake whitefish (Coregonus clupeaformis) from Lesser Slave and Utikuma lakes in northern Alberta. Copeia 1984:238–242. Healey, M. C., and W. R. Heard. 1984. Inter- and intrapopulation variation in the fecundity of chinook salmon (Oncorhynchus tshawytscha) and its relevance to life history theory. Canadian Journal of Fisheries and Aquatic Sciences 41:476–483. Heath, D. D., and D. M. Blouw. 1998. Are maternal effects in fish adaptive or merely physiological side effects?
Pages 178–201 in T. A. Mousseau and C. W. Fox, eds. Maternal effects as adaptations. Oxford University Press, Oxford. Heath, D. D., C. W. Fox, and J. W. Heath. 1999. Maternal effects on offspring size: variation through early development of chinook salmon. Evolution 53:1605–1611. Heins, D. C. 1981. Life history pattern of Notropis sabinae (Pisces: Cyprinidae) in the lower Sabine River drainage of Louisiana and Texas. Tulane Studies in Zoology and Botany 22:67–85. ———. 1985. Life history traits of the Florida sand darter Ammocrypta bifascia and comparisons with the naked sand darter Ammocrypta beani. American Midland Naturalist 113:209–216. ———. 1991. Variation in reproductive investment among populations of the longnose shiner, Notropis longirostris, from contrasting environments. Copeia 1991:736–744. Heins, D. C., and J. A. Baker. 1987. Analysis of factors associated with intraspecific variation in propagule size of a stream-dwelling fish. Pages 223–231 in D. C. Heins and J. A. Baker, eds. Community and evolutionary ecology of North American stream fishes. University of Oklahoma Press, London. ———. 1989. Growth, population structure, and reproduction of the percid fish Percina vigil. Copeia 1989: 727–736. ———. 1992. Historical and recent influences on reproduction in North American stream fishes. Pages 573–599 in R. L. Mayden, ed. Systematics, historical ecology, and North American freshwater fishes. Stanford University Press, Stanford, Calif. Heins, D. C., and G. I. Bresnick. 1975. The ecological life history of the cherryfin shiner, Notropis roseipinnis. Transactions of the American Fisheries Society 104: 516–523. Heins, D. C., and G. H. Clemmer. 1976. The reproductive biology, age and growth of the North American cyprinid, Notropis longirostris (Hay). Journal of Fish Biology 8:365–379. Heins, D. C., and M. D. Machado. 1993. Spawning season, clutch characteristics, sexual dimorphism and sex ratio in the redfin darter Etheostoma whipplei. American Midland Naturalist 129:161–171. Heins, D. C., and F. G. Rabito, Jr. 1988. Reproductive traits in populations of the weed shiner, Notropis texanus, from the Gulf Coastal Plain. Southwestern Naturalist 33:147–156. Heins, D. C., G. E. Gunning, and J. D. Williams. 1980. Reproduction and population structure of an undescribed species of Notropis (Pisces: Cyprinidae) from the Mobile Bay drainage, Alabama. Copeia 1980:822–830. Heins, D. C., J. A. Baker, and D. J. Tylicki. 1996. Reproductive season, clutch size, and egg size of the rainbow
Optimal Size and Number of Propagules 405 darter, Etheostoma caeruleum, from the Homochitto River, Mississippi, with an evaluation of data from the literature. Copeia 1996:1005–1010. Hendry, A. P. 1998. Reproductive energetics of Pacific salmon: strategies, tactics, and trade-offs. Ph.D. diss. University of Washington, Seattle. Hendry, A. P., and O. K. Berg. 1999. Secondary sexual characters, energy use, senescence, and the cost of reproduction in sockeye salmon. Canadian Journal of Zoology 77:1663–1675. Hendry, A. P., and T. P. Quinn. 1997. Variation in adult life history and morphology among Lake Washington sockeye salmon (Oncorhynchus nerka) populations in relation to habitat features and ancestral affinities. Canadian Journal of Fisheries and Aquatic Sciences 54: 75–84. Hendry, A. P., F. E. Leonetti, and T. P. Quinn. 1995. Spatial and temporal isolating mechanisms: the formation of discrete breeding aggregations of sockeye salmon (Oncorhynchus nerka). Canadian Journal of Zoology 73: 339–352. Hendry, A. P., J. E. Hensleigh, and R. R. Reisenbichler. 1998. Incubation temperature, developmental biology, and the divergence of sockeye salmon (Oncorhynchus nerka) within Lake Washington. Canadian Journal of Fisheries and Aquatic Sciences 55:1387–1394. Hendry, A. P., O. K. Berg, and T. P. Quinn. 1999. Condition dependence and adaptation-by-time: breeding date, life history, and energy allocation within a population of salmon. Oikos 85:499–514. Holtby, L. B., and M. C. Healey. 1986. Selection for adult size in female coho salmon (Oncorhynchus kisutch). Canadian Journal of Fisheries and Aquatic Sciences 43: 1946–1959. Hubbs, C., M. M. Stevenson, and A. E. Peden. 1968. Fecundity and egg size in two central Texas darter populations. Southwestern Naturalist 13:301–324. Hutchings, J. A. 1991. Fitness consequences of variation in egg size and food abundance in brook trout Salvelinus fontinalis. Evolution 45:1162–1168. Ihssen, P. E., D. O. Evans, W. J. Christie, J. A. Reckahn, and R. L. DesJardine. 1981. Life history, morphology, and electrophoretic characteristics of five allopatric stocks of lake whitefish (Coregonus clupeaformis) in the Great Lake Region. Canadian Journal of Fisheries and Aquatic Sciences 38:1790–1807. Jessop, B. M. 1993. Fecundity of anadromous alewives and blueback herring in New Brunswick and Nova Scotia. Transactions of the American Fisheries Society 122:85–98. Johnson, B. L., and D. B. Noltie. 1997. Demography, growth, and reproductive allocation in stream-spawning longnose gar. Transactions of the American Fisheries Society 126:438–466.
Johnston, C. E., and L. M. Page. 1992. The evolution of complex reproductive strategies in North American minnows (Cyprinidae). Pages 600–621 in R. L. Mayden, ed. Systematics, historical ecology, and North American freshwater fishes. Stanford University Press, Stanford, Calif. Johnston, T. A. 1997. Within-population variability in egg characteristics of walleye (Stizostedion vitreum) and white sucker (Catostomus commersoni). Canadian Journal of Fisheries and Aquatic Sciences 54:1006–1014. Jonsson, N., and B. Jonsson. 1999. Trade-off between egg mass and egg number in brown trout. Journal of Fish Biology 55:767–783. Kaplan, R. H. 1998. Maternal effects, developmental plasticity, and life history evolution: an amphibian model. Pages 244–260 in T. A. Mousseau and C. W. Fox, eds. Maternal effects as adaptations. Oxford University Press, Oxford. Krogh, A. 1959. The comparative physiology of respiratory mechanisms. University of Pennsylvania Press, Philadelphia. L’Abe´e-Lund, J. H., and K. Hindar. 1990. Interpopulation variation in reproductive traits of anadromous female brown trout, Salmo trutta L. Journal of Fish Biology 37: 755–763. Lack, D. 1947. The significance of clutch-size. Ibis 89: 302–352. Lawler, G. H. 1954. Observations on the trout-perch Percopsis omiscomaycus (Walbaum), at Heming Lake, Manitoba. Journal of the Fisheries Research Board of Canada 11:1–4. Lee, C. E., and R. R. Strathmann. 1998. Scaling of gelatinous clutches: effects of siblings’ competition for oxygen on clutch size and parental investment per offspring. American Naturalist 151:293–310. Lesko, L. T., S. B. Smith, and M. A. Blouin. 1996. The effect of contaminated sediments on the fecundity of the brown bullhead in three Lake Erie tributaries. Journal of Great Lakes Research 22:830–837. Linley, T. J. 1993. Patterns of life history variation among sockeye salmon (Oncorhynchus nerka) in the Fraser River, British Columbia. Ph.D. diss. University of Washington, Seattle. Lloyd, D. G. 1987. Selection of offspring size at independence and other size-versus-number strategies. American Naturalist 129:800–817. Lobon-Cervia, J., C. G. Utrilla, P. A. Rico´n, and F. Amezcua. 1997. Environmentally induced spatio-temporal variations in the fecundity of brown trout Salmo trutta L.: trade-offs between egg size and number. Freshwater Biology 38:277–288. Lutes, P. B., S. I. Doroshov, F. Chapman, J. Harrah, R. Fitzgerald, and M. Fitzpatrick. 1987. Morpho-physio-
406 The American Naturalist logical predictors of ovulatory success in white sturgeon, Acipenser transmontanus Richardson. Aquaculture 66: 43–52. Magnuson, J. J., and L. L. Smith, Jr. 1963. Some phases of the life history of the trout-perch. Ecology 44:83–95. Mahon, R. 1977. Age and fecundity of the tadpole madtom, Noturus gyrinus, on Long Point, Lake Erie. Canadian Field-Naturalist 91:292–294. Manzer, J. I., and I. Miki. 1986. Fecundity and egg retention of some sockeye salmon (Oncorhynchus nerka) stocks in British Columbia. Canadian Journal of Fisheries and Aquatic Sciences 43:1643–1655. Marconato, A., and A. Bisazza. 1988. Mate choice, egg cannibalism and reproductive success in the river bullhead, Cottus gobio L. Journal of Fish Biology 33:905–916. Marsh, E. 1984. Egg size variation in central Texas populations of Etheostoma spectabile (Pisces: Percidae). Copeia 1984:291–301. Mathisen, O. A., and T. Gunnerød. 1969. Variance components in the estimation of potential egg deposition of sockeye salmon escapements. Journal of the Fisheries Research Board of Canada 26:655–670. Matthews, M. M., and D. C. Heins. 1984. Life history of the redfin shiner, Notropis umbratilis (Pisces: Cyprinidae), in Mississippi. Copeia 1984:385–390. McGinley, M. A., D. H. Temme, and M. A. Geber. 1987. Parental investment in offspring in variable environments: theoretical and empirical considerations. American Naturalist 130:370–398. McGurk, M. D. 2000. Comparison of fecundity-lengthlatitude relationships between nonanadromous (kokanee) and anadromous sockeye salmon (Oncorhynchus nerka). Canadian Journal of Zoology 78:1791–1805. Michaletz, P. H. 1998. Effect of body size on fecundity, the gonadosomatic index, egg size, and timing of spawning of gizzard shad. Journal of Freshwater Ecology 13: 307–315. Morita, K., S. Yamamoto, Y. Takashima, T. Matsuishi, Y. Kanno, and K. Nishimura. 1999. Effect of maternal growth history on egg number and size in wild whitespotted char (Salvelinus leucomaenis). Canadian Journal of Fisheries and Aquatic Sciences 56:1585–1589. Morris, D. W. 1987. Optimal allocation of parental investment. Oikos 49:332–339. ———. 1998. State-dependent optimization of litter size. Oikos 83:518–528. Moulton, L. L., L. M. Philo, and J. C. George. 1997. Some reproductive characteristics of least ciscoes and humpback whitefish in Dease Inlet, Alaska. American Fisheries Society Symposium 19:119–126. Netsch, Lt. N. F., and A. Witt, Jr. 1962. Contributions to the life history of the longnose gar, (Lepisosteus osseus)
in Missouri. Transactions of the American Fisheries Society 91:251–262. Panek, F. M., and C. R. Cofield. 1978. Fecundity of bluegill and warmouth from a South Carolina blackwater lake. Progressive Fish-Culturist 40:67–68. Parker, G. A., and M. Begon. 1986. Optimal egg size and clutch size: effects of environment and maternal phenotype. American Naturalist 128:573–592. Parrish, J. D., D. C. Heins, and J. A. Baker. 1991. Reproductive season, clutch parameters and oocyte size of the johnny darter Etheostoma nigrum from southwestern Mississippi. American Midland Naturalist 125:180–186. Potts, G. W., and R. J. Wootton, eds. 1984. Fish reproduction: strategies and tactics. Academic Press, New York. Price, T. 1998. Maternal and paternal effects in birds: effects on offspring fitness. Pages 202–226 in T. A. Mousseau and C. W. Fox, eds. Maternal effects as adaptations. Oxford University Press, Oxford. Quinn, T. P., and S. Bloomberg. 1992. Fecundity of chinook salmon (Oncorhynchus tshawytscha) from the Waitaki and Rakaia Rivers, New Zealand. New Zealand Journal of Marine and Freshwater Research 26:429–434. Quinn, T. P., and C. J. Foote. 1994. The effects of body size and sexual dimorphism on the reproductive behaviour of sockeye salmon, Oncorhynchus nerka. Animal Behaviour 48:751–761. Quinn, T. P., A. P. Hendry, and L. A. Wetzel. 1995. The influence of life history trade-offs and the size of incubation gravels on egg size variation in sockeye salmon (Oncorhynchus nerka). Oikos 74:425–438. Quinn, T. P., M. D. Adkison, and M. B. Ward. 1996. Behavioral tactics of male sockeye salmon (Oncorhynchus nerka) under varying operational sex ratios. Ethology 102:304–322. Roff, D. A. 1992. The evolution of life histories. Chapman & Hall, New York. Rombough, P. J., and B. M. Moroz. 1990. The scaling and potential importance of cutaneous and branchial surfaces in respiratory gas exchange in young chinook salmon (Oncorhynchus tshawytscha). Journal of Experimental Biology 154:1–12. Roosenburg, W. M. 1996. Maternal condition and nest site choice: an alternative for the maintenance of environmental sex determination? American Zoologist 36: 15–168. Sargent, R. C., P. D. Taylor, and M. R. Gross. 1987. Parental care and the evolution of egg size in fishes. American Naturalist 129:32–46. Schenck, J. R., and B. G. Whiteside. 1977. Reproduction, fecundity, sexual dimorphism and sex ratio of Etheostoma fonticola (Osteichthyes: Pecidae). American Midland Naturalist 98:365–375.
Optimal Size and Number of Propagules 407 Scott, W. B., and E. J. Crossman. 1973. Freshwater fishes of Canada. Fisheries Research Board of Canada Bulletin no. 184. Ottawa. Secor, D. H., J. M. Dean, T. A. Curtis, and F. W. Sessions. 1992. Effect of female size and propagation methods on larval production at a South Carolina striped bass (Morone saxatilis) hatchery. Canadian Journal of Fisheries and Aquatic Sciences 49:1778–1787. Settles, W. H., and R. D. Hoyt. 1978. The reproductive biology of the southern redbelly dace, Chrosomus erythrogaster Rafinesque, in a spring-fed stream in Kentucky. American Midland Naturalist 99:290–298. Seymour, R. S., and D. F. Bradford. 1995. Respiration of amphibian eggs. Physiological Zoology 68:1–25. Shine, R. 1978. Propagule size and parental care: the “safe harbor” hypothesis. Journal of Theoretical Biology 75: 417–424. Sinervo, B., and P. Doughty. 1996. Interactive effects of offspring size and timing of reproduction on offspring reproduction: experimental, maternal, and quantitative genetic aspects. Evolution 50:1314–1327. Sinervo, B., and P. Licht. 1991. Proximate constraints on the evolution of egg size, number, and total clutch mass in lizards. Science (Washington, D.C.) 252:1300–1302. Sinis, A., and D. Petridis. 1993. Population structure and reproductive strategy of the whitefish Coregonus lavaretus (L.) in two Greek lakes. Archiv fu¨r Hydrobiologie 128:483–497. Skopets, M. B. 1993. Biological characteristics of arctic grayling in northeastern Asia. Journal of Ichthyology 33:89–99. Smith, C. C., and S. D. Fretwell. 1974. The optimal balance between size and number of offspring. American Naturalist 108:499–506. Smith, H. T., C. B. Schreck, and O. E. Maughan. 1978. Effect of population density and feeding rate on the fathead minnow (Pimephales promelas). Journal of Fish Biology 12:449–455. Stearns, S. C. 1992. The evolution of life histories. Oxford University Press, Oxford. Strathmann, R. R. 1995. Peculiar constraints on life histories imposed by protective or nutritive devices for embryos. American Zoologist 35:426–433. Tamate, T., and K. Maekawa. 2000. Interpopulation variation in reproductive traits of female masu salmon, Oncorhynchus masou. Oikos 90:209–218. Treasurer, J. W. 1981. Some aspects of the reproductive biology of perch Perca fluviatilis L. Fecundity, maturation and spawning behaviour. Journal of Fish Biology 18:729–740.
———. 1990. The annual reproductive cycle of pike, Esox luciusL., in two Scottish lakes. Journal of Fish Biology 36:29–46. Trippel, E. A. 1993. Relations of fecundity, maturation, and body size of lake trout, and implications for management in northwestern Ontario Lakes. North American Journal of Fisheries Management 13:64–72. Trivers, R. L. 1974. Parent-offspring conflict. American Zoologist 14:249–264. van den Berghe, E. P., and M. R. Gross. 1989. Natural selection resulting from female breeding competition in a Pacific salmon (coho: Oncorhynchus kisutch). Evolution 43:125–140. Van Eenennaam, J. P., and S. I. Doroshov. 1998. Effects of age and body size on gonadal development of Atlantic sturgeon. Journal of Fish Biology 53:624–637. Visman, V., S. Pesant, J. Dion, B. Shipley, and R. H. Peters. 1996. Joint effects of maternal and offspring sizes on clutch mass and fecundity in plants and animals. Ecoscience 3:173–182. Wetzel, L. A. 1993. Genetic, morphometric and life history characteristics of sockeye salmon (Oncorhynchus nerka) in the Wood River Lake system, Bristol Bay, Alaska. Master’s thesis. University of Washington. Winemiller, K. O., and K. A. Rose. 1992. Patterns of lifehistory diversification in North American fishes: implications for population regulation. Canadian Journal of Fisheries and Aquatic Sciences 49:2196–2218. ———. 1993. Why do most fish produce so many tiny offspring? American Naturalist 142:585–603. Winkler, D. W., and K. Wallin. 1987. Offspring size and number: a life history model linking effort per offspring and total effort. American Naturalist 129:708–720. Wootton, R. J. 1979. Energy costs of egg production and environmental determinants of fecundity in teleost fishes. Symposium of the Zoological Society of London 44:133–159. Wright, R. M., and E. A. Shoesmith. 1988. The reproductive success of pike, Esox lucius: aspects of fecundity, egg density, and survival. Journal of Fish Biology 33: 623. Zawisza, J., and T. Backiel. 1970. Gonad development, fecundity and egg survival in Coregonus albus L. Pages 363–397 in C. C. Lindsey and C. S. Woods, eds. Biology of coregonid fishes. University of Manitoba Press, Winnipeg.
Associate Editor: Mark A. McPeek