International Electrical Engineering Journal (IEEJ) Vol. 7 (2017) No.9, pp. 2367-2376 ISSN 2078-2365 http://www.ieejournal.com/
Optimal Number Size and Location of Distributed Generation Units in Radial Distribution Systems Using Grey Wolf Optimizer Abdel-Rahman Sobieh1*, M. Mandour*, Ebtisam M. Saied*, and M.M. Salama* *Electrical Engineering Department, Shoubra Faculty of Engineering, Benha University, Cairo, Egypt 1
[email protected] Abstract— Penetration of distributed generation (DG)
units in distribution systems are attracting the researchers nowadays. Number, Capacity, and situation of DG units have a significant role affecting the performance of a distribution network. This paper presents a novel technique based on Grey Wolf Optimizer (GWO) which is applied to the optimal number, size, and location of DG units to minimize the active power loss and improve the voltage pro le of radial distribution networks. GWO will be compared with Genetic Algorithm (GA) optimization method to show the superiority and effectiveness of the proposed technique. In this paper, performance analysis is carried out considering IEEE 33-bus and 69-bus test radial distribution systems. Index Terms— Distributed Generation (DG), Voltage profile, Power loss, Grey Wolf Optimizer (GWO), Genetic Algorithm (GA).
I. INTRODUCTION In the last few years, penetration of distributed generation in electrical power systems has been drastically increasing. According to IEEE, DG defined as the generation of electricity by facilities that are sufficiently smaller than central generating plants to allow interconnection nearly at any point in a power system [1]. The presence of DGs in power networks supports system performance improvement such as power flow, voltage profile, stability, reliability, protection and power quality [2]. The most critical factors that influence the technical performance and economic are sizes, type, and location of DG units in the power system. DG generally indicates to a small unit (typically 1 KW to 50 MW) that produces electricity close to the customer or to an electric distribution system. DG technologies include micro-hydro units, PV arrays, wind turbines, solar thermal systems, diesel engines, fuel cells and battery storage [3]. DGs provide environmentally friendly solutions than the conventional generation by emitting less amount of $CO_2$ that because of
one of the most spread DG technology is renewable energy resources as mentioned above. In addition to environmentally friendly, they can be less costly as it eliminates the need for construction of distribution and transmission lines. To obtain the maximum benefits of DGs, the optimal size and location must be correctly nominated to reduce their impacts on the power system. Inappropriate sitting in some situations can reduce the benefits and drive to poor system performance [4]. Hence, the proper location and sizing of DG units have attracted many researchers working in this field to improve certain performance. An analytical and Improved Analytical (IA) method for deciding the best size and location of DG units for minimizing power loss had been presented in [4,5]. A new index called Power Stability Index (PSI) is used to identify the most sensitive bus for DG placement, and a search algorithm was used for finding the optimum size of to minimize power loss in [6]. In [7], the author focuses on testing various indices relating to this and effective methodologies to find optimal size and placement of the DG unit which helps in reducing voltage deviation and power losses using differential evolution algorithm. Many researchers proposed artificial intelligence-based optimization techniques for optimum location and sizing of DG units. In [8] Genetic Algorithm (GA) based optimization of multi-objective function used to determine the best sizing and allocation of DG units with multi-system constraints while In [9], Particle Swarm Optimization (PSO) based algorithm has been exhibited to choose the optimal size and location of a single DG to reduce the real power losses. In [10] an adaptive-weight PSO has been performed to set multiple DG units to minimize the real power loss of the system. A new combination (GA)/(PSO) is presented in [11] for optimal sizing and location of DG on distribution systems to minimize network power losses, better voltage profile and improve the voltage stability under system constraints. In [12] a novel technique based on Cuckoo Search (CS) is applied for optimally distributed generation (DG) allocation to improve voltage regulation and minimize active power losses of the distribution network. Bacterial Foraging Optimization 2367
Abdelrahman
et. al.,
Optimal Number Size and Location of Distributed Generation Units in Radial Distribution Systems Using Grey Wolf Optimizer
International Electrical Engineering Journal (IEEJ) Vol. 7 (2017) No.9, pp. 2367-2376 ISSN 2078-2365 http://www.ieejournal.com/ Algorithm (BFOA) is presented in [13] to find the optimal location and size of DG with an objective function of minimizing power losses, operating cost and improving voltage stability while In [14], a new optimization technique that employs a flower pollination algorithm (FPA) was employed to obtain the optimal DG size and location in order to improve the system buses voltage and minimize the total system real power loss. The big bang big crunch technique was used in [16] to obtain the best site and size of DG to minimize power loss for both balancing and unbalancing distribution systems. The backtracking search optimization algorithm (BSOA) was used in distribution system planning in [16] with multi-type DGs while in [17], BSOA was used to study the impact of different load models on DG placement and sizing and also the calculating time to find optimal size and location was obtained. Ant Colony Optimization (ACO) is presented in [18] to obtain the best DG allocation and sizing in distribution systems. A recent optimization technique in [19] called teaching learning-based optimization (TLBO) used for finding the optimal size and location of DG in a radial distribution system. A novel Grey Wolf Optimizer (GWO) is used in [20] to reduce reactive power loss and improve voltage levels of the distribution system, without violating power system constraints. GWO is applied on 69 bus system and the results compared with the Gravitational Search Algorithm (GSA) and the Bat Algorithm (BA) to show the superiority of the proposed methodology. In present work, GWO is used to calculate the optimal size and allocation of single and multi-DGs to minimize the active power losses and improve the voltage profile in a radial distribution system. The proposed technique is tested on IEEE 33-bus and 69-bus test radial systems with different scenarios of inserting DG units, and the results obtained are compared with Genetic Algorithm (GA). This paper will be surveyed as following: Problem formulation is reviewed in Section II, in Section III Grey Wolf Optimizer, in Section IV Implementation of proposed GWO algorithm, in Section V simulation results and discussion, and a conclusion in Section VI. II.
PROBLEM FORMULATION
A. Load flow Radial distribution systems, with a low X/R ratio, having distribution network matrices in ill-conditioned and this may produce numerical problems for the conventional power flow methodologies such as gauss seidel, newton raphson and fast decoupled methods. Another an efficient load flow method is presented in [21] based on Kirchhoff’s current law is used to overcome the problems with traditional load flow methods which are mentioned above. B. Multi-objective function The main objective of the proposed technique is to determine the optimal number, sizing, and location of DG units that
minimizes the multi objective function which including real power losses and voltage profile which restricted with certain constraints through the system and distribution network formulated as follows: (1) Where, MOF is the multi-objective function, PLI is the total active power loss index, VPI is the voltage profile index, w1 is the weighting factor for PLI and w2 is the weighting factor for VPI. These factor are usually assumed as [22] that:
and
(2)
The value of these factors are assumed based on which performance of the multi-objective function more important to be focused on. If the penetration of DG units serves a certain objective to overcome a definite problem, the corresponding weighing factor will be more than the others. In this paper, the values of weighing factors for both the total active power loss index (PLI) and the voltage profile index (VPI) are equal (w1 = w2 =0.5). 1. Power losses index
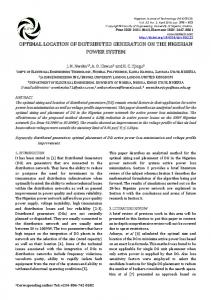
Fig. 1 A branch representation of radial system.
As shown in Figure 1, power losses in the line linking bus k with bus k +1 may be calculated as: (3) (4) (5) Where, PLoss(k,k+1) is the active power losses of line k,k+1. Ik,k+1 is the current passing in branch k,k+1. Rk,k+1 is the resistance of branch k,k+1. Pk+1 is the active power of the load at bus k+1. Qk+1 is the active power of the load at bus k+1. Vk+1 is the voltage of bus k+1. Then, the total real power losses of the radial distribution system consists of N-bus can be calculated as: (6) So, the total active power losses index PLI is defined as (7) 2368
Abdelrahman
et. al.,
Optimal Number Size and Location of Distributed Generation Units in Radial Distribution Systems Using Grey Wolf Optimizer
International Electrical Engineering Journal (IEEJ) Vol. 7 (2017) No.9, pp. 2367-2376 ISSN 2078-2365 http://www.ieejournal.com/ Where, PT,Loss(with_DG), PT,Loss(without_DG) are the active power losses with and without DG units in the system. By minimizing (PLI), the reduction in real power losses in the presence of DGs unit will be a maximum value.
III. GREY WOLF OPTIMIZER Grey wolves belong to Canidae family which mostly prefer to live in a pack. The group size is 5-12 on average. They have a very strict social dominant hierarchy as shown in Fig.2 [24].
2. Voltage profile index The main objective of voltage profile index (VPI) is to estimate the difference between the voltage of current operating point to the system voltage marginally stable point. Voltage limits will illustrate how close the system voltage is to be collapse or to be stable. Most of the voltage profile indexes that have been proposed are based on steady state power flow. Voltage profile index, which can be evaluated for all buses in radial distribution systems, was presented in [23]. The representation of the voltage profile index (VPI) is given by the following equation: (8) Where, Vk is the voltage of bus k, V{rated} is the supplying feeder bus voltage (1 pu.) and N is the total number of buses. As (VPI) close to zero, the voltage of buses reaches to the proposed value of voltage so by minimized this index the voltage levels will be improved. C. Constraints The operating constraints are defined as follows: 1. Voltage limits (9) Where, Vmin and Vmax are the minimum and maximum allowable voltage (±5%). 2. Power balance constraints (10.a) (10.b) Where, Psupply and Qsupply are the active and reactive power supplied by the main feeder respectively, PDG,n and $QDG,n are the active and reactive power penetrated by the DG unit at bus n respectively, and Pload and Qload are the total active and reactive load of the system respectively. 3. DG technical constraints (11.a) (11.b) Where, PDG,min and PDG,max are the minimum and maximum allowed output active power of DG unit, and PDG,T(min) and PDG,T(max) are the total minimum and maximum allowed output active power of all system DG units, assuming that, DG units generating active power only.
Fig. 2 Hierarchy of grey wolf (dominance decreases from top down).
Alphas (α) are the leaders of the pack which are a male and a female. They are responsible for making decisions about sleeping place, hunting, time to wake, and so on. They are only allowed to mate in the pack. They are not necessarily the strongest member in the pack but they should be the best managing of the pack. Betas (β) are the second level in the hierarchy. They are considered subordinate wolves that assist alphas in decision-making or other activities for the pack. They should respect alphas but command the lower-level wolves. They are the best candidate to be alphas in case one of the alpha wolves passes away, becomes very old or dies. They advise alphas and disciplines for the pack. The lowest classification of grey wolves are omegas. Omegas (ω) play the role of scapegoat for the pack. They are the last wolves that are allowed to eat. They must submit to all the other dominant wolves. It may consider that they are not a significant part of the pack, but they have been noted that all wolves in the pack face internal fighting in case of losing omegas due to violence of all wolves by them. If wolves are not alphas, betas, or omegas, they are called deltas (δ). Deltas have to submit to alphas and betas, but they dominate omegas. They may divide into Scouts, sentinels, elders, hunters, and caretakers. Scouts are responsible for warning the pack in case of any danger. Sentinels guarantee the safety and protect the pack. Elders are candidate to be alphas or betas due to their experiences. Hunters providing food for the pack by aiding alphas and betas when hunting prey. Finally, caretakers are responsible for caring the weak, ill, and wounded wolves in the pack. In addition to the hierarchy of wolves, group hunting is another social behavior of grey wolves. According to Muro et al. [25] the main steps of grey wolf hunting are: Searching and tracking the prey. Pursuing and encircling the prey until it stops moving. Attack the prey. In this work hunting technique and hierarchy of grey wolves are modeled mathematically in order to design GWO and perform optimization.
2369 Abdelrahman
et. al.,
Optimal Number Size and Location of Distributed Generation Units in Radial Distribution Systems Using Grey Wolf Optimizer
International Electrical Engineering Journal (IEEJ) Vol. 7 (2017) No.9, pp. 2367-2376 ISSN 2078-2365 http://www.ieejournal.com/ A. Mathematical modeling We consider the fittest solution can be described as the alpha (α) followed by the second and third best solutions which are beta (β) and delta (δ) respectively. The other candidate solutions are considered as omega (ω). GWO has set the hunting (optimization) is guided by α, β and δ while the ω wolves just following them. During the wolves hunting, they encircle their prey and the following equations described their encircling behavior [24]:
Step 1: Initialization Firstly, the itmax, NSA, dim and constraints of the problem are initialized.
(12.a) (12.b) Where, t is the current iteration, and are coefficient vectors, is the position vector of a grey wolf, and is the position vector of the prey. The vectors calculated as follows:
and
are (13.a)
(13.b) Where components of are linearly decreased from 2 to 0 over the course of iterations and are random vectors in [0,1]. The three best solutions are saved and then the other search agents (ω-wolves) update their positions according to the current best position. These situations are expressed in the following expressions: (14.a) (14.b) (14.c) (15.a) (15.b) (15.c) (16) Equations (14.a), (14.b), and (14.c) estimate the distance between α, β and δ with respect to ω respectively. Then equations (15.a), (15.b), and (15.c) decide the current position of α, β and δ respectively. Final equation (16) indicates to the update position of ω depending on the positions of the best three solutions (α, β and δ). IV. IMPLEMENTATION OF PROPOSED GWO ALGORITHM Several steps have been taken to implement GWO to obtain the optimal allocation (i.e. site and size) of multi-DG units. This procedure is described through the flowchart presented in Fig.3 [20]. The pre-decided maximum number of iterations (itmax), the dimension (dim) of the problem and the search agents (NSA) are applied.
Fig. 3 The flow chart of the proposed GWO algorithm [20].
Step 2: Generation of grey wolf positions A population of grey wolves is generated by GWO and α, β, and δ wolves' positions are initialized and then the objective function for each population is calculated through load flow method. Step 3: Quality solution The constraints of each search agent are checked and if the constraints are satisfied, then the multi-objective function is calculated. But in the case of any constraint violation, the results are discarded. 2370
Abdelrahman
et. al.,
Optimal Number Size and Location of Distributed Generation Units in Radial Distribution Systems Using Grey Wolf Optimizer
International Electrical Engineering Journal (IEEJ) Vol. 7 (2017) No.9, pp. 2367-2376 ISSN 2078-2365 http://www.ieejournal.com/ Step 4: Choose the best position The positions of α, β, and δ wolves are updated, except the ω wolf and then updating ω wolf by utilizing Eqns. (5)-(10) in order to determine the best solution so far. Step 5: Calculation of new positions of search agents The new positions of the search agents are determined and the whole process is repeated. Step 6: Termination In the proposed study, the stop criteria are set as maximum iterations. When the criterion is satisfied, then the simulation will be stopped and the optimum site and size of multi-DG units which satisfy all the specified constraints of the distribution system will be obtained.
Fig. 4 Single line diagram of IEEE 33-bus test system.
Fig. 5 Optimal number of DG units for 33 bus test system. V. SIMULATION RESULTS AND DISCUSSION The simulation results will be carried out on two different distribution systems which are IEEE 33-bus and IEEE 69-bus test radial distribution systems. For both test systems, it is assumed that all buses of the network can be taken as candidate for DG units’ placement except the first bus which connected to the main feeder from generation station. DG units will be considered as photo-voltaic cells (pf=1) generate only active power. To evaluate the effectiveness of the proposed GWO algorithm, the performance of the systems are analyzed and compared with GA optimization method. GWO is used to obtain the optimal number, size and location of DG units for both test systems. A. IEEE 33-bus test system This system consists of 33 bus and 32 line with a feeder connected to bus 1 as shown in Fig. 4 and data is given in [26]. The total active and reactive power loads of the system are 3.715 MW and 2.3 MVar, respectively. The total real power loss is 210.99 kW and the total reactive power loss is 143.12 kVar with the weakest voltage point of 0.9092 pu at bus (18) which are calculated by load flow method mentioned in section II.
Fig.5 shows a comparison between GA and GWO techniques in terms of the best values of the multi-objective function to obtain the optimal number of DG units in IEEE 33-bus test system. Based on Fig.5, the optimal number of DG units is four units since in case of five units the best value of the multi-objective function is more than that obtained in case of four units under the specified constrains. Table I Comparison of IEEE 33-bus test system for one DG unit with 30 different trials.
Method GA GWO
Average (pu) 0.2858 0.2809
Best solution (pu) 0.2810 0.2809
Worst solution (pu) 0.2976 0.2809
Table II Comparison of IEEE 33-bus test system for two DG units with 30 different trials.
Method
Average (pu)
GA GWO
0.2201 0.2144
Best solution (pu) 0.2149 0.2144
Worst solution (pu) 0.2387 0.2148
Table III Comparison of IEEE 33-bus test system for three DG units with 30 different trials.
Method
Average (pu)
GA GWO
0.1967 0.1797
Best solution (pu) 0.1813 0.1794
Worst solution (pu) 0.2102 0.1806
Table IV Comparison of IEEE 33-bus test system for four DG units with 30 different trials.
Method
Average (pu)
GA GWO
0.1866 0.1732
Best solution (pu) 0.1722 0.1676
Worst solution (pu) 0.2082 0.1833
2371 Abdelrahman
et. al.,
Optimal Number Size and Location of Distributed Generation Units in Radial Distribution Systems Using Grey Wolf Optimizer
International Electrical Engineering Journal (IEEJ) Vol. 7 (2017) No.9, pp. 2367-2376 ISSN 2078-2365 http://www.ieejournal.com/ Tables I-IV show the comparison between GA and GWO in terms of average, best and worst values of 30 different trials. The difference between the average and best values with GWO and GA shows the convergence of solutions in case of GWO than GA. On the other hand, difference between the best and worst values with GWO and GA reflects the accuracy and superiority of GWO over GA. Fig. 6 to Fig. 9 show the convergence curves of the GWO for the best solution in case of single and multi-DG units for IEEE 33-bus system. It is clear from the convergence curves that GWO is a sufficient optimization technique as it is able to find the best solution even if the number of variables is increasin.
Best Value
0.5
0.3
0.2 10
20
30
40
50 Iteration
60
70
80
90
100
Fig. 9 Convergence curve of GWO for the best solution of three DG units.
0.34
Fig.10 shows a comparison between the voltage levels at all buses for IEEE 33-bus test system in case of base case (without DG units), single and multi-DG units using GWO.
0.33 0.32 Best Value
0.4
0.31
1.05 Base 1-DG 2-DG 3-DG 4-DG
0.3 0.29
10
20
30
40
50 Iteration
60
70
80
90
100
Fig. 6 Convergence curve of GWO for the best solution of one DG.
Voltage (p.u.)
1
0.28
0.95
0.32 0.3
0.9
5
10
15
20
25
30
Bus Number
0.26
Fig. 10 Comparing voltage profile for single and multi-DG units of IEEE 33-bus test system.
0.24 0.22 0.2
10
20
30
40
50 Iteration
60
70
80
90
100
Fig. 7 Convergence curve of GWO for the best solution of two DG units. 0.205 0.2
Best Value
Best Value
0.28
0.195 0.19 0.185 0.18 10
20
30
40
50 Iteration
60
70
80
90
Fig. 8 Convergence curve of GWO for the best solution of three DG units.
100
Fig. 11 Comparing power loss reduction (%) for single and multi DG units of 33-bus test system.
2372 Abdelrahman
et. al.,
Optimal Number Size and Location of Distributed Generation Units in Radial Distribution Systems Using Grey Wolf Optimizer
International Electrical Engineering Journal (IEEJ) Vol. 7 (2017) No.9, pp. 2367-2376 ISSN 2078-2365 http://www.ieejournal.com/ Table V Comparing single and multi DG units using GWO of IEEE 33-bus test system performance. Using GWO Base Case
Power Losses (pu) 0.21099
Minimum Voltage (pu) 0.9092
Weakest Bus
DG Location
DG size (KW)
Bus (18)
----
----
Total DG (KW) ----
One DG
0.11142
0.9448
Bus (18)
Bus (6)
2761.82
2761.82
Two DG
0.08743
0.9706
Bus (33)
Bus (13) Bus (30)
903.04 1201.61
2104.65
Three DG
0.07306
0.9709
Bus (33)
0.11408
0.9862
Bus (33)
850.02 1103.87 1100.77 797.81 785 971.9 785
3054.66
Four DG
Bus (13) Bus (24) Bus (30) Bus ( 6 ) Bus (14) Bus (24) Bus (31)
According to Fig. 10, the system needs at least two DG units to improve the voltage level of all buses more than 0.95 pu which is the minimum accepted limit. With only one DG unit there is a weak point at bus (18) at which the voltage level is lower than 0.95 pu. The voltage levels in case of four DG units is better than that in case of two and three DG units. Fig. 11 shows a comparison between power loss reduction in a percent with respect to the base value for single and multi-DG units using GWO. It is clear that, the loss reduction in case of three units is better than the other cases. Although increasing the number of DG units should reduce the power losses, the power losses are increased in case of four DG units for the sake of better voltage levels. Table V shows a comparison between all study cases in terms of the best size, location, power loss and weakest bus for IEEE 33-bus test system using GWO.
3339.71
Based on the above results, three DG units is the most suitable and recommended case for this system. Although four DG units give the best overall multi-objective function, but it is recommended to use only three DG units for economic point of view, best power loss reduction, and the voltage levels are within the minimum and maximum accepted voltage limits. B. IEEE 69-bus test system The second system is IEEE 69-bus test radial distribution system which has 69 bus and 68 line with a source at bus 1 as demonstrated in Fig. 12. It has the total load of 3.80 MW and 2.69 MVar and it is Data for this system are given in [26]. The real power loss and the reactive power loss are 224.9 KW and 102.13 KVar for this test system respectively with the weakest voltage point of 0.9092 pu at bus (65) which are calculated by load flow method mentioned in section II.
Fig. 12 Single line diagram of IEEE 69-bus test system.
2373 Abdelrahman
et. al.,
Optimal Number Size and Location of Distributed Generation Units in Radial Distribution Systems Using Grey Wolf Optimizer
International Electrical Engineering Journal (IEEJ) Vol. 7 (2017) No.9, pp. 2367-2376 ISSN 2078-2365 http://www.ieejournal.com/ GA as executed in case of IEEE 33-bus test radial distribution system. Fig. 14 to Fig. 17 show the convergence curves of the GWO for the best solution in case of single and multi-DG units for IEEE 69-bus system. 0.28
Best Value
0.26
0.24
0.22
Fig. 13 Optimal number of DG units for IEEE 69-bus system.
0.2
Fig.13 shows a comparison between GA and GWO techniques in terms of the best values of the multi-objective function to obtain the optimal number of DG units in IEEE 69-bus test system. Based on Fig.13, the optimal number of DG units is four units since in case of five units the best value of the multi-objective function is more than that obtained in case of four units under the specified constrains.
10
GA GWO
0.1966 0.1945
Best solution (pu) 0.1945 0.1945
Worst solution (pu) 0.2034 0.1945
Average (pu)
GA GWO
0.1821 0.1652
Best solution (pu) 0.1638 0.1620
50 Iteration
60
70
80
90
100
0.22 0.21 0.2 0.19 0.18 0.17
Table VII Comparison of IEEE 69-bus test system for two DG units with 30 different trials.
Method
40
0.23
Best Value
Average (pu)
30
Fig. 14 Convergence curve of GWO for the best solution of one DG unit in IEEE 69-bus test system.
Table VI Comparison of IEEE 69-bus test system for one DG unit with 30 different trials.
Method
20
0.16
Worst solution (pu) 0.2032 0.1705
10
20
30
40
50 Iteration
60
70
80
90
100
Fig. 15 Convergence curve of GWO for the best solution of two DG units in IEEE 69-bus test system. 0.2
Table VIII Comparison of IEEE 69-bus test system for two DG units with 30 different trials.
Average (pu)
GA GWO
0.1664 0.1597
Best solution (pu) 0.1603 0.1567
Worst solution (pu) 0.1799 0.1709
0.19 Best Value
Method
0.18
0.17
Table IX Comparison of IEEE 69-bus test system for two DG units with 30 different trials.
Method
Average (pu)
GA GWO
0.1665 0.1563
Best solution (pu) 0.1575 0.1541
Worst solution (pu) 0.1871 0.1675
0.16 10
20
30
40
50 60 70 80 90 Iteration Fig. 16 Convergence curve of GWO for the best solution of three DG units in IEEE 69-bus test system.
Tables VI-IX show the comparison between GA and GWO in terms of average, best and worst values of 30 different trials which verified the superiority of GWO over 2374 Abdelrahman
et. al.,
Optimal Number Size and Location of Distributed Generation Units in Radial Distribution Systems Using Grey Wolf Optimizer
100
International Electrical Engineering Journal (IEEJ) Vol. 7 (2017) No.9, pp. 2367-2376 ISSN 2078-2365 http://www.ieejournal.com/ 0.22 0.21
Best Value
0.2 0.19 0.18 0.17 0.16 0.15 0
10
20
30
40
50 60 70 80 90 100 Iteration Fig. 17 Convergence curve of GWO for the best solution of four DG units in IEEE 69-bus test system.
Fig.18 shows a comparison between the voltage levels at all buses for IEEE 69-bus test system in case of base case (without DG units), single and multi-DG units using GWO. 1
Voltage (p.u.)
0.98
0.96
Base 1-DG 2-DG 3-DG 4-DG
0.94
0.92
10
20
30
40
50
60
Bus Number
Fig. 18 Comparing voltage profile for single and multi-DG units of IEEE 69-bus test system.
Fig. 19 Comparing power loss reduction (%) for single and multi DG units of IEEE 69-bus test system.
According to Fig. 18, the system needs only one DG unit to improve the voltage level of all buses more than 0.95 pu which is the minimum accepted limit. Fig. 19 shows a comparison between power loss reduction in a percent with respect to the base value for single and multi-DG units using GWO. It is clear that, the loss reduction in case of four DG units is better than the other units. Table X shows a comparison between all study cases in terms of the best size, location, power loss and weakest bus for IEEE 69-bus test system using GWO. The weakest bus is the same for two cases, three, and four DG units but four units case has the lowest power losses. Finally, although four DG units case gives the best overall multi-objective function, but due to the slightly difference between four and three units, we suggest case with only three DG units for less size of DG units used from the economic point of view.
Table V Comparing single and multi DG units using GWO of IEEE 69-bus test system performance.
Using GWO
Minimum Voltage (pu) 0.9092
Weakest Bus
DG Location
Base Case
Power Losses (pu) 0.2249
Bus (65)
One DG
0.08324
0.9687
Two DG
0.07174
Three DG
0.06951
Four DG 0.06835
----
DG size (KW) ----
Total DGs (KW) ----
Bus (27)
Bus (61)
1928.67
1928.67
0.9803
Bus (65)
Bus (17) Bus (61)
566.08 1816.42
2382.5
0.9804
Bus (65)
Bus (65)
541.52 406.39 1751.43 439.79 716.47 1756.74 473.68
2699.34
0.9803
Bus (11) Bus (18) Bus (61) Bus ( 18 ) Bus (50) Bus (61) Bus (67)
3386.68
2375 Abdelrahman
et. al.,
Optimal Number Size and Location of Distributed Generation Units in Radial Distribution Systems Using Grey Wolf Optimizer
International Electrical Engineering Journal (IEEJ) Vol. 7 (2017) No.9, pp. 2367-2376 ISSN 2078-2365 http://www.ieejournal.com/
VI. CONCLUSIONS This paper presents a comparison between two optimization techniques GA and GWO. Results show the effectiveness, superiority and accuracy of GWO technique over the GA technique. The GWO is then used to get the best number, size and location of DG units in case of two radial study systems IEEE 33-bus test system and IEEE 69-bus test system. Several cases based on number of DG units are studied considering a multi-objective function and then the best number of DG units is recommended based on the results of this multi-objective function and some economic aspects. REFERENCES [1]
[2]
[3]
[4]
[5]
[6]
[7]
[8]
[9]
[10]
[11]
[12]
[13]
G. Pepermansa, J. Driesenb, D. Haeseldonckxc, R. Belmansc, W. D’haeseleerc, "Distributed generation: definition, benefits and issues " , Energy Policy, vol. 33, pp. 787-798, April 2005.P.C. Krause, O. Wasynczuk and S.D. Sudhoff, Analysis of Electric Machinery, IEEE Press, 1995. Thomas Ackermanna, Göran Anderssonb, Lennart Södera, "Distributed generation: a definition", Electric Power Systems Research, vol. 57, pp. 195–204, 20 April 2001.. W El-Khattam, M.M.A Salama, "Distributed generation technologies, definitions and benefits", Electric Power Systems Research, vol. 71, pp. 119–128, October 2004. Naresh Acharya, Pukar Mahat, N. Mithulananthan, "An analytical approach for DG allocation in primary distribution network", International Journal of Electrical Power & Energy Systems, vol. 28, pp. 669–678, December 2006 Duong Quoc Hung, Nadaraj Mithulananthan, " Multiple Distributed Generator Placement in Primary Distribution Networks for Loss Reduction", IEEE Transactions on Industrial Electronics, vol. 60, pp. 1700 - 1708, April 2013. M.M. Amana, G.B. Jasmona , H. Mokhlisa , A.H.A. Bakara, "Optimal placement and sizing of a DG based on a new power stability index and line losses", International Journal of Electrical Power & Energy Systems, vol. 43, pp. 1296–1304, December 2012. R. Himanshu Sangwan, "Optimal Positioning and Sizing of DG Units using Differential Evolution Algorithm", International Electrical Engineering Journal, vol. 7, pp. 2292-2297, 2016. A.A. Abou El-Elaa, S.M. Allama, M.M. Shatlab, "Maximal optimal benefits of distributed generation using genetic algorithms", Electric Power Systems Research, vol. 80, pp. 869–877, July 2010. W. El-Khattam, Y. Hegazy, M. Salama, "An integrated distributed generation optimization model for distribution system planning", Power Engineering Society General Meeting, 2005. IEEE, June 2005. W. Prommee, W. Ongsakul, "Optimal multi-distributed generation placement by adaptive weight particle swarm optimization", Control, Automation and Systems, 2008 , October 2008. M.H. Moradi, M. Abedini, "A combination of genetic algorithm and particle swarm optimization for optimal DG location and sizing in distribution systems", International Journal of Electrical Power & Energy Systems, vol. 34, pp. 66–74, January 2012. Zahra Moravej, Amir Akhlaghi "A novel approach based on cuckoo search for DG allocation in distribution network", International Journal of Electrical Power & Energy Systems, vol. 44, pp. 672–679, January 2013. Mohamed Imran A, Kowsalya M, "Optimal size and siting of multiple distributed generators in distribution system using bacterial foraging
[14]
[15]
[16]
[17]
[18]
[19]
[20]
[21]
[22]
[23]
[24]
[25]
[26]
optimization", Swarm and Evolutionary Computation, vol. 15, pp. 58–65, April 2014. Eyad S. Odaa, Abdelazeem A. Abdelsalama, Mohamed N. Abdel-Wahaba,, Magdi M. El-Saadawib, "Distributed generations planning using flower pollination algorithm for enhancing distribution system voltage stability ", Ain Shams Engineering Journal, December 2015. Y. G. Hegazy, M. M. Othman, Walid El-Khattam, A. Y. Abdelaziz, "Optimal sizing and siting of distributed generators using Big Bang Big Crunch method", Power Engineering Conference (UPEC), 2014 49th International Universities, September 2014. A. El-Fergany, "Optimal allocation of multi-type distributed generators using backtracking search optimization algorithm", International Journal of Electrical Power & Energy Systems, vol. 64, pp. 1197–1205, January 2015. A. El-Fergany, "Study impact of various load models on DG placement and sizing using backtracking search algorithm", Applied Soft Computing, vol. 30, pp. 803–811, May 2015. Hamid Falaghi, Mahmood-Reza Haghifam, "ACO Based Algorithm for Distributed Generation Sources Allocation and Sizing in Distribution Systems", Power Tech, 2007 IEEE Lausanne, July 2007. Banaja Mohanty, Sasmita Tripathy, "A teaching learning based optimization technique for optimal location and size of DG in distribution network", Journal of Electrical Systems and Information Technology, vol. 3, pp. 33–44, May 2016. A. B. K. U. Sultana a, A.S. Mokhtar, N. Zareen, Beenish Sultana, "Grey wolf optimizer based placement and sizing of multiple distributed generation in the distribution system", Energy, vol. 111, pp. 525–536, 15 September 2016. J.-H. Teng, "A Direct Approach for Distribution System Load Flow Solutions," IEEE TRANSACTIONS ON POWER DELIVERY, vol. 8, 2003. C. A. C. Coello, "An updated survey of evolutionary multiobjective optimization techniques: state of the art and future trends", Evolutionary Computation, 1999, July 1999. C. Muroa, R. Escobedoa, L. Spectorc, R.P. Coppingerc, "Wolf-pack (Canis lupus) hunting strategies emerge from simple rules in computational simulations", Behavioural Processes, vol. 88, pp. 192–197, November 2011. Seyedali Mirjalilia, Seyed Mohammad Mirjalilib, Andrew Lewis, "Grey Wolf Optimizer", Advances in Engineering Software, vol. 69, pp. 46–61, March 2014. E.-m. t. c. a. C. Muroa, R. Escobedoa, L. Spectorc, R.P. Coppingerc, "Wolf-pack (Canis lupus) hunting strategies emerge from simple rules in computational simulations", Behavioural Processes, vol. 88, pp. 192–197, 2011. Abdellatif Hamouda, Khaled Zehar, "Efficient Load Flow Method for Radial Distribution Feeders", Journal of Applied Sciences, vol. 6, pp. 2741-2748, 2006.
2376 Abdelrahman
et. al.,
Optimal Number Size and Location of Distributed Generation Units in Radial Distribution Systems Using Grey Wolf Optimizer