Food Bioprocess Technol (2011) 4:1450–1458 DOI 10.1007/s11947-009-0243-6
ORIGINAL PAPER
Optimization of Process Parameters for Foaming of Bael (Aegle marmelos L.) Fruit Pulp Subrata Kumar Bag & Prem P. Srivastav & Hari N. Mishra
Received: 3 April 2009 / Accepted: 5 August 2009 / Published online: 25 August 2009 # Springer Science + Business Media, LLC 2009
Abstract Foam expansion and foam stability of the bael (Aegle marmelos L.) fruit pulp foam was studied. Foams were prepared from various pulp concentrations (PC) by adding different concentration of glycerol monostearate (GMS) and methyl cellulose (MC) at different whipping time (WT). Response surface methodology was used to predict the foam stability and expansion. Thirty experiments were carried out using a central composite rotatable design with four independent variables (GMS, MC, PC, and WT). Second-order polynomial equations were developed after removing insignificant terms for predicting foam expansion (R2 =0.85) and stability (R2 =0.95). The optimum conditions achieved after the numerical and graphical optimization for maximum foam expansion and stability was: GMS (3.10 g/100 g pulp), MC (0.32 g/100 g pulp), PC (13.2°Bx), and WT (2 min). The desirability of 0.712 was achieved at this optimum point. The predicted values of foam density and foam drainage volume were 0.658 gcm−3 and 1.75 mL, respectively, at optimum parameters while the experimental values were 0.635± 0.02 gcm−3 and 1.75±0.12 mL, respectively. Keywords Aegle marmelos . Central composite rotatable design . Density . Drainage volume . Foam . Response surface methodology . Whipping time
S. K. Bag (*) : P. P. Srivastav : H. N. Mishra Agricultural and Food Engineering Department, Indian Institute of Technology, Kharagpur, 721 302 West Bengal, India e-mail:
[email protected]
Introduction Bael (Aegle marmelos L.) is a tropical fruit native to Southeast Asia and is grown throughout India, Sri Lanka, Pakistan, Bangladesh, Burma, Thailand, and most of the Southeast Asian countries (Singh and Roy 1984). The bael fruit pulp contains many functional and bioactive compounds such as carotenoids, phenolics, alkaloids, coumarins, flavonoids, and terpenoids and has innumerable traditional medicinal uses (Arseculeratne et al. 1981; Karunanayake et al. 1984; Singh 1986; Nagaraju and Rao 1990). Dehydration is the most commonly used age-old technique for increasing the shelf-life of fruits. However, the drying of sugar-rich foods such as fruit pulp and juices is difficult, as they contain low molecular weight components like fructose, glucose, sucrose, citric acid, etc. These materials also have low glass transition temperature, Tg (Roos and Karel 1991a, 1991b; Roos 1995), and due to their low molecular weight, the molecular mobility of the materials is high when the temperature is just above Tg. To overcome this problem, ingredients with high Tg, such as maltodextrin, and food-grade anti-caking agents like tricalcium phosphate are generally added to prepare fruit powders (Jaya and Das 2009). However, materials with high sugar content, when converted to stable foams, can be dried rapidly in air to yield instant powders (Karim and Wai 1999a; Eduardo et al. 2001; Sankat and Francois 2004; Rajkumar et al. 2007; Thuwapanichayanan et al. 2008). In foam-mat drying, food liquids and pastes are first whipped into stable foam by addition of different foaming agents and then dried in a form of thin layer (mats). This foam structure dries rapidly due to increase of the surface area of the material by incorporating air/gas and forms porous structure which gives high quality and instant properties of the dried product (Lewicki 2006). Foam-mat drying can
Food Bioprocess Technol (2011) 4:1450–1458
be carried out at lower temperatures and foaming of materials reduces drying time and is relatively inexpensive compared to the non-foamed material dried in the similar dryer. The main drawback of this method is the throughput of the dryer as the moisture is removed from the thin layer of the foam; hence, the material spread per unit surface of drying area is very small. Still due to the higher drying rates, foam-mat drying is considered superior to nonfoamed tray drying in terms of process feasibility, drying kinetics, energy efficiency, dryer throughputs, and capital cost (Kudra and Ratti 2006). The foam structure, its expansion, and stability play major role in moisture movement during drying and subsequently the product quality. Foams that do not collapse for at least 1 h are considered mechanically or thermally stable for the entire drying process (Bates 1964; Ratti and Kudra 2006). Thermally stable foams retain their porous structure, which aids improvement in the reconstitution properties of the foam-mat-dried product. The unstable foamed products are difficult to dry and detray and have poor color, texture, flavor, and nutritive value. The addition of foaming and stabilizing agents helps in increasing foam stability during drying. The concentration of the foam stabilizer should be optimized as below the critical concentration the foam is unstable, whereas overdosed stabilizer can result in foam collapse (Ratti and Kudra 2006). The foam expansion can be measured by its expansion ratio or density whereas the stability can be measured by drainage volume. Variables affecting foam density and stability have been reported (Hart et al. 1963); these include chemical nature of the fruit, soluble solids, pulp concentration, type, and concentration of foaming additives, operating parameters of foaming device. Bates (1964) studied the foam-mat drying of some tropical fruits using two types of foam inducers, namely modified soybean protein (D-100) and glycerol monostearate (GMS) and reported that the foam density and stability was increased with the increase in the soluble solids content of the juices. Methyl cellulose (MC) and GMS were used successively to aid foam formation in fruit pulp destined for foam-mat-drying process. The surface active nature of MC imparted the stability when added to starfruit (Averrhoa carambola L.) puree foam (Karim and Wai 1999a, b). Labelle (1966) used glyceryl monostearate as a foaming agent and methocel as a stabilizer for orange juice. Falade et al. (2003) used GMS and egg albumin for foam-mat drying of cowpea. Raharitsifa et al. (2006) used egg white and methylcellulose as a foaming additive for characterization of apple juice foams for foam-mat drying and optimized their levels to 2–3% and 0.2%, respectively, to obtain stable foams. Muthukumaran et al. (2008) dried egg white in freeze drier by foam-mat drying technology using different foam stabilizers (MC, propylene glycol alginate, and xanthan gum) and reported that 0.125%
1451
xanthan gum gives sufficient stability. The variation in pH also affects the surface and rheological properties of foams. Thakur et al. (2006) studied the effect of pH (4.2 to 6.6) on foaming of foods from emulsion and revealed that at low pH consistency coefficient of foaming material increased and more viscous force is required. The operating conditions (rotational speed and whipping time) of foaming device also play important role on foam expansion, texture, and stability (Thakur et al. 2003). Though foam-mat drying allows processing of difficult-todry materials, it might not always yield a superior product, especially when compared to spray drying (Akintoye and Oguntunde 1991; Cooke et al. 1976). The creation of an increased air-to-liquid surface area due to foaming may accelerate deterioration due to oxidative reactions, as well as affect aroma retention. Patel (1996) reported the residual ascorbic acid and lycopene content of the foam-mat-dried tomato powder were significantly affected by drying time and temperature. Results of studies by Eduardo et al. (2001) on flavor retention in foam-dried tamarind juices indicate that the type of the foaming agent may lead to poor or good flavor acceptability. Systematic studies on bael fruit pulp drying are limited. Roy and Singh (1979) prepared bael pulp powder (moisture content, 4%) by mixing 2,000 ppm SO2 and spreading a thin sheet in the drier. The process involved about 28 h of drying which is expected to affect the organoleptic quality. Rai and Misra (2001) studied both sun drying and cabinet drying of bael fruit pulp at (60±1°C) and showed a significant effect on the proximate composition and ascorbic acid content of the powder but the effect of drying on yield and dehydration ratio of the pulp powder was not significant. Spray-dried bael pulp powder with inlet temperature of 120–180ºC and outlet temperature of 70–100°C was prepared by addition of MgCO3 as anti-caking agent (Rastogi et al. 2005). Foaming conditions of various tropical fruits such as pineapple, passion fruit, guava, banana, papaya, mango, star fruits, and apple have been reported earlier; however, there are no reports on foaming of bael (A. marmelos L.) fruit pulp. The aim of the present investigation is to study the effect of whipping time, pulp concentration, and foaming additives on the foam density and drainage volume of bael fruit pulp foam. The foaming process was optimized in terms of maximum foam expansion (i.e., minimum foam density) and maximum foam stability (i.e., minimum drainage volume).
Materials and Methods Materials Fully ripe bael (A. marmelos) fruits were purchased from the local market. The fruits were washed graded, and their
1452
Food Bioprocess Technol (2011) 4:1450–1458
Table 1 Physicochemical properties of bael (Aegle marmelos L.)
GAE gallic acid equivalent a
average of nine samples
b
in terms of citric acid
Moisture TSS Total sugar Reducing sugar Nonreducing sugar Acidityb pH Protein Fat Total polyphenol (mg GAE/g dw)
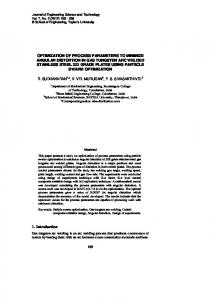
hard rind was broken manually. Pulp was extracted along with seeds and gums. Total solid content of the pulp samples ranged from 32.6–41.2%, and the total soluble solids content varied from 31.0 to 39.5°Bx. The chemical analysis (Tripathi and Mishra 2009a) of bael pulp was carried out, and results are presented in Table 1. Pulp was extracted by addition of distilled water (1:1 w/w) to facilitate seed removal (Roy and Singh 1979) followed by subsequent straining through 20 mesh stainless steel sieve. The extracted pulp was placed in sterilized and sealed glass bottle. The bottled pulp was heated in boiling water for 15 min to inhibit microbial and enzyme activity. It was then cooled and stored at room temperature (Fig. 1). During foaming trial, the desired pulp concentration (°Brix) was prepared by mixing calculated amount of distilled water. The TSS was checked with hand refractometer (ERMA, Tokyo, Japan).
Meana
SD
Min
Max
64.43 33.89 15.09 11.45 3.63 0.37 5.15 2.09 0.26 63.83
1.88 1.77 1.91 0.63 1.47 0.05 0.14 0.20 0.04 4.58
58.83 31.00 12.50 10.35 2.08 0.31 4.90 1.80 0.20 55.58
67.45 39.50 17.92 12.24 5.68 0.48 5.30 2.37 0.30 66.83
5,000 rpm for required duration at controlled room temperature (22–25°C) as shown in Table 2. Compressed airflow rate was maintained 10 L/min. The foamed pulp samples were then removed from the foaming device and analyzed for FD and DV.
Ripe bael fruit 1000 g Washing
Breaking
Pulp with seeds and fibre 760g (TS 35%, TSS 34 ˚Brix) Water (1:1) 760g
Foaming Device The laboratory scale foaming device consisting of two parts— mixing jar and a motor were developed by modification of kitchen mixer (Gopi Co. Ltd. Ambala, India). A whipping blade made of stainless steel (1.6 mm thick) with three cutting edges was used to agitate the material in the jar. A pre-calibrated rotameter was installed for monitoring compressed airflow rate, and a stroboscope (Strobotac, 1531AB, G R Co., Concord Massachusetts, USA) was used to measure the rotational speed of the whipping blade.
Hard shell 240g
Mixing and sieving
Seeds and fibre 60 g
Pulp 1460g (TS 16.78%) Filling in bottle and capping
Heating in boiling water for 15 min
Cooling to room temperature and storage Water Pulp TSS (8 - 16˚Brix)
Foaming Trials To determine the effect of foaming additives, pulp concentration and whipping time on foam density (FD) and foam drainage volume (DV) central composite rotatable design (CCRD) was used. In 200 mL bael pulp of desired concentration, the required quantity of GMS and MC was added, and the foaming device was operated at
Foaming additives GMS (0-8g/100g) MC (0-1g/100g)
Foaming
Foam Density (0.917-0.580 g cm-3)
Fig. 1 Flow diagram for preparation of bael pulp foam
Food Bioprocess Technol (2011) 4:1450–1458 Table 2 Effect of process variables on FD and DVof foam bael pulp
GMS glycerol monostearate, MC methyl cellulose, PC pulp concentration, WT whipping time, FD foam density, DV drainage volume a
Data in the parenthesis is the coded value of process variables
Experiment no.
1453 Process variablesa GMS (x1)
Response
MC (x2)
PC (x3)
1 2 3 4 5 6 7 8 9 10 11 12
6 6 6 6 6 6 6 6 2 2 2 2
(+1) (+1) (+1) (+1) (+1) (+1) (+1) (+1) (−1) (−1) (−1) (−1)
0.75 0.75 0.75 0.75 0.25 0.25 0.25 0.25 0.75 0.75 0.75 0.75
(+1) (+1) (+1) (+1) (−1) (−1) (−1) (−1) (+1) ( +1) (+1) (+1)
14 14 10 10 14 14 10 10 14 14 10 10
13 14 15 16 17 18 19 20 21 22 23 24 25 26 27 28 29 30
2 (−1) 2 (−1) 2 (−1) 2 (−1) 8 (+2) 0 (−2) 4 (0) 4 (0) 4 (0) 4 (0) 4 (0) 4 (0) 4 (0) 4 (0) 4 (0) 4 (0) 4 (0) 4 (0)
0.25 0.25 0.25 0.25 0.5 0.5 1.0 0.0 0.5 0.5 0.5 0.5 0.5 0.5 0.5 0.5 0.5 0.5
(−1) (−1) (−1) (−1) (0) (0) (+2) (−2) (0) (0) (0) (0) (0) (0) (0) (0) (0) (0)
14 (+1) 14 (+1) 10 (−1) 10 (−1) 12 (0) 12 (0) 12 (0) 12 (0) 16 (+2) 8 (−2) 12 (0) 12 (0) 12 (0) 12 (0) 12 (0) 12 (0) 12 (0) 12 (0)
Determination of FD The density of prepared foam was determined by weighing 50 mL of the mixture in a 50-mL measuring cylinder. The foam transferring was carried out without destroying the foam structure and trapping the air voids were avoided while filling the cylinder (Karim and Wai 1999b). The determinations were done in triplicate for each batch of preparation, and the average values were reported at controlled room temperature (22–25°C). Determination of Foam DV Foam drainage method, as described by Sauter and Montoure (1972) and Narender and Pal (2009), was used with slight modification to test foam stability. In the modified method, the foam was filled into a buchner filter
(+1) (+1) (−1) (−1) (+1) (+1) (−1) (−1) (+1) (+1) (−1) (−1)
WT (x4)
FD (gcm−3)
DV (mL)
4 2 4 2 4 2 4 2 4 2 4 2
(+1) (−1) (+1) (−1) (+1) (−1) (+1) (−1) (+1) (−1) (+1) (−1)
0.786 0.761 0.72 0.715 0.704 0.653 0.646 0.618 0.917 0.78 0.742 0.725
0 0 0 0 2 2 2 2 0 0 0 1
4 2 4 2 3 3 3 3 3 3 5 1 3 3 3 3 3 3
(+1) (−1) (+1) (−1) (0) (0) (0) (0) (0) (0) (+2) (−2) (0) (0) (0) (0) (0) (0)
0.755 0.721 0.716 0.699 0.66 0.854 0.763 0.580 0.799 0.635 0.671 0.642 0.659 0.649 0.649 0.63 0.631 0.684
2 2 2 2 0 1 0 4 0 1 1 1 1 1 1 1.5 1 1.5
(80 mm) and was placed on a 25-mL graduated cylinder. The liquid juice (mL) which separated from the foam as a result of drainage was collected in the measuring cylinder. The amount of juice collected in the cylinder after an hour was recorded at controlled room temperature (22–25°C). Experimental Design and Statistical Analysis The ranges of experimental parameters were selected based on preliminary trials. The independent variables considered were: GMS (0–8 g/100 g of pulp), MC (0–1 g/100 g of pulp), PC (8–16°Bx), and WT (1–5 min). A four-variable (five levels of each variable) CCRD and a response surface methodology (RSM) were used to understand the interactions of GMS, MC, PC, and WT on the quality of foam in 30 runs, of which 16 were factorial, eight were axial, and six were at centre point (Montgomery 2001).
1454
Food Bioprocess Technol (2011) 4:1450–1458
The response functions y (dependent variables) were FD and DV. The following second-order polynomial model was fitted to the dependent variables with the experimental data (Eq. 1). y ¼ b0 þ
4 X i¼1
bi Xi þ
4 X i¼1
bii Xii2 þ
3 X 4 X
bij Xi Xj
ð1Þ
i¼1 j¼iþ1
The coefficients of the polynomial are represented by β0 (constant term); βi (linear effects); βii (quadratic effects); βij (interaction effects), and Xi’s are the coded independent variables. Regression analysis and analysis of variance (ANOVA) were conducted for fitting the models represented by Eq. 1 and to examine the statistical significance of the model terms. The adequacy of the models were determined using model analysis, lack-of-fit test, and R2 (coefficient of determination) analysis (Lee et al. 2000; Weng et al. 2001; Kaur et al. 2009; Mangaraj and Singh 2009; Tripathi and Mishra 2009b). The significance of all the terms in the polynomial was judged statistically by computing the F value at 5% significance level. Response surfaces and contour plots were generated with the help of commercial statistical package, Design-Expert (2002)— version 6.0.4 STAT-EASE, Inc., MN, USA. Optimization Numerical and graphical optimization was carried out for the independent variables to obtain the foam with minimum FD (i.e., maximum foam expansion) and minimum DV (i.e., maximum foam stability) using Design-Expert software. Conventional graphical method was applied to obtain minimum FD and minimum DV. Predictive models were used to graphically represent systems. Contour plots of the response variables were utilized applying superimposing surface methodology to select optimum combinations of GMS, MC, PC, and WT for the production of bael fruit pulp foam.
Results and Discussion The observations for FD and DV with different combinations of the independent variables are presented in Table 2. Analysis of variance showed that the models are highly significant (p < 0.001) for both the responses (Table 3). The lack-of-fit (Table 3) was insignificant in case of FD and DV, indicating that these models are sufficiently accurate for predicting those responses. The coefficient of determination (R2) values of both the responses was 0.909 and 0.965 indicating high proportion of variability was explained by the data and the RSM models were adequate.
Table 3 Regression coefficients and ANOVA of the second-order polynomial model for the response veriables (in coded units) Variables
DF
Estimated variables
F values
FD
DV
FD
DV
Model X1 X2 X3 X4 X1 X2 X1 X3 X1 X4 X2 X3 X2 X4
14 1 1 1 1 1 1 1 1 1
0.650 −0.035 0.042 0.034 0.015 0.005 −0.005 −0.006 0.012 0.003
1.080 −0.130 −0.960 −0.130 −0.042 −0.062 0.063 0.063 −0.062 −0.062
10.68*** 30.03*** 42.56*** 28.90*** 5.89* 0.49 0.47 0.59 2.26 0.19
29.31*** 5.87* 345.00*** 5.87* 0.65 0.98 0.98 0.98 0.98 0.98
X3 X4 X12 X22 X32 X42 Lack-of-fit R2 Adj R2
1 1 1 1 1 10
0.011 0.031 0.010 0.021 0.006
0.063 −0.140 0.240 −0.140 −0.010
2.07 27.54*** 2.79 12.78** 1.09 3.17
0.98 7.87* 24.64*** 7.87* 0.04 1.80
0.909 0.824
0.965 0.932
***p