Proceedings of the World Congress on Engineering and Computer Science 2014 Vol I WCECS 2014, 22-24 October, 2014, San Francisco, USA
Optimized Web Based Method for 2D-Visualization of 3D Medical Images Masoud Davari Dolatabadi, Aras Dargazany, Hadis Nouri
Abstract—Current standalone systems in the area of Minimally Invasive Cancer Treatment (MICT) are not providing satisfying possibilities for researchers and Interventional Radiologist (IRs) to share their contributions. There are a lot of standalone simulation software implementations, which provide different services for the mentioned purpose. However, in all of the services, one of the most important concepts, transferring the experience which has gained from one simulated procedure, is missed. In contrast, by using a web based system, different communities would be capable of sharing the medical data and simulation. These potential advantages lead us to developing a web based system for visualizing the medical data. Furthermore, 2D-visualization and applying image processing algorithms in 3D medical images is one of the most important elements of the very front-end of the software framework and also technically demanding. Therefore, we are obliged to answer the question ”What is the efficient method for web-based 2D representation of 3D medical images in distributed system?”. Based on the evaluation of performance result in different test cases, such as evaluating the architecture, method usage and modularity in distributed systems, and readability of the most used case scenario image extension (extensively publishing aided library) we propose an optimized method for 2D-visualizations of 3D medical images which can be accessed by any standard browser. Index Terms—Medical Image Visualization, Medical Image Processing, Web-Based Solution, Overlaying Models, Nifti-VTK data Manipulation.
I. I NTRODUCTION
Y
ET minimally invasive or noninvasive interventions are concretely moving forward to establish effective steps in curing diseases, which lead to reducing the pain and complication. What is yet required is to focus more on visualization technology advances, studies and estimating tools which are needed by physicians for treatment. These considerations will develop an impressive structure in biomedical studies and medicine. A. Motivation Imaging has become an important element of medical and laboratory researches. Doctors study the 3D volume of the human organs to diagnose the disease or dignify the exact organ malfunctions; radiologists quantify the tumors lesion from the CT scan. These are all researched in a very intensive format to prevent from prescribing an inappropriate medication in order to attack the main disorders. Analysis of these This work was supported in part by the Fraunhofer Institute for Applied Information Technology FIT. M. Davari is graduated from the Department of Computer Science, RWTH Aachen University, 52062 Germany (e-mail:
[email protected]). A. Dargazany is with the Department of Computer Science, 3049 D-67653 Kaiserslautern Germany (e-mail:
[email protected] Hadis Nouri, M.Sc. Student (email:
[email protected])
ISBN: 978-988-19252-0-6 ISSN: 2078-0958 (Print); ISSN: 2078-0966 (Online)
various types of image requires the complicated computerized visualization tools. By employing more equipped tools a precise decision will be concluded, for instance in the area of cancer treatment, whose more precise images leads us to the more accurate treatment. Nowadays, much visualization and analysis are performing in the non-distributed systems with the predefined hardware specification. Although the application domain of these standalone software has gained the large share of the user market in the last couple of years, these softwares are lacking the main secure concept in treatment which is real-time discussion. Moreover designing an independent platform which enables doctors to transfer their own experiences with another in special cases (special patients), is an issue. Visualization of n-dimensional data and platform-independent with different medical images modalities is an ideal work space. As an end-user application, the web-based interface provides a several vital and complicated image analysis and visualization tools. B. Contribution As it’s discussed earlier, by knowing the infra-structure of the project and essence of the image visualization in the cancer treatment; we are obliged to define the technical specification for representation of the medical images in the area. Since web-based method considered as the convenient solution for sharing and contributing the information; we established a 2D viewer based on 3D volume data. More importantly, we provide several services in a term of image processing functionality which enables users to interact with the 2D environment interactively. C. Outline This remainder of this paper is organized as follow: section II investigate on review state-of-the-art approaches and the existing literature in web based medical image visualization, section III proposes our approach in order to tackle the other approaches obstacles. Section IV evaluates the performance of approach for each contribution parallel and section V concludes the literature review in the paper and highlight the ideas for future. II. W EB -BASED L ITERATURE R EVIEW As the web-based method being the key issue of this survey, the similar work from two different perspectives will be analyzed. On the one hand, the available single purpose applications will be investigated which focus mainly on the research and scientific based representation. On the other hand, the multiple purposes solution will be presented which in addition to bio-medical researches, focuses on clinical diagnosis. These solutions made a lot of progress in medical
WCECS 2014
Proceedings of the World Congress on Engineering and Computer Science 2014 Vol I WCECS 2014, 22-24 October, 2014, San Francisco, USA image visualization development and more importantly could take a significant step in the diagnostics process. In principle these packages most of the computation overhead performed on the server-side and tried to keep a low cost on the clientside. In the following the first category will be presented.
reduction is another feature of this package which promises an acceptable interaction response. Using options for lowmemory usage in large-study viewing is a last overview of this framework. D. Web-Based Multilayer Visualization
A. The X Toolkit This solution is mainly using the WebGL/javascript library for visualization and allegedly this is a well-known toolkit for scientific visualization. The credit of this solution points to the Harvard medical school and Boston Children Hospital [6]. This useful library has been applied in several projects which we will accordingly introduce after highlighting the features of this toolkit. The main feature consist of opportunity to read diverse file format and Surface Models/Mesh Files such as (VTK (Visualization Toolkit), STL (Standard Tessellation)) and also DICOM/Volume Files such (NII(Nifti file), single file DICOMM format (NRDD, MGZ, and MGH)). B. SliceDrop Slicedrop is a famous platform for manipulating medical images in a web based platform. This package is known as x toolkit library demo. However, there is such a large number of packages using X toolkit as a library although slicedrop due to straight forward user interface counting proves the most applicable. Slicedrop supports a variety of scientific file format out of the box including DICOM, meshes, scalar overlays and fiber tracks. It uses WebGL and HTML5 Canvas to render the data in 2D and 3D. Web application mostly done in pure javaScript/jQuery and HTML5 and Completely client-sided. Moreover it posses and MIT License and is fully open source, making it openly accessible. The accessibility regarding file format is granted by using X Toolkit as a library which is supporting DICOM, Nifti, MGH/MGZ, NRRD, VTK Poly Data, Freesurfer, STL, TrackVis, ColorTable and Scalar. The last and foremost it is supporting Mesh and Scalar overlay. C. LEADTOOLS Medical Web Viewer Framework SDK This Developer kitenables users who are mostly programmers to develop quickly high standard feature and secure web medical image viewer applications. The OEM-Ready ASP.net web application uses web service streaming and LEADTOOLS features for an unsurpassed web experience for healthcare professionals. This technology is a rich clientsided viewer, in a term that computation overhead is handling in client side. MThe modularity design of this solution makes users to customize their required component in an acceptable way. The main important feature of this package is 3D reconstruction and 2D visualization of medical images. One of the newest support that this company and package provide is thin client image viewer for low bandwidth clients and mobile device with diverse operating system such as android and IOS. In addition to .Net technology which has been used in this framework LEADTOOLS also used HTML5, javascript DICOM viewing and PACS communication for cross-platform DICOM imaging. Client caching of downloaded image data for fast reloads and network traffic
ISBN: 978-988-19252-0-6 ISSN: 2078-0958 (Print); ISSN: 2078-0966 (Online)
Since the result of investigation in medical visualization domain lightened the role of education more than diagnostics in web-based solutions. Thus in this solution package, the question, ”what is the result of evaluation in web based medical image visualization?”, will be answered in order to understand the user needs and implement such a system for concrete purpose. 3D visualization is in a direct relation with 2D representation, in a way that visualization in virtual space provides such depth information for 2D representation. Hence by providing such a web based system for user to interact in 2D/3D visualization, usability evaluation would directly form. There are some user studies which highlight this evaluation; as in this evaluation some methods for visualization has been proposed we just here name the used technology in this section and we analyses the experimental research in the evaluation section of this thesis later on. [10]Predominantly in the initial scientific methods, medical images visualized over the web by suing XD modeling. However, this player is restricted in interaction and operation. [14] Actually there is a framework which extensively using this player. In the early work in [14] scientific research they proposed a framework uses Web 3Ds standard file format which is applicable for web services and contain all interactive 3D content. X3D is ISO standard file format, which is XML-based. As this framework has a modular design pattern thus they integrate it with web based Model View Controller (MVC) framework which they accordingly introduced it in their previous works. This method is more focus in constructing the 3D model from 2D cross-sectional based on the marching cube algorithm that creates triangle models of constant density surfaces. This solution does not provide that much functionality and more importantly not support variety of medical data format. One major issue in this framework is browsing through reconstructed model, which needs continuous page reloading and to some extend is unnecessary for 2D models. E. Web Interface for Visualization By flipping the pages through scientific researches we will come up with some methods which have been exclusively proposing web-accessible image visualization for medical application. This method is a well-structured method between all researches, and for that I found it important to introduce it in this section. This medical software provides 2D and 3D medical data representation whereof we mostly focus here on 2D visualization. Abstractly this web interface solution uses HTML5 and WebGL technology and allows the user to interact and visualize an image in an out-ofcore (OOC) manner which will be introduced later in this section. Basically the work flow of their approach is based on the excessive communication between server and client with remote procedure calls (RPCs). In other words, medical image data is first uploaded to the server, what allows handling a lot of format. Subsequently, it communicates via
WCECS 2014
Proceedings of the World Congress on Engineering and Computer Science 2014 Vol I WCECS 2014, 22-24 October, 2014, San Francisco, USA
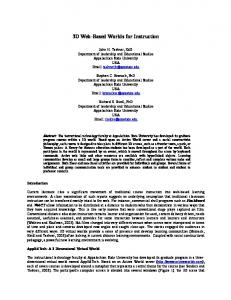
Fig. 1. This scheme demonstrate architecture of the presented Web Interface
RPC with the client side in order to finish the process of visualizing the medical data with simple manipulation of received string messages. Figure 2 will demonstrate this transaction much better [7]. All in all a web-based platform is necessary for data visualization due to the following advantages; it is the dramatic growth of medical data, which is centralized repositories, can make a stable base for diagnosis and research purposes. Secondly development process in improving the application and researches due to the direct interaction of end-users is much faster. Ultimately, due to advances in image acquisition, medical data set requires a large RAM capacity [7]. As explained above in the architecture, files will be uploaded to the server and then with an asynchronous process JavaScript and XML (AJAX) will be revealed to the user. For the client side communication considered JSON parameters as the important platform for RPCs between server and client side. After getting to know the infrastructure of the framework, we will discuss now the front-end and features of this solution. This package like the similar packages focused more on DICOM and VTK. Thus they implemented a C++ application on the server which hand over the required data through the JSON messages. It is obligatory to say that due to wide usage of VTK library in image processing they tend to use MetaImage format (”.mhd” header to indicate necessary information to read the corresponding volume data). Thus by simple communication between server and client they send meshes data over a time and visualized it on the client side. F. Web-based interactive 2D/3D medical image processing and visualization software This solution is also categorizing in the web based systems packages. The first important aspect that it has been mainly addressed is the conventional user interface. Basically the main problem of all web based user interface is that after every interaction the entire page should be reloaded. This type of the client-server interaction doesn’t let developers to provide a maximum feature with good quality for user [4]. Thus in the following the process of solving this problem will be discussed and also techniques and algorithm interface will be explained. In Web user interface based on the design, the main goal is developing a web application which is available across all types of clients. Therefore the best and most important option for this purpose is JavaScript which
ISBN: 978-988-19252-0-6 ISSN: 2078-0958 (Print); ISSN: 2078-0966 (Online)
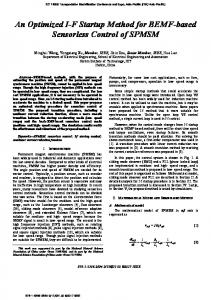
Fig. 2. ture
This scheme demonstrate Client/Server Communication Architec-
is an excellent choice for handling the client UI. Their main challenge is summarized in usability of JavaScript and passive client tools. In the other word, there are some limitation in interaction between client and server. Basically JavaScript requires all information reside in the client side, in order to completely accomplish the interactions. Therefore to tackle the problem necessity of continuous connection between clients and sever for two purposes is essential, first to answer the problem second to make the application as interactive as possible. This technology conceptually is combination of AJAX and JavaScript [9]. By this combination the web page refreshment for transferring data and connection establishment will be eluded. The communication protocol is also established based on the XML framework which is based in HTTP protocol (Figure 3). Surprisingly this combination has solved security problems and does not make them to setup new security and managing facility other than conventional web browsing setting. [9] III. M ETHOD P ROPOSAL In order to implement an optimized system and reliable infrastructure design, some assumptions and also several key points of visualization should be declared. They are based on the user’s needs, which here are represented by the ones of radiologists and biologists. Firstly, the definition of the data type of medical images is essential, which in the current case study the most required formats are Nifti and VTK data type; therefore for the future implementation of the approach, a good understanding of these two data types is required. Since the implementation of an optimized system is totally dependent to the system requirements and system behaviour observation, it shall be here mainly focused
WCECS 2014
Proceedings of the World Congress on Engineering and Computer Science 2014 Vol I WCECS 2014, 22-24 October, 2014, San Francisco, USA on opening up the main needs from different points of view and divide the problem to appropriate sub problem then try to find an appropriate answer for sub questions. Understanding the requirements of a system as the first factor can provide concrete answers for different parts of our software architecture. From a scientific point of view, systems generally will be made based on the right definition of requirement and more importantly the right definition of interactions. Eventually our system will be built upon the interaction and requirement information. Optimization in web based application, is regularly pointing at the Performance Objectives (PO’s) in the domain of interest. Therefore in the issue of design, identifying and considering the critical use cases, risk performance evaluation and the last and foremost PO’s establishment are essential. By taking performances into account, essential objectives for performance assessment should be named, such as: Response time, Throughput, Resource Utilization, and Workload. As medical doctors are always dealing with images for diagnostics, they should be able to change and also modify the images intuitively with an acceptable response time from system. The first and foremost important part of precise visualization is orientation and voxel ordering technology. When dealing with medical data especially MRI’s data, orientation terminology and conventions are in fact vital factors. A. Functionality Requirements Actually for the better understanding of the system design we need to know ”what user needs are” and ”how user wants to interact with the system”. Answering to these two questions, notably leads us to tackle the presented problem. In order to point out the user requirements, first we need to define the users which are going to work and interact with the system. Functionality of the system is as following: • Three 2D viewer for representing the medical images in different direction of view (Axial, Sagittal, Coronal) • Loading Nifti file data type. • Information Seeking Mantra • Loading and Reading VTK files: VTK file are representing the meshes of the 3D Volume. This function is one of the main functionality for the future implementation. The first and foremost important part of precise visualization is orientation and voxel ordering technology. When dealing with medical data especially MRI’s data, orientation terminology and conventions are in fact vital factors. By taking orientation of original image and related technical definitions such as Medical image analysis, 2D Contour and Overlaying Models, and Orthographic View into account; this approach will be designed and implemented. B. Technical Definitions 1) The NIFTI-1 Data Format: This data format originated from the Data Format Working Group in the Neuroimaging Informatics Technology Initiative (NIfTI) and the development has been supported by the National Institute for Health (NIH)[3]. 2) VTK File Format: There are two different styles of VTK file format. The first and simplest is legacy, a serial format that is easy to read and write either by hand or programmatically. The second format is a XML based one
ISBN: 978-988-19252-0-6 ISSN: 2078-0958 (Print); ISSN: 2078-0966 (Online)
which supports random access, parallel I/O, and portable compression. Basically the XML based one is mostly preferred to the serial format. Content of this section has mainly investigated from chapters of [13] book. C. Approach Proposal Pipeline As a matter of problem definition in design of web based application and more importantly optimized system, the study of the use cases and scenarios is playing a major role. A web based system seeked, which can provide a shared platform for medical doctors to visualize the medical data images such as (Nifti and VTK). Moreover it should enable users to adjust the contrast, mesh overlaying and other image processing functionality. Here as a manner of approach definition, a simple use case will be discussed. By providing concrete answers during the use case scenario, the final approach will be investigated. As mentioned earlier, to answer the simultaneous and effective diagnosis, especially in cancer treatment, the essence of a web based application is more and more tangible. By answering the question, ”what is the appropriate architecture of the web based system which can mainly answer the user requirement and also can satisfy the quality of user interaction evaluation?”, method would be designed and established. The basic scenario of the system work flow is as following. Medical doctors or researchers first enter the information of the patients, and then upload the volumetric medical data model, accordingly in this actual step several parallel scenarios is possible. The user can either run the simulation or segmentation procedure whose output of the nifty manipulation will be vtk mesh formats, or the user can run the system in the 3D viewer which is a windows application or mainly run the 2D viewer to see the volumetric data which can be in different data types. Therefore here the question arises, what are the suitable options for the web based development, which mainly target the above system work flow. As discussed earlier in the related works, web based applications are mostly using some specific framework, which is not matched to mentioned system requirements. They are using webGl library which mostly handles all the user interaction. These web-based methods based on the mention engine are basically consuming enormous client’s memory and delay is an unavoidable factor of their system. Therefore, in order to tackle the problem, in this paper a system pipeline has been implicitly proposed in which three essential functions for visualization of medical images in web based platform has been addressed. This solution pipeline mainly address the reading of different medical file formats such as VTK and Nifti. Moreover overlaying of these two format for image validation. And the last and least is contrast adjustment for the medical images with an acceptable responsiveness. In the following, the contribution for each section of this system pipeline has been introduced and investigated. By summing up of every feasible method in each section the final contribution which is a web based platform system with certain functionality will be derived. 1) VTK Library: VTK library implementation (JavaScript Library) is totally independent from the architecture of the system. By implementing a fully client sided VTK library, one of the main part of the architecture has answered with an acceptable responsiveness.
WCECS 2014
Proceedings of the World Congress on Engineering and Computer Science 2014 Vol I WCECS 2014, 22-24 October, 2014, San Francisco, USA
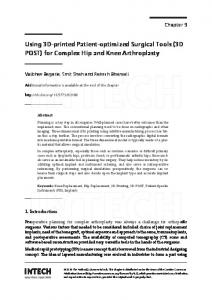
Fig. 3.
This scheme illustrates Architecture of the Proposed system
2) NIFTI Visualization: Based on the categorized items in requirement section, earlier in this section, reading nifti file has sorted out as a vital required task. For making any interaction with nifti file first the feasibility study, in order to define a current options for implementing, should be accomplished. Server-Client Method: As it appears from the title, the first option for reading a whole nifti file is implementing some part on the server side and the other half on the client. This method has got its own advantages. Basically when the user uploads the whole nifti file on the server, he or she is able to use this uploaded file for several times and in any different cases. In other words, there is no such a need for a user to download the whole file every time in case of need. As there are several libraries in C++ and python for nifti manipulation, the idea of implementation of nifti section on the server seems quite feasible and fast to implement. ITK snap is providing such a good documentation and library for this volume dataset manipulation. By tackling the problem of reading, fundamental infrastructure for showing the files on the web platform is needed. Therefore by implementing such an application on the server side which does the slicing of the volume dataset in three different directions, and by outputting each slice in ”png” format, the fundamental requirement will be addressed. Later in this section the implementation pieces and also the reasons for choosing ”png” will be discussed more in detail. After doing the manipulation and also slicing, all images will be stored in the web server with appropriate name path and address. Implicitly for accomplishing the tasks above, there is a need of two servers, a main server which can handle the slicing and calculation algorithms, and the web server which provides the web services. In the server side implementation apart from slicing we need an invoker. To some extend this invoker is handling the communication with web server in order to create and transfer the data and messages. The invoker is implemented in a script language. This python script performing several tasks like sends/receives the message to/from the web server, download/ upload files from/to webserver and executing the slicing program. In the Figure 4 the design for better insight of the whole architecture of this system will be demonstrated.
ISBN: 978-988-19252-0-6 ISSN: 2078-0958 (Print); ISSN: 2078-0966 (Online)
3) Contrast: In Greyscale to RGB encryption Method, while slicing application is producing ”png” files on the server, the greyscale value of each pixel will be generated into the combination of three color channels of each pixel. In other words, the 16 bit image data will be split to two bytes and place the first byte into the red value channel and second byte into the green value channel. After applying this compression, medical data easily right in a time of visualization will be read and manipulated. However his method is using the same transfer function for adjusting the contrast. This method is drastically faster than the other contrast adjustment methods. CT images are encoded in a standardized way - so called Hounsfield units. It should be a 12 bit value (4096 different grey values), the range is from 1024 to 3071 (the value -1000 is by definition air, or the black background in the image, the value 0 represents water). The human visual system is not capable to differentiate several thousand grey values, so the windowing system comes into play(Window Center and Window width). The basic concept of these terms is simple. These two parameters used to apply a linear greyscale transform function. Based on the investigation on medical image data, there are some certain numbers for defining these values. Window Center and Window specify a linear conversion from stored pixel values to values to be displayed. Window Center contains the input value that is the center of the window. Window Width contains the width of the window. Window width shall always be greater or equal than 1. In case more than 1, ranges of input values will be mapped to the full range of the display output. When Window Width is equal to 1, they specify a threshold below which input values will be displayed as the minimum output value. Basically 12 bits data is include pixels between 0-4096, the data that we have for greyscale images is between -2048 to 2048. Therefore after applying an appropriate transformation to generate a valid range data, the mapping formula to map from 12 bits to 8 bits will be applied. Only a fraction of these values will be taken and displayed on the screen. The grey values, which are displayed, are defined by two parameters: center (c) and width (w) together, they are defining a ”window” with a range from c - w/2 to c + w/2. Values below c - w/2 are black, values above c + w/2 are white, the interpolation in between is linear. IV. E VALUATION As a manner of evaluation the complete system under concrete circumstances has been tested. In this evaluation, testing the timing of a whole cycle from uploading the file, slicing the nifti file and visualizing each file with interaction is issue of evaluation. Table 5.1 enlightened this evaluation result insightful. The average time for visualizing the PNG file in canvas with just mouse click interaction is 234 millisecond and the average time for images by scrolling is around 271 millisecond. The output pixel text file is around 323 Mb for StudieSchwein3HelixIMPPACTSCHWEIN file. This is notably in comparison with PNG file formatand more then what has been expected. In this part the evaluation for reading the VTK file with the millisecond precision will be shown. The following table shows the reading time precision.
WCECS 2014
Proceedings of the World Congress on Engineering and Computer Science 2014 Vol I WCECS 2014, 22-24 October, 2014, San Francisco, USA TABLE I F ILE I NTERACTION RESULT Volume (Format)
Dimension
291 × 378 × 378 StudieSchwein 512 × 512 × (Nifti) 91 Ablation 291 × 378 × (Nifti) 378 Liver (nifti)
Meta Image Space 82 Mb 46 Mb 40 Mb
Slicing Time
PNG Space
26.15 Second 41.15 Second 17.15 Second
4.2 Mb 19 Mb 4.2 Mb
TABLE II R EADING VTK F ILE F ORMAT Mesh (Format) Ablation (VTK) pv vessel (VTK)
File Size 578 KB 5.176 MB
Vertices 6790 63706
Triangle 13576 127408
Reading Time 4045 mSecond 7023 mSecond
treatment in the same use case scenarios, which consequently leads them to find an efficient treatment for a patient. As proposed above in web based approaches, they are mostly focusing on balancing the computation overhead in server and client. But still the main image processing functionality is handling on the server side which is bringing some dependency such as internet connectivity and stability. These two factors make us to think of a novel and efficient approach which addresses the ubiquitous medical image processing by eluding the connectivity limitation. An approach which handles the important medical image data visualization such as nifti and vtk meshes and image segmentation with an acceptable responsiveness. B. Future Work
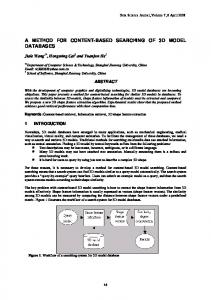
The reading time for files is constantly changing and dependent on the internet speed. In our test-bed area the download speed for doing the evaluation is around 469.30 Mbps. It is important to mention that all the evaluation is basically occurred with this specification. Moreover, these values are approximate average numbers of loading in the above circumstances. As mentioned earlier, the output of some simulation files are in VTK format which contains several meshes. With the simple testing from the website, by reading a Thorax and overlaying with nifti images, an acceptable time delay around 13.27 second for all meshes in one file is observed. In the following figure the final view of the 2D viewer with loaded simulation file is demonstrated. V. C ONCLUSION AND F UTURE W ORK A. Conclusion In summary, the essence of precise visualization by demand of radiologists and interventional doctors is getting more and more severe. This essence would hover much more where an exact diagnosis followingly requires an appropriate treatment. As mentioned above, several software solutions are proposed in order to address this problem. However some of these packages are just answering academic and research studies. Based on this article classification, current software solutions in a domain of academic researches and also diagnosis are divided into two main categories. The first one is general literature, which is covering the current local based software solution and the second is more specific literature, which includes all web-based libraries, applications and the framework in the domain of medical image visualization. However, local based solution mainly bringing some advantages such as scaleability, fast responsiveness and robustness. They are restricted to a local system customization which brings many software and hardware limitations. These solutions are not relying on several doctors diagnosis and they are so-called single doctor oriented. Therefore despite of the general advantages, they are not addressing to the main issue which is reliable ubiquitous diagnosis. In contrast, in webbased solution packages, the main idea is providing a shared platform, in which users (Mostly interventional doctors and radiologists) are able to initiate their work flow and get a quick feed back regarding the testing of special treatment based on the specific characteristics. Doctors and especially radiologists will be well-informed regarding the other sample
ISBN: 978-988-19252-0-6 ISSN: 2078-0958 (Print); ISSN: 2078-0966 (Online)
This system offers all the necessary initial functionality such as those which has been mentioned in the user requirements section like Information Seeking Mantra, intuitive interaction, sliding the slices and real-time overlaying the nifti images with VTK meshes. There is an important functionality which is necessary for specific cases in cancer treatment e.g. needle insertion and placement. R EFERENCES [1] Isaac Bankman. Handbook of Medical Imaging: Processing and Analysis Management, pages 659–660. Academic Press, 2011. [2] Isaac Bankman. Handbook of Medical Imaging: Processing and Analysis Management, pages 685–686. Academic Press, December 2011. [3] Robert W. Cox, John Ashburner, Hester Breman, Kate Fissell, Christian Haselgrove, Colin J. Holmes, Jack L. Lancaster, David E. Rex, Stephen M. Smith, Jeffrey B. Woodward, and Stephen C. Strother. A (sort of) new image data format standard: NIfTI-1. NeuroImage, 22:1, 2004. [4] Elfriede Dustin, Jeff Rashka, and Douglas McDiarmid. Quality Web Systems: Performance, Security, and Usability. Addison-Wesley Longman Publishing Co., Inc., Boston, MA, USA, 2002. [5] Morton PE Dwyer SJ Glen Wv Jr, Johnson Rj. Image Generation and display techiniques for CT scan data, pages 403–416. 1975. [6] Daniel Haehn, Nicolas Rannou, Banu Ahtam, Ellen Grant, and Rudolph Pienaar. Neuroimaging in the browser using the x toolkit. Frontiers in Neuroinformatics, (101). [7] Hector Jacinto, Razmig Kchichian, Michel Desvignes, Rmy Prost, and Sbastien Valette. A web interface for 3d visualization and interactive segmentation of medical images. In Web3D’12, pages 51–58, 2012. [8] Bruce A. Kall Frederic B. Meyer Richard A. Robb Lisa M. Bates, Dennis P. Hanson. Implementation of an oblique-sectioning visualization tool for line-of-sight stereotactic neurosurgical navigation using the avw toolkit. SPIE 3335, Medical Imaging, 3335(219), 1998. [9] Seyyed Ehsan Mahmoudi, Alireza Akhondi-Asl, Roohollah Rahmani, Shahrooz Faghih-Roohi, Vahid Taimouri, Ahmad Sabouri, and Hamid Soltanian-Zadeh. Web-based interactive 2d/3d medical image processing and visualization software. Comput. Methods Prog. Biomed., 98(2):172–182, may 2010. [10] Chueh-Loo Poh, R. I. Kitney, and R. B.K. Shrestha. Addressing the future of clinical information systems—web-based multilayer visualization. Trans. Info. Tech. Biomed., 11(2):127–140, March 2007. [11] Rob Ra. Three-Dimensional Biomedical Imaging Principles and Practice. VCH, New York, 1994. [12] Azzawi YM Rhodes ML, Glen Wv Jr. Extraction oblique plan from serial CT sections, pages 649–654. 1980. [13] William J. Schroder, Kenneth M. Martin, and Lisa S. Avila. VTK User’s Guide - VTK File Formats, chapter 14. Kitware Inc., 2000. Section on VTK File Formats published independently. [14] S. Settapat, T. Achalakul, and M. Ohkura. Web-based 3d visualization and interaction of medical data using web3d. pages 2986–2991, Aug 2010. [15] Paul Suetens. Fundamentals of Medical Imaging, pages 158–159. Cambridge University Press, 2009.
WCECS 2014