Data Science Journal, Volume 7, 8 April 2008
A METHOD FOR CONTENT-BASED SEARCHING OF 3D MODEL DATABASES Jiale Wang1*, Hongming Cai2 and Yuanjun He1 *1
Department of Computer Science & Technology, Shanghai Jiaotong University, China Email:
[email protected] 2 School of Software, Shanghai Jiaotong University, China
ABSTRACT With the development of computer graphics and digitalizing technologies, 3D model databases are becoming ubiquitous. This paper presents a method for content-based searching for similar 3D models in databases. To assess the similarity between 3D models, shape feature information of models must be extracted and compared. We propose a new 3D shape feature extraction algorithm. Experimental results show that the proposed method achieves good retrieval performance with short computation time. Keywords: Content-based retrieval, Information retrieval, 3D shape feature extraction
1
INTRODUCTION
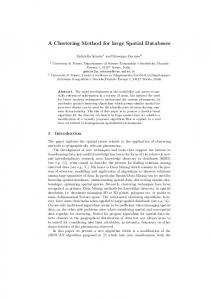
Nowadays, 3D model databases have emerged in many applications, such as mechanical engineering, medical visualization, virtual reality, and computer animation. To facilitate the management of these databases, we need a way to search and retrieve 3D models. Traditional methods for searching multimedia data use attached information, such as textual annotation. Finding a 3D model by textual keywords suffers from the following problems: z Text descriptions may be inaccurate, incorrect, ambiguous, or in a different language. z Many 3D models may not have attached text annotation. Manually annotating them is a tedious and error-incurring work. z It is hard for users to query by using just text to describe a complex 3D shape. For these reasons, it is necessary to develop a method for content-based 3D model searching. Content-based searching means that a search system can find 3D models similar to a query model automatically. The search system provides a “query-by-example” query interface. Users can submit an example model as a query, and then the search system returns models according to their shape similarity. The key problem with content-based 3D model searching is how to extract the shape feature information from 3D models effectively. Shape feature information is usually expressed as vectors (shape feature vectors). The similarity among 3D models can be measured by computing the distance between shape feature vectors under a predefined metric. Figure 1 illustrates the workflow of a search system for 3D model databases.
Figure 1. Workflow of a searching system for 3D model database
46
Data Science Journal, Volume 7, 8 April 2008
This paper proposes a new shape feature extraction algorithm, which is an enhanced version of the traditional D2 shape distribution. We implemented a demonstration instruction 3D model search system based on the proposed method. Experiments show that the performance of the system is satisfactory. The rest of the paper is organized as follows: some related work is summarized in Section 2. In Section 3, we discuss the problem of a traditional D2 approach and describe our method in detail. Section 4 presents a demonstration instruction 3D model search system based on our method with experimental results. Finally, conclusions are given in Section 5.
2
RELATED WORK
In recent years, researchers have proposed many shape feature extraction algorithms. These algorithms can be generally classified into two groups: variant and invariant (Tangelder & Veltkamp, 2004). Because a 3D model may have an arbitrary position, size, or pose in 3D space, when using a variant shape feature, models need to be normalized for translation, scale, and rotation before assessing shape similarity. Studies have found that the traditional methods for translation and scale normalization provide good search results, but methods for rotation normalization are not robust. The PCA (Principal Component Analysis) is a commonly used method for rotation normalization. In the literature (Funkhouser et al., 2003), it is found that some similar 3D models have different principal axes defined by PCA. An invariant shape feature describes any transformation of a shape in the same way and doesn’t need normalization. Because of the lack of an effective method for rotation normalization, how to extract a great deal of rotation-invariant shape features attracts great interest. Osada et al. (2002) proposed a rotation invariant shape feature extraction algorithm called D2 shape distribution. D2 describes the shape feature of a 3D model by calculating the distribution of distances between random points on the surface. D2 has many good properties, such as quickness in computation and concise storage. Experiments by Osada et al. demonstrate that D2 can effectively discriminate grossly dissimilar models. However, it is possible that dissimilar models may have very similar D2 histograms. To reduce this problem, this paper proposes a new D2 shape distribution that works on 3D models represented as voxel models.
3
SHAPE FEATURE EXTRACTION
Osada’s D2 algorithm works on 3D mesh models. A mesh model defines a 3D object by describing its surface. There are two main steps in Osada’s approach: 1) generating random points on the surface of a 3D mesh, and 2) calculating distances between every pair of points and forming a histogram of these distances (see Figure 2). In a D2 histogram, the horizontal coordinate denotes the distance between points, and the vertical coordinate denotes the calculated frequency of the D2 distance distribution function. For a given distance d and a point set P , the D2 distance distribution function at value d can be expressed by the following equation:
D 2(d ) =
{∀p, q ∈ P s. t. p − q = d } P
where
2
p − q denotes the Euclidean distance between p and q , and • is the cardinality of a set.
47
(1)
Data Science Journal, Volume 7, 8 April 2008
Figure 2. D2 shape distribution Because Osada’s D2 approach only uses a simple distance distribution to describe 3D shape, it is possible that dissimilar models have similar D2 histograms. We can see in Figure 3 that a table and a car have very similar D2 histograms.
Figure 3. D2 histograms of a table and a car To improve the discriminability of D2, we can enrich the distance information by differentiating the inner and outer line segments between a pair of sampling points. This idea is illustrated in Figure 4, where Pi Pj is the line segment between two sampling points Pi and Pj . Pi G is the part of Pi Pj that is inside the model. The distribution of the ratio Pi G / Pi Pj
can be used as a supplement to help the D2 algorithm filter out dissimilar
models. We denote the distribution of this ratio as DIR.
Figure 4. Inner and outer line segments between two sampling points
48
Data Science Journal, Volume 7, 8 April 2008
Figure 5. DIR histograms of the table and the car Figure 5 illustrates the DIR of the table and car from Figure 3. We can see that the two DIRs are obviously different. The DIR of the table indicates there are many low ratios because the table is generally a concave model and many line segments lie outside it. In contrast, the car is rather convex, so there are a large number of line segments inside it, and its DIR is dominated by high ratios. Generally DIR provides additional shape information than provided by D2. We can use the DIR to filter out dissimilar models that D2 is unable to distinguish. The dissimilarity between 3D models A and B can be measured by a weighted sum of D2 and DIR:
Dist ( A, B ) =
w1 D 2( A, B) + w2 DIR( A, B) w1 + w2
(2)
where w1 and w2 are weights for D2 and DIR. In the later of this section, we will discuss how to determine these weights through user feedback. D 2( A, B ) and DIR respectively:
DIR( A, B) compute the L1 norm of the histograms of D2 and
D 2( A, B) = HistogramD 2 A − HistogramD 2 B
(3)
DIR( A, B) = HistogramDIR A − HistogramDIRB
(4)
Suppose that a histogram contains n bins: h = {v1 , v2 ,...vn } . The L1 norm of histograms is computed as the following equation: n
ha − hb = ∑ vai − vbi
(5)
i =1
To facilitate computing the length of inner and outer line segments, we convert 3D models into a voxel model. The voxel model is a type of 3D data that uses volume elements (voxels) to represent an object in discrete 3D space (Kaufman et al., 1993). A voxel is a cubic unit of volume that can be seen as the 3D counterpart of the 2D pixel representing a unit of area. Mesh models just define the surface of objects. Thus it is difficult to determine which part of a line is inside or outside the models. On the contrary, a voxel model is a 3D solid, of which the inner and outer are explicitly defined. It is easy to determine which part of a line is inside or outside on voxel model. For surface-based models in 3D continuous space, such as mesh or B-rep, the computer graphics community has proposed algorithms that can convert them to voxel models very quickly by exploiting the hardware acceleration of display adapters. Figure 6 illustrates a 3D mesh model and its corresponding voxel model.
49
Data Science Journal, Volume 7, 8 April 2008
Figure 6. A mesh model and the corresponding voxel model The voxel model also provides a way to accelerate the calculation of DIR. When calculating the length of an inner line segment, one needs to repeatedly calculate whether the line intersects with a voxel. To accelerate the line-voxel intersection calculation, we can employ the octree-based spatial subdivision. Octree (Samet, 1990) is a hierarchical representation that subdivides the full voxel space into octants. When testing the intersection between the line and voxels, the octree structure can reduce the computational complexity significantly by searching through the voxel space hierarchically. In Equation (2), we use a weighted sum to combine two metrics D2 and DIR into a unified metric. To determine the weights w1 and w2, we use the information from Relevance Feedback (RF) to estimate them. RF makes the search process an interaction between the computer and user. For an RF-based search process, the system first retrieves similar models and returns them to the user. Then, the user provides feedback regarding the relevance of some of the retrieval results (the user marks the relevant models in the results and submits them back to the search system). Finally, the system uses the feedback information to improve the performance in the next iteration (Baeza-Yates et al., 1999, Rui et al., 1998). w1 and w2 should respectively reflect the effectiveness of D2 and DIR in retrieval. The more tightly a metric makes the known relevant objects distribute in its feature space, the more effective it is. Suppose that q denotes a query and R is the set of relevant models marked by user in the initial retrieval results. w1 and w2 are estimated by the following equations:
'
For a given element ri , m axdis is the maximum of distances between
ri' and all other elements in R ' under the
metric D. D denotes the metric D2 or DIR (when t=1, D is D2; when t=2, D is DIR). The sum of m axdis over all elements in R ' reflects the tightness of known relevant objects. A smaller sum indicates a tighter set and vice versa. In our tests, the initial values of w1 and w2 were both set to 0.5. Then we use over 200 queries and corresponding feedback sets to estimate heuristically the weights w1 and w2. We obtain that w1 =0.63 and w2 =0.37.
50
Data Science Journal, Volume 7, 8 April 2008
4
EXPERIMENTAL RESULTS
We use the PSB (Princeton Shape Benchmark) (Shilane et al., 2004) to evaluate the performance of the proposed method. We compare the proposed method with three other rotation invariant shape feature extraction algorithms: Osada’s D2, shell histogram (Ankerst et al., 1999), and sphere harmonics (Kazhdan et al, 2003).
We employ the “precision-recall” curve method (Raghavan et al., 1989) to measure retrieval performance. “Precision” measures the ability of the system to retrieve only models that are relevant, and “recall” measures the ability of the system to retrieve all models that are relevant. Let C be the number of relevant models in the database (namely the number of models in the class to which the query belongs). Let N be the number of relevant models that are actually retrieved in the top A retrievals. Then, precision and recall are defined as follows:
precision =
N A
recall =
N C
(7)
There is a trade-off between precision and recall. In recall-precision diagrams, a perfect retrieval result would produce a horizontal line at the top of the plot. Otherwise, a curve closer to the upper-right corner represents better performance.
Figure 7. Precision-recall plots Figure 7 shows the precision-recall plots of the four tested methods. We can see that the precision of the proposed method is close to that of sphere harmonics and is obviously better than that of the other two. Figure 8 illustrates some search results returned by our method. The model in the green box (upper left corner) is the query model. Models in blue boxes are correctly retrieved models, and models in red boxes are the mismatched ones.
51
Data Science Journal, Volume 7, 8 April 2008
(a)
(b) Figure 8. Search results of the proposed system (a) results of a query model of human body (b) results of a query model of sword Table 1 lists the average computation time of the four methods. The computation time of the proposed enhanced D2 method is much less than that of sphere harmonics and is only a little more than that of Osada’s D2 approach. Table 1. Average computation time
Times
Shell histogram 2.02
Osada’s D2
Our method
4.11
4.83
52
Sphere harmonics 7.02
Data Science Journal, Volume 7, 8 April 2008
5
CONCLUSION
In this paper, we present a method for searching 3D model databases. A new 3D shape feature extraction algorithm is proposed, based on the voxel representation of 3D models. We implement a demo instruction search system based on the proposed shape feature extraction algorithm. Experiments show that the system achieves a good performance.
6
ACKNOWLEDGEMENTS
This work is supported by the National Natural Science Foundation of China (No. 60603080) and Aeronautical Science Foundation of China (No. 2007ZG57012)
7
REFERENCES
Ankerst, M., Kastenmuller, G., Kriegel, H.P., & Seidl, T. (1999) 3D shape histograms for similarity search and classification in spatial databases. In Proceedings of International symposium on Spatial Databases (SSD), China, pp. 207–226. Baeza-Yates, R., Ribeiro, B. (1999) Modern information retrieval. Addison Wesley. Funkhouser, T., Min, P., Kazhdan M., Chen, J., Halderman, A., Dobkin, D., & Jacobs, D. (2003) A search engine for 3D models. ACM Trans. Graph., Jan. 22(1), pp. 83-105. Kaufman, A., Cohen, D., & Yagel, R. (1993) Volume graphics. IEEE Computer, 26(7), pp.51-64. Kazhdan, M., Funkhouser, T., & Rusinkiewicz, S. (2003) Rotation invariant spherical harmonic representation of 3D shape descriptors. Symposium on Geometry Processing, June, 2003. Osada, R., Funkhouser, T., Chazelle, B., & Dobkin, D. (2002) Shape distributions. ACM Trans. Graph., 21(4), pp. 807–832. Raghavan, V., Bollmann, P., & Jung, G.S. (1989) A critical investigation of recall and precision as measures of retrieval system performance. ACM Trans. Inf. Syst., pp. 205-229. Rui, Y., Huang, T.S., Ortega, M., Mehrotra, S. (1998) Relevance feedback: A power tool in interactive content-based image retrieval. IEEE Transactions on Circuits and Systems for Video Technology, 8(5), pp. 644-655. Samet, H. (1990) The design and analysis of spatial data structures. Addison-Wesley Publishing Company Shilane, P., Min P., Kazhdan, M., & Funkhouser, T. (2004) The princeton shape benchmark. In Proceedings of Shape Modeling International, Italy, pp. 167–179. Tangelder, J. & Veltkamp, R.C. (2004) A survey of content based 3D shape retrieval methods. In Proeedings of Shape Modeling International, Italy, pp. 145-156.
53