Optimizing Performance of Web Service Providers Dmytro Dyachuk, Ralph Deters Department of Computer Science University of Saskatchewan
[email protected],
[email protected]
Abstract A workflow aggregates the underlying Web Services in a manner consistent with the desired functionality. Since CWS can contain atomic and other CWS they encourage the development of service layers and reuse of already existing functionality. However deployment of the service compositions becomes possible only after an adequate performance of CWS is assured. Due to the constantly increasing complexity of the underlying services interaction, a CWS can exhibit problematic and often difficult to predict behaviours in overload situations. This paper focuses on the use of request scheduling for improving CWS performance in overload situations. Scheduling policies namely Shortest Job First, Least Work Reaming, Total Work and Fewest Operations remaining are studied in regards to their effectiveness in helping with constant and fluctuating loads. Keywords: Web Services, admission control, scheduling, Shortest Job First (SJF), Least Work Remaining (LWKR), Total Work (TWORK), Fewest Operations Remaining (FONPR), response time, Composite Web Services.
1. Introduction Services are the basic building blocks of the serviceoriented (SO) design/integration paradigm [1]. While service-orientation (SO) can be achieved using different technologies, Web Services (WS) are the most commonly used, due to the standardization efforts and the available tools/infrastructure. Web Services are based on three technologies: SOAP [2] (Simple Object Access Protocol), WSDL [3] (Web Services Description Language) and UDDI [4] (Universal Description, Discovery and Integration). These protocols make Web Services selfdescribed entities which can be discovered, bound and invoked at a runtime. Therefore Web Services technology represents a sufficient means for implementing serviceoriented architecture. A symbiosis of IDEs (Visual Studio, Eclipse) with the Web Service frameworks (e.g. AXIS [5], DotNet [6]) minimizes the burden of exposing application interfaces and/or binding existing services. As the result more and
more software vendors are enhancing abilities of their products by adding Web Service support. The introduction of service composition languages [7, 8] simplified the process of aggregating the underlying services in order to achieve more complex business goals. However there is a natural concern regarding performance of such applications, especially in transient overload situations. Studying the impact of overload situations on Web Services (WS) and Composite Web Services (CWS) is particularly important since the common approach is processing incoming service requests by assigning them to separates threads that are scheduled by Processor Sharing (PS) scheduling policy. PS assigns equal slices of processor time to each thread thus dividing it over all threads in a fair manner. However, an attempt to process a rather big number of requests results in a high number of spawned threads. And as a consequence fewer resources per thread are assigned, context switch costs go up, memory page faults rate increases, etc. This can be problematic in overload situations when the number of threads increases to a point when there are no longer enough resources to satisfy all threads. Since PS divides the resources equality over all threads, they begin to experience a slowdown leading to higher service response times and in extreme cases thrashing.
Figure 1. The Workflow Pattern Sequence Service overloads are particularly problematic in the context of workflows (e.g. CWS) since the behaviour of one service can impact that of the others. Figure one shows the most basic workflow patterns called sequence [9]. If a service in a sequence experiences an overload it will result in an increased (worse) response time that will propagate through the sequence resulting in an underutilization of the next in line services and an increased (worse) response time of the CWS[10]. Consequently, it is important to avoid overloads in interconnected services. This paper focuses on the use of request scheduling and admission control as mechanisms for improving CWS
performance in overload situations. Scheduling policies namely Shortest Job First (SJF), Least Work Remaining (LWKR), Total Work (TWORK), Fewer Operations Remaining (FOPNR) are investigated in regards to their effectiveness in helping with bulk arrivals. The remainder of the paper is organized as follows. The following section discusses service behaviours under various loads. Section three presents an introduction into adaptive load control and scheduling. The results of experiments using TPC-App and simulations are presented in section four. Section five provides a summary and an outlook on future work.
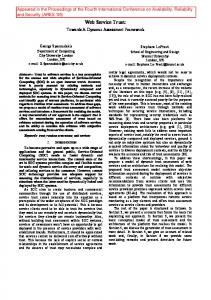
2. Providers & Overloads If a single provider is gradually exposed to an everincreasing number of service requests it first experiences a load that is below its capacity (underload). As the rate of incoming requests continues to increase, the server will reach its saturation point (peak load). This marks the point where the server is operating at its full capacity. The saturation point marks also the highest possible throughput. Further increases of the request arrival rate leads to an overload and ultimately the thrashing effect due to resource or data contention. A particularly interesting aspect of provider overloads is how arrival rates are transformed into overload specific departure rates. Figure 2 shows the interdeparture times for a provider that experiences a light overload of 1000 jobs that arrive at a constant arrival rate of 1 job/second and are each of size 120%. Since each job requires 100 % of resources for 1.2 seconds the provider enters immediately the overload phase.
them to depart increasingly faster. The most interesting aspect of the displayed departure rates is that a transient overload, with of a constant arrival rate (1 req/sec), leads to a departure rate that is no longer constant. While ca. 70 % of the jobs depart at a semi-constant rate (1/1.455) that is well below the arrival rate (1 req/sec), 5 % depart at a rate between 1/1.45 and 1 resp/sec and 20 % depart at rates of greater than 1 response/second which means that they depart faster than they originally arrived (speedup). This transformation of the once constant arrival rate into a no longer constant departure rate is particularly problematic when providers are orchestrated by a workflow. Exposing workflows that use sequence patterns to overloads leads to departure rates that are increasingly chaotic depending on the duration of the overload and the number of chained providers [10].
3. Adaptive Load Control and Scheduling Since transient overload situations are causing degradation in service throughput, it is important to avoid them. Heiss and Wagner [11] suggest employing adaptive load control as a means of eliminating overloads. According to this approach, initially the number of the simultaneously processed requests should be gradually increased. The point after which a decline in throughput is observed indicates the maximum number of parallel requests (e.g. maximum number of simultaneous consumers). Once the saturation point has been reached newly incoming requests can be buffered. The load control avoids thrashing by limiting the number of concurrent threads and buffering/queuing of requests above peak load.
1.6
3.1 Admission Control for Web Services
1.4
Departure Rate
1.2 1 0.8 0.6 0.4 0.2 0 1
54
107 160 213 266 319 372 425 478 531 584 637 690 743 796 849 902 955 Jobs
Figure 2. Behavior under various loads As can been seen in figure 2 there is a brief warm-up period in which the departure rates fluctuate. This is followed by a phase in which the interdeparture time stabilizes at 1.455. At job 690 the interdeparture time suddenly begins to drop (jobs leave faster). This drop marks the point when no longer new jobs arrive and the existing ones enjoy more and more resources which allow
Load control of a legacy service (e.g. WS, CWS) can be implemented in a form of a proxy. The proxy would shield the service provider thus enabling a transparent admission control [12-14]. The proxy is to monitor the number of concurrently processed client requests in order to prevent overloading. The requests exceeding the capacity of the provider are placed in a queue [fig. 3]. Transparent admission control has already proven its efficiency for handling requests bursts [10, 12, 13], especially if the requests impose similar loads on the service. However, since the job size (impact on service) of requests varies a FIFO queue is no longer sufficient and reordering (scheduling) is required to ensure that the service is neither overloaded nor underutilized.
Figure 3. Transparent scheduling 3.2 Scheduling of Requests Since Web Services are using XML-based SOAP protocol for communications. The service bound traffic analysis appears be a straightforward task. Therefore we can easily identify the request and evaluate the impact each request will have on the service provider (job size). This in turn enables re-ordering (scheduling) of the service requests. Scheduling of requests [fig. 3] brings a wide spectrum of possibilities including minimizing response time. For an atomic (non composite) service SJF (Shortest Job First) scheduling is sufficient as a means for optimizing overall mean response time. SJF is a scheduling policy which reduces the processing time of light requests, at the expense of the heavier ones. All incoming service calls are placed in a waiting queue and are processed in the order of their size. Smith [15] proved that SJF provided with accurate information on job sizes is the optimal scheduling policy for minimizing the mean response time 3.3 Scheduling & Composite Web Services (CWS) Optimizing the performance of each single service used in a service composition does not necessarily guarantee the best performance of the composition itself. Therefore we should also consider scheduling methods that utilize workflow information (topology).
Figure 4. Component-level scheduling Scheduling of CWS requests should be done on component (service) level. Component-level scheduling focuses on scheduling sub-requests for each service and can adjust to changes during the execution of the workflow. In the current paper we consider Composite Web Services composed according to the Sequence pattern [9] with a static structure. We also assume that size of the subrequests are known a priori or can be estimated.
In order to improve response time of service composition one of the following scheduling schemas can be used: SJF: In the previous section we have described SJF functionality from a prospective of a single service. However this policy can be also applied to each component in a CWS. Total Work Remaining (TWORK): This scheduling policy scales up the SJF principle to a CWS level. The size of composite request (total work) is determined as a sum of all job sizes on component services. The priority is given to CWS, whose sub requests imposing lesser loads on component services. Least Work Remaining (LWKR): LWKR is an elaborated version of TWORK. LWKR evaluates the total cost of all remaining sub-request and assigns the priorities according to the remaining work. Fewest Operations Remaining (FOPNR): FONPR uses the number of remaining component service invocations for a CWS as the main factor impacting sub requests priority. The priority is higher if the number of subrequests remaining unprocessed is fewer. Table 1. Data used by scheduling policies Policy Topology Job size SJF No Yes LWKR Yes Yes TWORK Yes Yes FOPNR Yes No In component-level scheduling a separate scheduler is placed in front of each service [fig. 4] resulting in a multistep scheduling. In case the component schedulers can only estimate the size of the sub-requests assigned to them, SJF should be used. However, if each component scheduler can evaluate the size of the remaining work in the workflow or the mentioned above information can be shared among all the schedulers, LWKR or TWORK can be used. For the cases when there is not accurate data on job sizes times FOPNR must be employed. Since component scheduling is performed in every component scheduler, the costs of scheduling are higher but at the same time scheduling can be adapted better to unexpected outcomes of processing requests. The compare the scheduling policies in terms of the information required for their deployment is presented in table one. 3.4 Job Size Estimation The accurate determination of the job size is of great importance to SJF, LWKR and other scheduling approaches. For SJF a correlation between estimated and observed processing times close to one (perfect
4. Experiments
Complexity 1
80.0%
2 3
60.0%
4 5
40.0%
6 7
20.0%
8 0.0%
9 6 29
0 14
93
47
15
The experiments contain three parts. In the first part we investigate the possibility of job size estimation for database centric Web Services. In the second we study the impact of SJF scheduling on a standalone Web Service. The investigation of the various service compositions governed by suggested scheduling policies is explored in the last part.
100.0%
Cumulative Percent
predictions) achieves the optimal schedule [16], a correlation close to minus one results in the worst schedule. A zero correlation turns SJF into random scheduling [16].
Figure 5. Execution time of “Order status” with different SOAP request complexity (16 clients)
4.1 The TPC-APP Benchmark
Change Item
60.0%
Change Payment Method
40.0%
Create Order New Customer
20.0%
New Products
0.0% 7 40
ResponseTime
9 46
3 34
6 26
0 14
3 20
The first experiment aims to evaluate if a posteriori knowledge (collected statistics) can foresee with satisfactory accuracy the behavior of a job. In the experiment 16 clients are issuing randomly generated requests for 30 minutes. In order to distinguish the sizes of jobs, all SOAP requests are divided into classes. SOAP requests within the same class are likely to create approximately same loads on the service. Using the exponentially smoothed average response time [19] of the class it becomes possible to predict the behavior of a request.
80.0%
63
4.2 Job-Size Estimation
Method
0
Obtaining traces of Web Services in realistic settings is still a major challenge for researchers. Fortunately, the Transaction Processing Performance Council (TPC) [17] provides impartial benchmarks, including one specifically aimed at Web Services, called TPC-App [18]. The “TPC Benchmark™ App (TPC-App) is an application server and web services benchmark. The workload is performed in a managed environment that simulates the activities of a business-to-business transactional application server operating in a 24x7 environment…..”[18]. As shown in figure seven, TPC-App setup consists of clients, a bookstore service, a database server and a thirdparty service. The main metrics in the experiments are throughput and average response time. The average response time is the mean value of all the response times of the service during the measurement interval. Throughput is defined here as the number of successful service interactions per time unit. [12].
Cumulative Percent
100.0%
Order Status Product Detail
Figure 6. Execution time of service methods (16 clients)
An attempt to use mean response time for each service operation results only in a (weak) 0.35 correlation between the estimated and the actual response times. Certain operations have a processing time determined by intrinsic parameters of the service invocation. For instance time required for handling “Order Status” is proportional to the number of the items the status has been requested for. While operations, like “Change Payment”, exhibit more stable behavior. However after the classification was augmented with the data from a SOAP request a strong 0.72 correlation is achieved [fig. 6]. The particularly strong correlation is an outcome of utilizing a database at the backend thus the price of a service call shows a relationship to the number of updates/writes performed on the database. 4.3 Impact of Admission Control & SJF Scheduling To determine the impact of scheduling three settings are compared, namely Processor Sharing (PS), admission control (FIFO) and SJF. Processor Sharing (PS)
represents a policy in which every request of a client leads to the spawning of a thread. FIFO represents the use of admission control that uses a queue to buffer requests once the saturation point of the provider is reached. SJF uses a priority queue, prioritizing short jobs at the expense of larger ones. The impact of scheduling is determined by running 16 experiments, in which up to 71 clients simultaneously access the eight methods of the simulated bookstore. Each experiment is run for 30 minutes and the clients are executing requests, which are randomly generated. The database is reinitialized and the application server rebooted prior to every experimental run to ensure accurate results.
PROXY/ Bookstore Service
Database Server 80
System Under Test (SUT)
Third party services
Figure 7. The scheduled environment
Throughput,iteractions/s
Clients
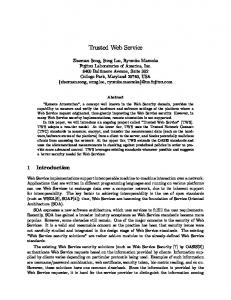
Figure 8 shows that at 41 clients the bookstore service starts experiencing a light overload and therefore its response time starts deviating from SJF and FIFO. FIFO differs from PS what serves as an indication of buffered requests emergence. As the result the SJF behaviour becomes more distinct from FIFO. The inefficiency of the FIFO approach can be already seen after 51 clients. With an increase of the load the length of the waiting queue goes up consequently allowing better optimizations. Therefore SJF outperforms FIFO by 35%. Figure 9 depicts how PS governed service is affected by thrashing. With 41 simultaneous clients it processes 51 responses per second and at the point 71 clients the throughput drops to 11. Meanwhile FIFO maintains the throughput at its maximum value. Due to the optimizations SJF raises the throughput to 67 responses per second.
70 60 50
SJF
40
PS
30
FIFO
20 10
Mean response time, ms
9000 8000 7000 6000 5000
SJF
4000
PS
3000
FIFO
2000 1000
1 6 11 16 21 26 31 36 41 46 51 56 61 66 71 76
0
Number of clients
Figure 8. Response times of the service governed by various scheduling policies
1 6 11 16 21 26 31 36 41 46 51 56 61 66 71 76
0
Figures 8 and 9 show the observed throughput and response time in relation to the used policy {PS, FIFO, SJF} and the number of simultaneous clients. Figure 8 illustrates that even with an admission control and SJF can be a subject of a throughout degradation. The decline emerges due to an overload in SOAP parsers of the proxy. However placing a load control component on TCP level should eliminate the threat of proxy overload. In the current setting, the proxy that performs the scheduling/admission control is residing on a host that is shared with the application server [fig. 7].
Number of clients
Figure 9. Throughput of the service governed by various scheduling policies
4.4 Service Model Studying the impacts of transient overloads (e.g. bursts) on CWS leads to the problem of running multiple services in a controlled environment which is very resource intensive. Simulation of services offers a less resource intensive and more flexible alternative for studying the behavior of CWS. Using the simulation tool Anylogic [20], a model that captures the behaviors of WS and CWS was developed. Experiments (simulation and reference implementation of real system) show that thrashing appears not only in WS running a transactional database at the backend [12], but also in the standalone computation bound WS. Thrashing can originate from the parsing, which is mandatory part for each WS. Therefore all the WS without admission control will experience the thrashing effect if the loads exceed certain limits. To calibrate the simulation a basic echo WS implemented in Axis [20] is used. The WS simulation model contains two main resources CPU and Memory,
governed by PS (Processor Sharing) and tries to accurately describe the observed behavior (e.g. page faults). The simulation model has been designed to show the same thrashing effects that have been observed in experiments. Figures 10 and 11 present a comparison of the simulated and observed Axis WS behavior indicating a close match. After ensuring that the simulated “echo” service demonstrates the same behavior as the Axis WS, experiments with simulated CWS become possible.
Response time,s
100
In the first experiments a high CWS request rate is alternated with a low request rate. The duration of the low load is 50 seconds and 10 seconds for a high load. The low load corresponds to 5% of the high load. The arrival rate for the heavy load period is marked on X axis [fig. 13-16].
Service Model
10 1 0
50
100
0.1 0.01 Request rate,req/s
Figure 10. Model and Echo Service Response Time
70
Service
50
25
40 30 20 10 0 0
50 Request rate, req/s
100
Figure 11. Model and Echo Service Throughput
Response Time, s
Resp/sec
Figure 12. Service compositions
Model
60
20 FIFO SJF
15
TW ORK 10
LW KR FOPNR
5 0
4.5 Scheduling of CWS
1
2
3
4
5
6
7
8
9
10
Arrival rate, req/s
Figure 13. Average response time for all compositions 4.5.1 Impact of Scheduling on CWS
Up to nine identical services are aggregated in the used composite services [fig. 12] for evaluating different admission and scheduling approaches. To simplify the simulation the costs for orchestration are assumed to be zero. Therefore the time between receiving a response from a prior service and sending a request to a next service is neglected. Without a loss of generality any other value bigger than zero can be used instead. The upper limit on the number of the concurrent jobs per service is set to five. The job-sizes of the component requests are exponentially distributed with the average 100 ms. Each experiment lasts for 2 hours 42 minutes.
Service 1 which is involved in all compositions [fig. 12] is put under the most stress. As the consequence the average response time for Service 1 goes up to 23 seconds in average [fig. 15, FIFO]. Scheduling decisions made on the overloaded component is the main factor determining average response time. As the result optimizing performance of the first component service demonstrates the best outcomes [fig. 13]. Thus as we can see the lowest value of the average response time for all compositions can be achieved only with SJF. As we discovered decisions made by the scheduler governing Service1 determine the overall behaviour of the mean response time. Since Service 1 is the first service involved in all compositions therefore the remaining work
70
16 14 Response Time, s
for a composition is the same as the total work. Therefore LWKR and TWORK exhibit similar behaviour. As it was expected LWKR and TWORK speed up the execution of the smaller composite requests [fig. 15] up to ten times, while slowing down the heavy requests [fig. 14] up to two times. Surprisingly FOPNR demonstrates a performance worse than FIFO [fig. 13]. The FONPR allocates most of the resources for small composite requests (CWS1) [fig 15] meanwhile the components of the big requests (CWS4) [fig 14] are disproportionally penalized. The disproportion emerges due to the overestimation of the remaining work caused by the coarse approximation. FONPR treats all remaining requests equally. Nevertheless due the component service load misbalance the most of the sub requests processing time presses closer to the first components.
12
FIFO
10
SJF
8
TWORK
6
LWKR FOPNR
4 2 0 1
6
11
16
21
26
Arriva rate, req/s
Figure 16. Average response time for CWS3 Since all composite requests belong to the same type TWORK demonstrates the results very close FIFO [fig. 16]. Nevertheless SJF still exhibits almost a 30% performance boost.
Response Time, s
60 FIFO
50
SJF
40 30
LW KR
20
FOPNR
10 0 1
2
3
4
5
6
7
8
9
10
Arrival rate, req/s
Figure 14. Average response time for CWS4 In the second experiment we studied the behaviour of the environment where all component services are a part of a single composition. In this case the stress on the component services is more equalized and therefore FONPR and LWKR and can achieve better approximation of the remaining work. As a consequence they outperform SJF and FIFO by 25-40% [fig. 16]. 25
Response Time, s
5. Conclusions
TW ORK
20 FIFO SJF
15
TW ORK 10
LW KR FOPNR
5 0 1
2
3
4
5
6
7
8
9
10
Arrival rate, req/s
Figure 15. Average response time for CWS1
This paper presents the idea of transparent scheduling of Web Services requests as means for achieving better performance. Using the TPC-APP, a two-tier B2B application, as a benchmark we evaluated the performance gains of SJF (Shortest Job First) compared to FIFO admission control and standard PS. By introducing a proxy between consumer and provider, it was possible to achieve a transparent scheduling and admission control that lead to significant performance improvements in overload cases. In addition, the experimental evaluation showed that even in the absence of a priori knowledge, a SJF scheduler that uses observed runtime behaviour can lead to schedules that outperform FIFO and PS, making it an attractive approach for improving Web Services performance. The results of the experimentation demonstrate that transparent scheduling can be applied to Web Services as an effective and easy to implement approach for increasing performance and avoiding service provider thrashing. As a step towards CWS scheduling we investigated possible outcomes of employing SJF, FONPR, TWORK and LWKR for boosting performance of sequence service compositions. In order to evaluate CWS scheduling policies a model for simulation was developed. The simulation shows that in case of bulk arrivals SJF scheduling can reduce the average response time of CWS up to 50%, LWKR up to 40%. Besides that we discovered that FONPR has a high sensitivity to the component services utilization therefore in some cases may cause a degradation of CWS performance.
6. Future Work While the results of applying scheduling are very promising it is important to note that the current work only focused on a simplified SOA model. Future work in transparent scheduling of Web Services will overcome this by addressing the following issues: Composite Web Services following other patterns: Composite Services orchestrate the functionality provided by the other services thus creating complex environment with significantly more complex behaviour. Scheduling Composite Web Service following other patterns requires more deep investigation. Service-Layer Agreement (SLA): SLA[21] is an increasingly important aspect of SOA. Scheduling can be used as a means for achieving this by minimizing penalties and supporting QoS contracts in critical situations.
References [1] J. Chatarji, "Introduction to Service Oriented Architecture (SOA)," 2007. [Online].Available: http://www.devshed.com/c/a/Web-Services/Introductionto-Service-Oriented-Architecture-SOA/ [2] N. Mitra. SOAP version 1.2 part 0. [Online]. Available: http://www.w3c.org/TR/soap12-part0/ [3] Web Service Definition Language (WSDL). [Online]. Available: http://www.w3.org/TR/wsdl [4] UDDI.org. [Online]. Available: http://www.uddi.org/ [5] Apache Axis. [Online]. Available: http://ws.apache.org/axis/ [6] Visual Studio Home. [Online]. Available: http://msdn.microsoft.com/vstudio/ [7] Business Process Execution Language For Web Services Version 1.1. Available: http://www128.ibm.com/developerworks/library/specification/wsbpel/ [8] Windows Workflow Foundation. [Online]. Available: http://wf.netfx3.com/ [9] W. M. P. V. D. Aalst, A. H. M. T. Hofstede and B. K. a. A. P. Barros, "Workflow Patterns," Distrib. Parallel Databases, vol. 14, pp. 5-51, 2003.
[10] D. Dyachuk and R. Deters, "The impact of transient loads on the performance of service ecologies," in DEST 2007: 2007 Inagural IEEE Internation Conference on Digital Ecosystems and Technologies, 2007, [11] H. Heiss and R. Wagner, "Adaptive load control in transaction processing systems," in VLDB '91: Proceedings of the 17th International Conference on very Large Data Bases, 1991, pp. 47-54. [12] D. Dyachuk and R. Deters, "Transparent scheduling of web services," in 3rd International Conference on Web Information Systems and Technologies, 2007, [13] S. Elnikety, E. Nahum, J. Tracey and W. Zwaenepoel, "A method for transparent admission control and request scheduling in e-commerce web sites," in WWW '04: Proceedings of the 13th International Conference on World Wide Web, 2004, pp. 276-286. [14] A. Erradi and P. Maheshwari, "wsBus: QoS-aware middleware for reliable web services interactions," in EEE '05: Proceedings of the 2005 IEEE International Conference on e-Technology, e-Commerce and e-Service (EEE'05) on e-Technology, e-Commerce and e-Service, 2005, pp. 634-639. [15] W. E. Smith, Various Optimizers for Single-State Production. Naval Research Logistics Quarterly, 1956, [16] Conway R. W.,Maxwell W.L. and Miller L. W., Theory of Scheduling. Addison-Wesley, 1967, [17] Transaction Processing Performance Council (TPC). [Online;]. Available: http://www.tpc.org/ [18] TPC-App - Application Server and Web Service Benchmark. [Online]. Available: http://www.tpc.org/tpc_app/ [19] Makridakis, S., C. Chatfield, M. Hibon, M. Lawrence, T. Mills,K.Ord and L.F. Simmons, "The M2-Competition: A Real-Time Judgmentally Based Forecasting Study," Int. J. Forecast., vol. 9(1), pp. 5-22, 1992. [20] XJ Techologies. Anylogic 5.5. [Online]. Available: http://www.xjtek.com/ [21] A. Keller and H. Ludwig, "The WSLA Framework: Specifying and Monitoring Service Level Agreements for Web Services," IBM Research Report, May. 2002.