Abstract. The classification of fully polarimetric SAR- data by neural networks is studied in this paper, especially the effect of the input para- meters to the ...
OPTIMUM m U T PARAMETERS FOR cLAWW'ICATION OF MULTIFREQUENCY POLARIMETRIC SAR-DATA USING NEURALNETWORKS D. K&hny
W. Wiesbeck
Institut fiir Hochstfrequenztechnik und Elektronik University of Karlsruhe - Germany Kaiserstr.12 7500 Karlsruhe 1
Abstract
Section I1 outlines the topology of the neural network used for this approach. The paper does not intend to discuss the type of neural networks, which could be used for the learning process. There is a n immense amount of references dealing with this theme [4,5,6]. A main problem in neural network classification is the selection of the input parameters. Section I11 describes the polarimetric input parameters tested in this study. In section lV the results of the best suited input parameters are discussed, then the application for a real --image is shown. The intention of this paper is to show how the choice of the input parameters affects the classification results.
The classification of fully polarimetric SARdata by neural networks is studied in this paper, especially the effect of the input parameters to the classification accuracy. A three layer feed-forward network and for training the well known back propagation algorithm are used. The scattering matrix, Stokes matrix, covariance matrix and the Huynen parameters are tested as input parameters. A synthetic polarimetric image and a full polarimetric SAR-scene of Oberpfaffenhofen are investigated as test areas.
II. Background
Keywords: Neural network, SAR, classification
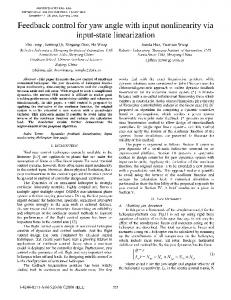
A neural network consists of two principle elements, nodes, a n abstraction of the biological concept of a neuron, and weighted paths, connecting these nodes. In this study a three-layer feed forward neural network architecture according to Figure 1 is used. All nodes of a layer are connected to all nodes of the next layer.
I. Introduction
Since JPL delivered the first multipolarization, multi-frequency SAR-data, there have been a lot of classification approaches. Most of these did neither use the full polarimetric information, nor the multi-frequency capability, Van Zyl showed in 1989 a n approach using the full-polarimetric information and multi-frequency capability for an unsupervised classification procedure [ 11.
For the training process the well known Back Propagation Algorithm is used [4,5,61. The input is coded as real numbers for each channel. The output is coded digital, which means that for every output class one output neuron is used. A class is classified, if the corresponding neuron has a value larger than 0.9 and every other neuron a value smaller than 0.1. For all other cases the input is considered unclassified. The number of neurons in the input processing layer depends on the number of input channels, which will be discussed in the following chapter.
In recent years a totally new type of classification came u p in form of neural networks. Previous papers showed how such networks can be used for classification of high dimensional data [2,3].A very encouraging approach is shown in 141 for the application in cloud classification. In the field of polarimetric SAR-data there have been only a few studies up to now So this present study intends to use this new approach. Here multispectral radar polarimetry data are regarded as n-dimensional data, where n is the number of real parameters extracted from data. This n-dimensional data are feed into a neural network as input.
.
2157
CH2971-0/91/0000-2157$01.000 1991 IEEE
III. Input Pruuneten For identical training and classification areas the following sets of input parameters have been investigated : 4
4
4
Synthetic input data For testing the different parameters a synthetic test area was created. This test area consisted of four classes of scatterers:
A.
scattering matrix Stokes matrix Huynen parameters covariance matrix
1. 2. 3. 4.
The first layer of the neural network represents the input processing layer. The number of nodes corresponds to the number of real input channels, given by the data. In the monostatic case of the scattering by a radar target the polarization scattering matrix describes the complete polarimetric behavior of the target. i s defined in the common (H,V)-polarkation basis as
[a
Direct scattering mechanism (“odd sc.”) Double scattering mechanism (“even sc.”) Modelled coniferous forest Modelled deciduous forest
Direct scattering mechanism were modelled by scattering from dielectric cylinders. Scattering from dihedral corner reflectors was used for double scattering mechanism. These two scattering classes have complete different polarimetric behavior. Class 3 and 4 were modelled by a modified Version of Ulaby’s MIMICS [lo]. The two classes were chosen because their scattering mechanism are similar for L-band., so distinguishing between the two classes will be difficult for a network. For each class 50x50 pixels were generated by varying statistically the aspect angle and the geometry of the scatterers in a certain range.
[a
Normally this matrix is reciprocal, which implies that & v = s v h . d l numbers are complex, so there are 6 input parameters to the network per frequency.
The total synthetic area consisted of 100x100 pixels. Out of each class 20 pixels were chosen as training base. Every network was trained with those data and finally the total image was classified. The learning rates q and a were chosen as 0.4 and 0.3 respectively.
For statistical targets, a more convenient form of the radar scattering representation are the Stokes or Mueller matrix. In this paper the JPL form of the Stokes matrix I71 is used, due to the reason that J P L SAR data are used for classification purposes. The 4x4 matrix is symmetric resulting in 10 real numbers as input. From the Stokes matrix the Huynen parameters can be calculated according to [8]. The Huynen parameters tend to give a brief physical description of the scattering behavior of a target. So a third network was set up using the 9 real Wuynen parameters. In most cases JPL data are delivered in Stokes matrix form. Due to averaging it is no more possible to calculate the polarization scattering matrix. But it is still possible to get the covariance matrix C, the analogous form of the scattering matrix for statistical targets. Equation 2 shows the used form of the covariance matrix as defined in 191.
In table 1 the classification results are given for the different input parameters. The percentage displayed for each class gives the ratio of number of correct classified pixels to the total number of pixels belonging to that class. The unclassified percentage is related to the total number of pixels in the synthetic area. For every parameter there exist two columns called normalized and unnormalized. In t h e column normalized the input parameters are divided by the total power scattered for every pixel. This means that the contrast is removed from the image and only polarimetric features are used. As
expected the classification results for class
1 and 2 are excellent because of their typical
polarimetric behavior, using the StokesHuynen- and Covariance parameters [>90??). The scattering parameters show slightly worse results. For the vegetation classes 3 and 4 classification results are in the order of 5060% (unnormalized) for the Stokes and covariance matrix and the Huynen parameters. By removing the contrast the classification does not work any more. The scattering parameters are absolutely unsuitable for classifying these two classes. B. Application to real SAR-data DLR and JPL/NASA In summer 1989 performed a campaign at Oberpfaffenhofen near Munich in southern Germany taking 2158
three-band full-polarimetric scenes in that area (1024x750 pixels per scene).. The data were fully calibrated. For this classification 4 classes were defined: 1. 2.
3. 4.
reliability. The minor differences result from the learning process and the statistical nature of the investigated classes. The results showed that neural networks are excellent suited for classifying multi-frequency full polarimetric data. They are relatively insensitive to the data configuration. Future work will be performed in a more detailed classification by using more classes and the results will be compared with statistical classification approaches.
urbanarea flat areas (lakes, streets etc.) farm land forested areas
Out of every class 100 pixels were chosen for the training process. Classification tests were performed using the different input parameters of section 111, except the scattering parameters. As expected from the results of the synthetic test area, the difference in the classification for the different input parameters was very small.
References [l] J.J. van Zyl, “Unsupervised Classification of Scattering Behavior Using Radar Polarimetry Data,” IEEE Trans. Geosc. Remote Sensing, vol. GE-27, pp. 36-45, 1989 [2] J.A. Benediktson et al, “Neural Network Approaches Versus Statistical Methods in Classification of Multisource Remote Sensing Data,”of Scattering Behavior Using Radar Polarimetry Data,” ZEEE Trans. Geosc. Remote Sensing, vol. GE-28, pp. 540-552, 1990 [3] P.D. Heermann, N. Khazenie, “Application of Neural Networks for Classification of Multi-Source MultiSpectral Remote Sensing Data,” Proc. IGARSS Symp., pp. 1273-1275, Washington DC, 1990 141 J. Lee et al, “A Neural Network Approach to Cloud Classitication,”ZEEE Trans. Geosc. Remote Sensing, vol. GE-28, pp. 846-855, 1990 [51 K. Kratzer, Neuronale Netze -Grundlagen und ihre Anwendung, C. Hanser Verlag Miinchen, 1990 [6] T. Kohonen, “An Introduction to Neural Computing,” Neural Network, vol. 1, pp. 3-16, 1988 [71 F. T. Ulaby, C. Elachi, Radar Polarimetry for Geoscience Applications,Artech House, 1990 [8] J.R. Huynen, Phenomenological Theory of Radar Targets, Ph.D. Thesis, 1. Rev. 1987, P.Q. Research [9] K. Tragl, “Polarimetric Radar Backscattering fiom Reciprocal Random Targets,” ZEEE Trans. Geosc. Remote Sensing, vol. GE-28, pp. 856-864, 1990 [101 K.C. Mc Donald et al, “Using MIMICS to Model L Band Multiangle and Multitemporal Backscatter From a Walnut Orchard,“ IEEE Trans. Geosc. Remote Sensing, vol. GE-28, pp. 477-491, 1990
The best results were obtained by using the three-band data. As example fig. 2 shows a small part of one classified scene (480x270 pixels). The image was gained by using P-, G and C-band and the Stokes mat* as input. Additionally the noise in the image was reduced. The different classes match excellent to the ground truth data, as far as available. Classification tests with single band data showed, that urban areas can be classified precisely in every band. Forested areas were classifled in Gband best and agricultural areas in P-band. Especially in P-band parts of forested areas were classified as urban areas, which can be explained by even scattering due to the penetration of the electromagnetical waves into the forest.
V. Conclusion The initial idea of the presented classification approach was to research the influence of the input parameters for neural networks on the classification results. In summary it showed up, that the original scattering matrix is unsuited as input parameter, while the Stokes matrix, Huynen parameters and Covariance matrix result in nearly the same classification
Acknowledgement We thank the DLR at Oberpfaffenhofen, especially Dr. Nithak, for providing the polarimetric =-data, used for the analysis.
Table 1 Classification results for synthetic data
2159
Hidden Layer
Output Layer
Fig.1
Topology of the used neural network
M isc henrie d B r Fo r Bst I
Airport (DLR) Fig2
Classified area near Oberpfaffenhofen (P-, L and C-band)
2160
Ne U- G i Ic h Ir7g