data mining methods. The methods that are used are Kohonen's organizing networks and fuzzy logic in combination with Numerical Weather Prediction (NWP) ...
Proceedings of the 10th Int. Conf. on Harmonisation within Atmospheric Dispersion Modelling for Regulatory Purposes
APPLICATION DATA MINING FOR FORECASTING OF HIGHT-LEVEL AIR POLLUTION IN URBAN-INDUSTRIAL AREA IN SOUTHERN POLAND Leszek Osrodka1, Marek Wojtylak2, Ewa Krajny1, Rafal Dunal3 and Krzysztof Klejnowski4 1 Institute for Meteorology and Water Management (IMGW) Warsaw, Regional Office in Katowice, Poland 2 Silesian University (US), Katowice, Poland 3 ESAProjekt Sp. z o.o., Katowice, Poland 4 Institute of Environmental Engineering Bases of Polish Academy of Science (IPIS PAN), Zabrze, Poland INTRODUCTION Predicting high concentration of pollutants is a complex problem. Despite many methods usually used for estimation of smog episode runs, none of them is commonly accepted and does not give satisfactory results. From the essential point of view the most reliable results come from physical methods, but because of problems with obtaining credible data on pollutants, especially those coming from the communal sources and traffic, it is hard to use them in operational mode. For that reason, in practice statistical and artificial intelligence (AI) methods are used, that do not affect the physical part of the phenomena, but allow to prepare proper and fast forecasting by means of discovering unknown correlation between collected data. For many years artificial neural networks (ANNs). For a couple of years data mining methods have become more and more significant (Adamo, J.M., 2001). In general, it is a set of methods that allow to gather knowledge from the available data (i.e. existing trends, correlations). In the region of Upper Silesia agglomeration the knowledge of discovering system is used for preparing 24 hours pollutants concentration forecasts (SO2, NO2, PM10, O3) (Krajny, E. et al., 2002 and Osrodka, L. et al., 2003). This paper presents a methodology of short-range forecasting of high air pollution in urban-industrial areas basing on selected data mining methods. The methods that are used are Kohonen’s organizing networks and fuzzy logic in combination with Numerical Weather Prediction (NWP) obtained from German National Meteorological Service (DWD) model. INPUT DATA FOR AQ FORECAST By the time the forecast was performed the following input data was available: (i) measured elements from meteorological stations belonging to National Weather Service (NWS) and calculated values from NWP – air pressure, wind direction and speed at 10 m a.g.l (above ground level), air temperature at 2 m a.g.l., dew point temperature at 2 m a.g.l., precipitation, (ii) calculated values from NWP – ground temperature, air temperature at 30 m a.g.l., cloud cover (high, medium, low), ground fog, (iii) measured elements from NWS – total cloud cover, (iv) measured pollution from Automatic Regional Monitoring System of Air Quality in Upper Silesian agglomeration – hourly air pollution concentrations (sulphur dioxide, nitrogen dioxide, particulate matter PM10, ozone). Regional average values of the concentration of air pollutants were used in the AQ forecast. They were determined as arithmetic means of values obtained in distinct monitoring stations. NWP is created twice a day, it covers 78 hours, update is performed every 12 hours, output data includes hourly values. From the point of view of meteorological factors forecast’s data availability, its time resolution and meeting daily trends of pollutions, the beginning of AQ forecast was set to 9 UTC. The reason stems from the fact that by that time the newest meteorological weather forecast as well as the newest data concerning air pollution are available. The forecast AQ is performed 24 hour advance period with hourly step.
Page 664
Proceedings of the 10th Int. Conf. on Harmonisation within Atmospheric Dispersion Modelling for Regulatory Purposes
METHODOLOGY OF AQ FORECAST It is well known that occurrence of high level of fair pollution concentration is associated with certain well-defined meteorological conditions. Hence the idea to choose the group of similar situations corresponding to similar air pollution levels out of all possible states of atmosphere and meteorological conditions. Such initial selection of the input data would facilitate the network learning process by restricting separate cases from one similarity group. The idea of forecasting is hence reduced to two-step approach (Osrodka, L. et al., 2003): classification of meteorological and air quality (AQ) conditions, determination of air pollution pattern in a given meteorological situation. Searching for perfect models for AQ forecasts, fuzzy sets were applied as the following method. The classification of meteorological situations responsible for high air pollution was made done by Kohenen layer with “conscience” algorithm (Haykin, S., 1994). As a result, there were obtained over a dozen of concentrations that is to say groups of meteorological factors effecting one hour air pollution levels in the measured ranges. USED DATA MINING METHODS Kohonen’s self organizing networks with “conscience” Kohonen’s self-organizing maps consist of one layer of neurons organized in one, two and multi-dimensional arrays. Each neuron has as many input connections as there are numbers of attributes to be used in the classification. The training procedure consists of finding the neuron with weights closest to the input data vector and declaring that neuron as the winning neuron. Then the weights of all of the neurons in the vicinity of the winning neuron are adjusted, by an amount inversely proportional to the distance. The radius of the accepted vicinity is reduced as the iteration numbers increase. The training process is terminated if RMS (residual mean square) errors of all of the inputs are reduced to an acceptable level or a prescribed number of iterations are reached. There are two methods to determine the similarity. (Haykin, S., 1994). As the iteration progresses and RMS error reduces, the radius of correction is also gradually reduced. This will eventually become one neuron distance, thus no other neuron is adjusted other than the winning neuron. In the case where one neuron is continually the winning neuron, then its computed distance is also modified by some amount to allow other neurons win. This process is called the “conscience”. Fuzzy case-based reasoning CBR method allows to reason future basing on similar situations form the past, scanning the past and finding similar forecast meteorological conditions and correlating them with analysis of air pollution levels. The classic CBR forecasting consists of four phases (Aamodt, A and E. Plaza, 1994): - retrieve the most similar case or cases; - reuse the information and knowledge in that case to solve the problem; - revise the proposed solution if necessary; - retain the parts of this experience likely to be useful for future problem solving. Fuzzy logic is an established methodology that is widely used in model systems in which variables are continuous, imprecise, or ambiguous. The main idea of fuzzy logic is that items in the real world are better described by having partial membership in complementary sets than by having complete membership in exclusive sets. This has the effect of increasing the resolution and the fidelity of categorization. CBR and fuzzy logic both deal with how to determine degree of similarity, but they tend to use different approaches. CBR commonly deals with features, geometry, and structure (Bridge, D.G.,1998 and Liao, T.W. et al., 1998), whereas fuzzy logic deals explicitly with uncertainty ambiguity expressed intentionally by Page 665
Proceedings of the 10th Int. Conf. on Harmonisation within Atmospheric Dispersion Modelling for Regulatory Purposes
humans when they are asked to describe similarity. Fuzzy words describe uncertainty intentionally and fuzzy sets represent the intended untended uncertainty. Fuzzy CBR is a type of CBR that uses fuzzy methods to represent and compare cases, and to form solution. DESCRIPTION OF AQ FORECAST Forecast fuzzyfication algorithm The forecasts were divided with Kohenen layer with exhaustion algorithm into more than a dozen of groups. Variants of the division were tested according to their forecast efficiency. In each distinguished group there are from a few to more than a dozen of forecast and real situations corresponding to them. It was assumed that they distinguish fuzzy runs of meteorological situations and air quality for defined group of forecasts. For each parameter P and each hour t basing on a few values we can calculate fuzzy number L-R (left-right) type with Gauss membership function. We calculate the average μt and standard deviation σt.
μ P ( t ) ( x) = e
−
x − μt
σt
p
t=0,..,36
(3)
P is empirically adjust. Now we can say, that each forecast can be changed to fuzzy meteorological situation and air pollution concentration: take any forecast and adjust it to a defined group of situations and create fuzzy situation. Algorithm of the forecast A fuzzy situation D is given. We browse historical situations D’ and for each considered run of the parameter for each hour (0..36), we define its membership to fuzzy situation. Let p(t) means a measured run during a historical situation D’ of P parameter. Then a following function
η(t)=μP(t)(p(t))
(4)
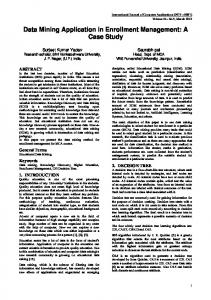
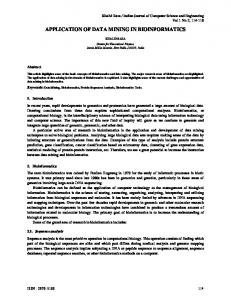
represents membership of the parameter P to the situation D. Different decision rules are taken into the consideration, they decide if P∈D’ belongs also to D. There is a similar decision process to verify if D’ is similar enough to situation D. If the condition is fulfilled the air pollution runs are included in the forecast and they are given importance. When all data is browsed the right forecast is calculated. RESULTS OF THE AQ FORECAST As the results of the classification there were more than dozen of groups obtained, within which runs particular parameters of the forecasts were very similar. Basing on that and knowing real trends a fuzzification of each group was performed. Hereunder there is presented an example of a fuzzification of a high air pollution concentration group (Fig. 1) and an average wind speed fuzzy from 0 UTC to 36 hours forecast included that period AQ forecast (Fig. 2).
Page 666
Proceedings of the 10th Int. Conf. on Harmonisation within Atmospheric Dispersion Modelling for Regulatory Purposes
-3
SO 2 ( g m )
Katowice 21-22 December 2004 200 180 160 140 120 100 80 60 40 20 0
measured 0,88 0,75 0,72 0,74 0,66 0,70 0,75 0,69
10 12
6
8
4
2
0
20 22
16 18
12 14
0,71 0,83
UTC
-3
PM10 ( g m )
Katowice 21-22 December 2004 500 450 400 350 300 250 200 150 100 50 0
meas ured 0,88 0,75 0,72 0,74 0,66 0,70 0,75 0,69
12
10
8
6
4
2
0
20 22
18
16
12 14
0,71 0,83
UTC
Fig. 1 Results of sulphur dioxide and particulate matter forecasts (coefficient similarity a real situation to a fuzzy forecast) 9
-1
WIND SPEED (ms )
8 7 6 5 4 3 2 1
36
33
30
27
24
21
18
15
12
9
6
3
0
0
HOURS FORECAST
Fig. 2 Wind speed fuzzy for a situation with high levels of air pollution concentration (thick and thick dashed line – fuzzy factor, thin lines – real wind speeds for this group of forecasts).
Page 667
Proceedings of the 10th Int. Conf. on Harmonisation within Atmospheric Dispersion Modelling for Regulatory Purposes
AQ assessment system To present the results of the results of the AQ forecast system, there was started a portal presenting information about daily SO2 and PM10 concentrations. The test system is running at http://spjp.esaprojekt.pl , the service currently is available only in Polish, it will be localized to English. The website contains information for users about the scope of the projects and AQI (Air Quality Index), as the additional information for a few IP camera system was gathering pictures from Upper Silesia agglomeration. Air pollution forecast are also ready to be included in currently running E2SP (Environmental Enterprise Service Provider) project, that provides innovative and effective services to all actors operating in environmental monitoring, planning, governance and assessment activities all over Europe for the exploitation of environmental monitoring data and forecasts. E2SP is co-finance by EU Commission within eTen programme. More information about the project at http://e2sp.esaprojekt.pl. CONCLUSION The proposed methodology is another approach to middle-range air pollution forecasting in Upper Silesia agglomeration, on the assumption that there is no data about other emissions. It is an alternative to methods used so far for city areas, its practical application should be validated by an operator of a forecasting system in known meteorological conditions. AQ forecast results obtained by usage of CBR are encouraging. First of all, because of a satisfying match maximum values as well daily course of pollution concentrations. ACKNOWLEDGEMENT The authors wish to thanks Silesian Voivodeship Inspectorate of Environment Protection in Katowice for making available the air quality data used in this study. REFERENCES
Adamo, J.M., 2001: Data Mining for Association Rules and Sequential Patterns. Sequential and Parallel Algorithms, Springer-Verlag, New York. Aamodt, A., and E. Plaza, 1994: Case-based reasoning: Foundational issues, methodological variations, and system approaches, AI Communications, IOS Press. Bridge, D.G., 1998: Defining and combining symmetric and asymmetric similarity measures, Proceedings of the 4th European Workshop on Case-based Reasoning, 52-63. Haykin, S., 1994: Neural Networks, A Comprehensive Foundation, Published by Macmillan College Publishing Company, New York. Krajny E., L. Osrodka and M. Wojtylak, 2002: Application of artificial neural network in forecasting of air pollution in large industrial urban area. Proceedings of the 2nd Air Pollution Modeling and Simulation APMS’2001, Springer, Sportisse B. (ed.), 574-577. Liao, T.W., Z. Zhang and C.R. Mount, 1998: Similarity measures for retrieval in case-based reasoning system, Applied Artificial Intelligence, 12, 267-288. Osrodka L., M. Wojtylak and E. Krajny, 2003: Forecasting of height-level air pollution in urban-industrial agglomeration by means of numerical weather forecasting. Proceedings of the 5th International Conference on Urban Climate ICUC, Klysik K., T.R. Oke, F. Fortuniak, C.S.B. Grimmond and J. Wibig (eds.), Published by University of Lodz, Poland, 165-168.
Page 668