tools from Apple [1] have been used to collect data. Some pertinent parameters of the ..... their length into account, as an example, in the SwissProt database, the first ..... http://developer.apple.com/tools/performance/. [2] Swissprot, universal ...
Parallel Processing in Biological Sequence Comparison Using General Purpose Processors Friman S´anchez, Esther Salam´ı, Alex Ramirez and Mateo Valero HiPEAC European Network of Excellence Universitat Polit`ecnica de Catalunya (UPC), Barcelona, Spain {fsanchez, esalami, aramirez, mateo}@ac.upc.edu Abstract— The comparison and alignment of DNA and protein sequences are important tasks in molecular biology and bioinformatics. One of the most well known algorithms to perform the string-matching operation present in these tasks is the SmithWaterman algorithm (SW). However, it is a computation intensive algorithm, and many researchers have developed heuristic startegies to avoid using it, specially when using large databases to perform the search. There are several efficient implementations of the SW algorithm on general purpose processors. These implementations try to extract data-level parallelism taking advantage of SingleInstruction Multiple-Data extensions (SIMD), capable of performing several operations in parallel on a set of data. In this paper, we propose a more efficient data parallel implementation of the SW algorithm. Our proposed implementation obtains a 30% reduction in the execution time relative to the previous best data-parallel alternative. In this paper we review different alternative implementation of the SW algorithm, compare them with our proposal, and present preliminary results for some heuristic implementations. Finally, we present a detailed study of the computational complexity of the different alignment algorithms presented and their behavior on the different aspect of the CPU microarchitecture.
I. I NTRODUCTION During the last decades, the most important advances in molecular biology and genomic technologies have led to a nearly exponential growth in the biological information generated by the scientific community. This flow of genomic information [8] has required not only computerized databases to store, organize, and index the data, but also specialized tools to view and analyze them. One of the most important tasks in this area is the alignment of two biological sequences (DNA, RNA or protein sequences). Molecular biologists usually compare sequences to find similarities between them in order to define whether one sequence is similar to another. Generally, such comparisons involve aligning sections of the two sequences in a way that exposes the similarities between them. For example, consider the sequences A=csttpggg with eight residues (symbols) and B=csdtnglawgg with eleven residues. One possible alignment could be: A = c s - t t p g - - - g g | | | | | B = c s d t - n g l a w g g In the above alignment, we say that b3 = d is inserted into the first sequence or it is deleted from the second one,
depending on the point of view. Also, a5 = p is substituted by b5 = n or b5 by a5 . Consecutive dashes in the sequences represent a gap, for example, there is a gap of length one between a2 and a3 and a gap of length three between a6 and a7 in the first sequence. In order to compare biosequences, a similarity score between the individual residues must be established. Biologists have defined substitution scoring functions that assign a similarity score between all possible pairs of residues. In the case of proteins, these functions quantify whether the substitution of one residue for another is likely to conserve the chemical and physical properties of the protein or is more likely to disrupt essencial structural and functional features of the protein. For these reasons, the definition and evaluation of these score functions is an important scientific discussion in the biology community. Numerous approaches have been used to create such quantifications, referred to as substitution score matrix. Some of these matrices are PAM, PAM100, BLOSUM45, BLOSUM62, etc [10] [15] [14]. An interesting discussion about the characteristics of these matrices can be found in [17]. Researchers have proposed several methods for alignment of two biological sequences. However, the dynamic programming (DP) is probably the most important programming method in sequences alignment [23] and many researchers have proposed different algorithms based on DP to quantify the similarity of a pair of sequences [18] [25] [27] [12]. Between these alternatives, the most important sequence-search algorithm is that of Smith-Waterman [27], which is generally considered to be the most sensitive. Sensitivity is a measure of how well a method can detect the actual similarity between two sequences. Nevertheless, the computationally intensive task involved in the algorithm is a very restrictive factor that prevents the use of these kind of proposals. The time complexity of this algorithm is O(m, n), where m and n are the lengths of the two sequences respectively. On the other hand, many heuristic strategies have been proposed and developed to speed-up the execution of the search and alignment tasks, such as FASTA [20], BLAST [7] and ParAlign [22]. These methods reduce the running time by several factors compared with the SW algorithm. However, this reduction is obtained at the expense of sensitivity, and due to this loss of sensitivity some related sequences can not be detected in a search. For these reasons, in order to perform both sensitive and fast
searches in biological databases, researchers have studied and proposed several strategies to produce a fast implementation of the SW algorithm under different computational platforms such as special purpose hardware, specific purpose coprocessors, general purpose multiprocessors and general purpose uniprocessors. In this work, we study the implementation of the SW algorithm on modern general purpose uniprocessors (GPPs) that contain some parallel processing capabilities like multimedia SIMD extensions. In addition, we propose another alternative for implementing the algorithm in these processors that exploits more data parallelism to speed-up execution. Specifically, our strategy uses the Altivec SIMD extension included in the IBM PowerPC970 processor. With this new alternative, a reduction of 30% in the execution time is achieved relative to the best previous implementation (on a single processor). Additionally, we perform a preliminary comparison between some SW implementations and some well-known heuristic strategies. We analyze some critical elements of the performance behavior in these search applications and finally, we analyze how these applications behave over all the running time. This paper is organized as follows: Section II discusses the related work. Section III details some aspects of the SmithWaterman algorithm, and some strategies for implementing it on GPPs with SIMD capabilities. Section IV describes the experimental infrastructure that has been used in this work. Section V describes the experiments and the parameters of the evaluation. Finally, in section VI some conclusions and future work are presented. II. R ELATED W ORK Several special purpose hardware solutions have been developed with parallel processing capabilities using FPGAs or custom VLSI technology [28] [16] [3]. These machines are able to process more than 2000 millon matrix cells per second and they have been installed successfully in many research centers around the world. However their disadvantages are the high cost and the lack of programmability. Parallel computing is a very common alternative to obtain high performance in the execution of SW algorithm and other biological applications. In this case, strategies include the use of general purpose supercomputers [26], special purpose multiprocessors, and clusters of workstations. These machines can sustain a very high performance and can often be used effectively. In this case, a sequence analysis task is subdivided into thousands of individual tasks, which can be distributed to multiple processors with only a little programming difficulty and minimal knowledge of the architecture. These machines can exploit efficiently, the fine and coarse grain parallelism that exist in the sequences analysis applications [24] [30]. However, any performance improvement obtained on the runtime of a single task (in a single processor) immediately benefits the whole system. On the other hand, general purpose uniprocessors with data parallel processing capabilities like multimedia SIMD exten-
sions, have been used to execute the algorithms for database searching. Alpern et al [6] described different ways to speed up the SW algorithm including a parallel implementation using microparallelism by dividing the 64-bit wide Z-buffer registers of the Intel Parangon i860 processor into four parts. They used this strategy to compare the query sequence with four different database sequence simultaneously. They achieved more than a five-fold speed-up over a conventional implementation of the algorithm. Wozniak [29] presented a way to implement the SW algorithm using the Visual Instruction Set (VIS) technology of the Sun UltraSPARC microprocessors. This implementation reached a speed up close to two relative to the same algorithm implemented with integer instructions on the same machine. On the other hand, Green [13] with the SWAT program and recent versions of SSEARCH [19] include a nonparallel variant of SW algorithm that is about twice as fast as the implementation of Alperh and Wozniak. This is probably the best non-parallel reference for speed comparisons on a monoprocessor. Rognes [21] proposed a faster implementation of the SW algorithm using SIMD extensions. This implementation is based on the MMX and SSE technology included in the Intel’s general purpose processors. Their results show a sixfold speed-up relative to the fastest previous known SW implementation. A speed of more than 150 million cell updates per second was obtained on a single Intel Pentium III 500 MHz processor. Our work has several contributions. First, we propose another alternative for implementing the SW algorithm that can extract more data level parallelism than previous works (including Rognes’s work). Our strategy is implemented using the Altivec SIMD extension included in the IBM PowerPC970 processor. Due to the fact that the SW implementation of Rognes [21] is probably the best reported on a single general purpose processor, we use this implementation as a point of comparison in our work. Finally, we analyze some critical elements of the performance behavior in the search applications for biological data. III. S MITH -WATERMAN A LGORITHM D ESCRIPTION The Smith-Waterman algorithm is a database search algorithm developed by T.F. Smith and M.S. Waterman [27]. It implements dynamic programming techniques that take two sequences of any length, and at any location determine an optimal alignment between the two sequences. In the process, scores or weights are assigned to each character-to-character comparison: positive for exact matches/substitutions, negative for insertions/deletions. In weight matrices, scores are added together and the highest scoring alignment is reported. A short description of the algorithm follows. Given a query sequence A of length m, a database sequence B of length n, a substitution score matrix S, a gap-open penalty q and a gap extension penalty r, the optimal local alignment score T can be computed using the following recursive equations:
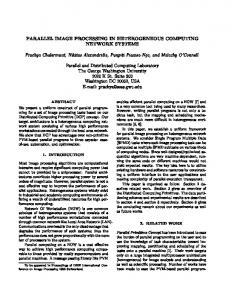
Fig. 1. Data-dependency graph in the execution of Smith-Waterman algorithm.
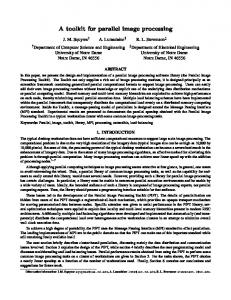
ei,j = max{ei,j−1 , hi−1,j − q} − r (1) fi,j = max{fi−1,j , hi,j−1 − q} − r (2) hi,j = max{hi−1,j−1 + S[A[i], B[i]], fi,j , ei,j , 0} (3) T = max{hi,j } (4) Where, ei,j and fi,j are the maximum local-alignment score involving the first i symbols of A and the first j symbols of B, and ending with a gap in sequence B or A, respectively. And hi,j represents the overall-maximum local-alignment score involving the first i symbols of A and the first j symbols of B. The recursion should be calculated with i going from 1 to m and j from 1 to n, with the initial conditions ei,j = fi,j = hi,j = 0 for all i = 0 or j = 0. The order of the computation of the values in the alignment matrix hi,j is strict, that is, the value of any cell cannot be computed before the value of all cells to the left and above it has been computed. Figure 1 shows the data dependencies in the calculation of hi,j . From the figure, it can be observed that the computation of hi,j is independent across the minor diagonals. This characteristic has been observed by several researchers and based on it, they have proposed several special purpose architectures that exploit this parallelism [9]. A. Strategies to Execute the Smith-Waterman Algorithm Using SIMD Extensions on GPPs There are several ways to exploit the existing parallelism in the computation of the SW algorithm using SIMD extensions. As shown in figure 2, the first possibility is to perform the execution of vectors of cells parallel to the minor diagonal in the matrix (figure 2a), however, for GPPs, this alternative has many memory problems due to the non-uniform access pattern of data in cache [29]. A second option is shown in figure 2b, where the calculation is made on vectors of cells parallel to the query sequence. This alternative has been evaluated by Rognes [21] and their
results show a six-fold speed-up relative to the fastest previous implementation. However, this strategy has to handle data dependencies within the vector. This alternative takes advantage of the fact that in many cells of the matrix, e and f are zero (see equations (1) and (2)), and hence they do not contribute to h. It happens when both the query and the database sequences are not very similar. As long as h is less than the threshold q + r, which is the penalty of a single symbol gap, e and f will stay at zero along a column or row in the matrix. Because of this characteristic, operations can be reduced and data dependencies in the calculation of h are removed, thereby computations are simplified. However, if any of the cell values are above the threshold the computation of the h-values must be done one by one to preserve the program semantics. In this paper, we propose another alternative to exploit more data-level parallelism (DLP) that entails performing the calculation with a combination of the first and second alternatives. This alternative is shown in figure 2c. In this alternative, we process the vector of cells parallel to the query sequence and at the same time we process the vector of cells from the next column in diagonal direction in the same thread. It is possible because both vector of cells do not have dependencies between them and these operations can be performed by independent instructions. In figure 2c, vectors of cells that are marked with the same minor diagonal can be computed in parallel. However, this alternative does not eliminate the data dependencies inside a vector, then, when this is required, it must be handled as in the previous alternative. As we will see in section V, this way of performing the operations can reduce around 30% the execution time compared with previous strategies. B. Using Heuristics in the Sequence Alignment Process Although dynamic programming based approaches like SW are recognized as very sensitive alternatives for detecting distantly related sequences, they have the limitation of computational complexity. The time and space complexity is quadratic when the two sequences have similar lengths. And in some cases, complexity can become exponential if there are multiple optimal solutions and all of them need to be determined. For these reasons, heuristic strategies have been developed to speed-up the search process in very large databases. These heuristics reduce the runtime considerably, however this is done at the expense of sensitivity in such a way that some distantly related sequences may not be detected in a search. In this paper, the proposed approach is compared with different implementations of the SW algorithm and with the most popular heuristic strategy: BLAST [7]. Additionally, we implemented the heuristic strategy developed by Rognes [22] and we compared it with the other strategies. This strategy initially performs a very rapid computation of the exact optimal ungapped alignment score for all diagonals in the alignment matrix. This first step can be performed in a very parallel way because all the horizontal and vertical data dependencies of the figure 1 are eliminated. The second part of the algorithm includes the use of a novel heuristic
Fig. 2.
Parallel alternatives to perform the SW algorithm.
TABLE I PARAMETERS OF THE PROCESSOR Processor Clock Speed Main Memory L1 Data Cache L1 Instruction Cache L2 Data Cache Cache Size line System Bus Compiler Compiler Opt. Flags Operating System
IBM PowerPC 970 1.6 GHz 512 MB 32KB 64KB 512KB 128 B 800MHz gcc 3.3.3 -O3, mtune=G5 Mac OSX
for computing an approximate score of a gapped alignment by combining the score of several diagonals that have been calculated in the first step. Finally this approximated score is used to select the most interesting database sequences for a subsequent SW alignment. The results obtained by Rognes show that this strategy has a better sensitivity than existing heuristics, including BLAST. However, it is slower than the BLAST algorithm. In this paper, due to its potential to be improved using SIMD extensions, this strategy has been implemented, studied, and used to compare with the other approaches including the mentioned implementation of the SW algorithm. IV. E XPERIMENTAL M ETHODOLOGY An execution-based methodology is used to evaluate the performance of the different alternatives that have been described above. To evaluate these, we have collected data on execution time, instruction profiling, executed instructions per cycle (IPC), phase analysis, cache behavior and branch prediction accuracy. The study has been performed on a PowerPC970 machine with Altivec SIMD Extension [11]. Hardware performance monitoring counters and the CHUD tools from Apple [1] have been used to collect data. Some pertinent parameters of the machine are given in table I. A. Input Working Set and Database Evaluations were done using a set of 11 different amino acid query sequences against the SwissProt [2] database. These
TABLE II Q UERY SEQUENCES USED IN THE EVALUATIONS Protein Family Globin Ras Interferon a Glutathione S-transferase Serine Protease Histocompatibility antigen Alcohol dehydrogenase Serine Protease inhibitor Cytochrome P450 H+-transporting ATP synthase Hemaglutinin
Accession (ID) P02232 P01111 P05013 P14942 P00762 P10318 P07327 P01008 P10635 P25705 P03435
length (symbols) 143 189 189 222 246 362 375 464 497 553 567
11 sequences represent a range of well characterized protein families. The length of these sequences ranged from 143 to 567 amino acids. It is important to remark, that the same set of queries has previously been used by other researchers to evaluate different alignment approaches, like BLAST and ParAlign [7] [22]. Some characteristics of these sequences are listed in table II. For each query sequence the name of the protein, the accession number (ID), and the quantity of amino acids (symbols or residues) are shown. Currently, the SwissProt database contains more than 62,615,309 residues grouped into 172,233 protein sequences. All the database searches have been executed with a gap open penalty of 10 and a gap extension penalty of 1. Additionally, the blosum62 amino-acid substitution score matrix has been used [14]. This is a 24x24 matrix of amino acids, where column c, row r indicates the score associated with replacing amino acid c with amino acid r in a protein. For all implementations, the options were adjusted to show the best 500 hits. V. E XPERIMENTAL R ESULTS In this section we evaluate different data-parallel implementations of the SW algorithm, as well as a straight-forward non-parallel implementation, and the best non-parallel variant of the algorithm. This implementation is part of the recent versions of SSEARCH application [19] and it is recognized as a very effective and optimal alternative for the analysis of biological sequences [4]. This is probably the best scalar (non
450 400 350 300 250 200 150 100 50 0 100
Fig. 3.
200
300
ssearch sw-rognes sw-alt2
Number of columns that are processed at the same time
400
500
sw-alt3 sw-alt4 Hrognes+sw3
600 blast
(a) Execution Time
A. Execution Time Figure 4a shows the time required by each application to search similar sequences in the database. Figure 4b is a zoom of the previous figure to concentrate on the dataparallel and heuristic implementations. The horizontal axis in the figures indicates the length of the query sequences and the vertical axis indicates the execution time in seconds. As can be seen, heuristic strategies perform faster than all the SW implementations. However, our SW optimization (sw alt3) is in average 30% faster than the Rognes implementation (sw rognes), which is the best previous implementation. This is due to the way we exploit parallelism (figure 2c). This approach allows us to calculate 3 columns of the hi,j matrix at the same time, taking advantage of using more registers, data reusing and the functional unit throughput. It is interesting to note that also the sw alt2 version obtains a speed-up around 15%. B. Instruction Breakdown The execution-based approach allows us to collect precise performance measurements on a real processor for the studied
60 50 40 30 20 10 0 100
200
300
400
sw-rognes sw-alt2
500
sw-alt3 sw-alt4
600
Hrognes+sw3 blast
(b) Zoom of the Execution Time
Fig. 4. Execution Time of the evaluated applications. The x-axis shows length of the query. The y-axis shows execution time in seconds. TABLE III I NSTRUCTION C OUNT FOR EACH A PPLICATION Application Blast blastp Sserch Sw rognes Sw alt2 Sw alt3 Hrognes+sw3
Instruction Count [MegaInst] 3,635 261,816 37,667 37,642 37,613 17,837
Instruction Breakdown 100
other v_store v_load vector i_store i_load control i_comp i_log i_arith
80 Instructions (%)
data-parallel) reference for speed comparison. Additionally, we evaluated the above mentioned heuristic approaches. In summary, we evaluated the following strategies: • ssearch: Best known scalar implementation of the SW algorithm. This is part of the SSEARCH program. • sw rognes: Data-parallel implementation based on the Rognes SW strategy [21] and described in figure 2b. • sw alt2: Data-parallel implementation based on our proposal (figure 2c). This version processes 2 columns at the same time as shown figure 3a. • sw alt3: Data-parallel implementation based on our proposal. This version processes 3 columns at the same time as shown figure 3b. • sw alt4: Data-parallel implementation based on our proposal. This version processes 4 columns at the same time as shown figure 3c. • Hrognes+sw3: Data-parallel implementation based on sw alt3 and the Rognes heuristic [22] and briefly described in section III-B. • blast: BLAST program [7].
70
60
40
20
0
bla
st
Fig. 5.
sse
sw
arc
h
_ro
sw
gne
s
_al
t3
Hro
gne
s+s
w3
Instruction Breakdown for the different applications
C. IPC and Phase analysis Applications for sequence search and comparison of biological data have a very large scale behavior (behavior seen over billions of instructions). Therefore, it is important to analyze how these applications behave across their entire execution. This knowledge can help us understand what kind of hardware and software optimizations could be done to further improve performance. In this section, an analysis of the behavior of the running time is done. To do that, the number of instructions executed per cycle (IPC) is collected during the execution. The goal is to observe if the execution is composed of phases and how they change over time. Figures 6a, 6b and 6c show the
IPC Blast
zoomx100 Blast
1.4 1.2 1 0.8 0.6 0.4 0.2 0 0
500
1000
1500
(a)
1.4 1.2 1 0.8 0.6 0.4 0.2 0 1000 1005 1010 1015 1020 1025 1030 1035 1040
2000
milliseconds
(d)
IPC Hrognes+sw3 3
3 2.5
2
2
1.5
1.5
1
1
0.5
0.5
0 0
1000
2000
3000
4000
(b)
0 1000 1005 1010 1015 1020 1025 1030 1035 1040 1045
5000
milliseconds
(e)
IPC sw_alt3
milliseconds
zoomx100 sw_alt3
2
2
1.5
1.5
1
1
0.5
0.5
0
0 0
100
200
300
(c)
Fig. 6.
Length DB Sequence
milliseconds
zoomx100 Hrognes+sw3
2.5
400
500
milliseconds
0
100
200
300
(f)
400
500
milliseconds
IPC for (a) blast, (b) Hrognes+sw3 and (c) sw alt3, and zooms
9000 8000 7000 6000 5000 4000 3000 2000 1000 0 0
Length DB Sequence
workloads, which have a large scale behavior. As an example of that, table III shows the number of executed instructions for each evaluated application when the search of similar sequences is performed using the query sequence Glutathione Stransferase P14942 that has a length of 222 residues. Figure 5 shows the percentage of instruction classes for some of the evaluated strategies. In this figure, there are some important aspects that are necessary to analyze. First, the amount of floating point instructions in the applications is negligible. This shows that this kind of applications have different nature than other scientific applications where the amount of floating point instructions is significant. None of the analyzed applications contains more than 1% of floating point instructions. In fact, most of the executed instructions in all applications are ALU instructions, that is, 57% integer ALU instructions in blast, 43% in ssearch, 11.3% integer ALU and 55.13% altivec ALU instructions in sw rognes, 7.7% integer ALU and 69% altivec ALU instructions in sw alt3, and finally, 33% integer ALU and 39.5% altivec ALU instructions in Hrognes+sw3. Comparing these results to the instruction distribution for the SPEC 2000 made in [5], where the average ALU instructions is around 40%; we can see that this applications place more pressure over the execution units than the SPEC suite (be it integer or SIMD functional units), making these applications computationally bounded. Another important observation is the amount of memory instructions in each application. There is a significant percentage of load instruction in each application, (23% in blast, 20% in ssearch, 17% in sw rognes, 14% in sw alt3 and 20% in Hrognes+sw3). However, the amount of store instructions is very small. This is due to the fact that all the applications have to load each database sequence from memory and at the end of the computation, they do not store the same amount of data, because after many calculations, only the score value of the alignment is kept. Again, comparing these results to the percentage of memory instructions in SPEC 2000 [5], where the average of memory instructions is around 40%; we can see that there are significant differences between SPEC and sw rognes and Hrognes+sw3 search applications. The result shows that the pressure over memory system in these applications is lower than in the SPEC. Our results show that these applications perform more computation per unit of data than the average SPEC benchmark.
1800 1600 1400 1200 1000 800 600 400 200 0 50500
20000
40000
60000 (a)
50600
80000 100000 120000 Index of Sequence
50700 (b)
50800 Index of Sequence
140000
50900
160000
51000
Fig. 7. Length of database sequence: (a) All the sequences, (b) Sequences with index between 50500 and 51000
IPC results for the blast, Hrognes+sw3, sw alt3 applications during all the execution time. Figures 6d, 6e and 6f show the same data for a smaller fraction of the execution time (zoom x 100). Here, it is important to remark that we have exploited smaller fractions of execution time and the behavior is similar to the shown graphics, however for space reasons, not all the graphics are shown. There are several observations that we have to emphasize. First, the different values of IPC between the applications (Blast 1, Hrognes+sw3 1.8, sw alt3 1.3 on average). It is necessary to remember that all these applications are very different solutions to the problem of sequence searching. Therefore, a direct comparison is mistaken. However, we can see that although Hrognes+sw3 and sw3 alt are slower solutions for the problem, the ILP that the processor can extract in these applications is greater than for Blast. That is, these applications
make a better use of the resources of the processor, but take a lot more instructions to compute the results. Additionally, these proposals make use of the Altivec SIMD extension included in the PowerPC 970 processor that implements SIMD registers of 128-bit length which can peform up to 16 8-bit operations or 8 16-bit operations depending on the size of the data that is used, meaning that a single Altivec operation per cycle (and IPC of 1) is actually performing 8 or 16 operations per cycle, which makes IPC results somewhat misleading. On the other hand, as can be observed in figure 6, IPC does not exhibit an appreciable phase behavior. However, it is important to take into account some characteristics of the situation presented in the execution of the applications. First, biological databases are composed of thousands of sequences with different lengths, these sequences are not sorted taking their length into account, as an example, in the SwissProt database, the first sequence has 924 symbos, second 102, third 75, fourth 296, and so on. Second, the basic algorithm of each application performs a search over each of the sequences (in order of indexing), and usually, the time spent for performing the search is associated with the length of sequence and with the similarity between the query and the database sequence. As an illustration of these characteristics, figure 7a shows the length for each database sequence. In this figure, horizontal axis is the index of the sequence, that is, the number of the sequence in the database, and vertical axis is the length of the sequence. All these characteristics imply that there is not a clear pattern of IPC behavior in the applications over the running time. However, it is important to analyze the behavior of the applications in more precise regions of the database. For that, we have collected data in two different regions: a high score region and a low score region. A high score region means a zone in database where there are many sequences that match very well with the query sequence, and a low score region means the opposite. In our example, a score below 150 can be considered as a low score. Figure 7b shows the length of sequences in a region of the sequence that contains both high and low score regions. Indexes between 50500 and 50750 belong to a region that contains several database sequences with high score and indexes between 50750 and 51000 belong to a region that contains sequences with low score. D. High and Low Score regions Behavior In order to show how applications behave in regions where there is a high or low score, we analyzed the IPC, instruction and cycles count of the execution in these regions. The last two measures are normalized to the length of database sequence. Figures 8 and 9 show the results for sw alt3 SW implementation and Hrognes+sw3 heuristic. Results in sw alt3 show how the cycles and instruction count increase when the high score region is processed. The IPC decreases in this zone. Also, we can see that even in this high score zone there is not a phase behavior. Additionally, Hrognes+sw3 heuristic presents a similar behavior, that is, it does not have a phase behavior either.
On the other hand, in a low score region, the behavior of the execution is more regular (indexes greater than 50750 in figures 8 and 9), the instructions and cycles count are lower and the IPC is higher than in the high score region. In the case of sw alt3, the reason is that when database sequences are not very similar, many calculation are avoided (due to the presence of zeros in the scores matrix hi,j ) and more data parallelism can be extracted. In the case of the Hrognes+sw3 heuristic, the first step of the algorithm (that contains more data parallelism) performs a fast filtering and selects only possible sequences that can have high score to be processed in a second step of the algorithm (that is the exhaustive SW algorithm, which is slower and with less data parallelism due to data dependencies). However, in the low score region, this second step is avoided most of the time, because very few sequences are selected. E. Computational Requirements in Search Algorithms. Another interesting analysis is the computational requirements in the calculation of the alignment score between a query sequence and database sequences in the regions that have been analyzed in the previous subsection. In order to do that, we have collected data over the IPC, cycles and instructions required for processing each residue of the database sequences. The results have been classified by score. Figures 10 and 11 show results for the sw alt3 SW implementation and the Hrognes+sw3 heuristic. The analyzed regions are the same used in the previous analysis. Data is normalized to the length of the database sequence. As can be seen in figures 10 and 11, there is a significant difference in the computational requirements (instructions) between the high and low score regions, for example, in sw alt3, when the comparison is performed with not similar sequences (low score: around 150 or less score), the number of required instructions per residue is between 500 and 1000, however when a similar sequence is analyzed (higher score: greater than 200, 600 or more) the number of required instructions to process the database sequences increases up to 2500 and 3500. That is, around 5 times more instructions. This is due to the lack of data parallelism in the comparison of very similar sequences, as explained in section III. To summarize, the amount of computation per data is relatively high, specially when sequences are similar. Results show that search algorithms for biological sequences are not the typical search application in a database. They perform many calculations over each piece of data that is loaded from memory. Therefore these are a challenge for the execution units of the processors. F. Cache and Branch Prediction Behavior Table IV shows the data L1 cache behavior and the branch prediction accuracy obtained in the different applications. In general, there is a low cache miss rate in all applications, this is due to the fact that the access to data are made in a regular pattern because all the symbols of each database sequence are stored contiguously. It is important to remark that the
IPC per sequence in SW-ALT3 1.4 1.2 1 0.8 0.6 0.4 0.2 0 50500
50600
50700
50800
50900
51000
50900
51000
50900
51000
Index of Sequence
(Cycles per sequence)/lengthDBseq in SW-ALT3 4000 3500 3000 2500 2000 1500 1000 500 0 50500
50600
50700
50800 Index of Sequence
(Inst per sequence)/lengthDBseq in SW-ALT3 4000 3500 3000 2500 2000 1500 1000 500 0 50500
50600
50700
50800 Index of Sequence
Fig. 8.
IPC in a High (left side) and Low (right side) Score Region sw alt3 IPC per sequence in Hrognes+sw3
2 1.5 1 0.5 0 50500
50600
50700
50800
50900
51000
50900
51000
50900
51000
Index of Sequence
(Cycles per sequence)/lengthDBseq in Hrognes+sw3 4000 3500 3000 2500 2000 1500 1000 500 0 50500
50600
50700
50800 Index of Sequence
(Instructions per sequence)/lengthDBseq in Hrognes+sw3 4000 3500 3000 2500 2000 1500 1000 500 0 50500
50600
50700
50800 Index of Sequence
Fig. 9.
IPC in a High (left side) and Low (right side) Score Region Hrognes+sw3
TABLE IV D ATA L1 MISS RATE AND BRANCH PREDICTION ACCURACY (%) Application Blast Sw rognes Sw alt3 Hrognes+sw3
Data L1 Miss rate (%) 3.8 0.1 0.15 0.25
branch pred. accuracy (%) 89 81 80.5 96
PowerPC 970 processor can support data prefetching with a hardware mechanism. This mechanism can reduce the negative performance impact of the memory latencies. This is especially useful when the memory access pattern is regular as in the case of our applications. The results for branch prediction show that
applications has not many branches and control instruction (see figure 5) and they have a regular prediction accuracy. It is important to note that even though these memory and branch prediction results, the IPC is not greater than 2 in any of the applications. The reason is that although there are many independent altivec instructions in the applications, the processor only has one vector functional unit and one vector permute functional unit. VI. C ONCLUSIONS
AND
F UTURE W ORK
In this paper, we have studied the problem of implementing the Smith-Waterman algorithm for comparison of biological sequences. This study has been performed over general pur-
IPC PER SEQUENCE IN SW-ALT3 1.4 1.2 1 0.8 0.6 0.4 0
200
400
600
800
1000
800
1000
800
1000
SCORE (CYCLES PER SEQUENCE)/lengthDBseq in SW-ALT3 4000 3500 3000 2500 2000 1500 1000 500 0 0
200
400
600 SCORE
(INSTRUCTIONS PER SEQUENCE)/lengthDBseq in SW-ALT3 4000 3500 3000 2500 2000 1500 1000 500 0 0
200
400
600 SCORE
Fig. 10.
IPC in a High and Low Score Region sw alt3 sorted by Score IPC PER SEQUENCE IN Hrognes+sw3
2 1.5 1 0.5 0 0
200
400
600
800
1000
800
1000
800
1000
SCORE (CYCLES PER SEQUENCE)/lengthDBseq in Hrognes+sw3 4000 3500 3000 2500 2000 1500 1000 500 0 0
200
400
600 SCORE
(INSTRUCTIONS PER SEQUENCE)/lengthDBseq in Hrognes+sw3 4000 3500 3000 2500 2000 1500 1000 500 0 0
200
400
600 SCORE
Fig. 11.
IPC in a High Score Region Hrognes+sw3 sorted by Score
pose processors with a certain capacity of parallel processing using multimedia SIMD extensions. Additionally, we have proposed an alternative way to implement this algorithm based on exploiting data-level parallelism not only in the columm direction (as it has been presented by Rognes [21]), but also exploiting the parallelism in a minor diagonal direction as shown figure 2c. This new strategy achieves a significant reduction of 30% in the execution time and has a potential for more speedup if more functional units are added into the processor, alleviating its computationally bound nature. Besides, we have compared our alternative to other recognized SW implementations and with some heuristics alternatives like Blast, and the heurist Rognes proposal. Additionally, some
characteristics like execution time, IPC, instruction classifications, and phase behavior have been analyzed. In the phase analysis, we found that biological database search algorithms do not present a regular pattern of behavior or phases. This is due to the intrinsic characteristics of the problem. Besides, we have analyzed the behavior of these algorithms on different regions of the database, that is, in high and low score regions. The results reveal that the computational requirements increase in zones of the database where their sequences are more similar to the query sequence, and the IPC falls considerably. This observation is confirmed when we quantified the amount of required instructions for performing the SW algorithm in the high and low score
regions. However, even when a comparison with a low score sequence is done, the amount of required instructions is high. This shows the computational requirements for performing biological sequence analysis, and it also shows that search algorithm for biological data are computationally expensive due to the high amount of data that needs to be processed. It is important to remark that in spite of the execution time reduction that we have obtained using the new implementation strategy, the SW algorithm is still being computationally demanding. The use of general purpose processors that allows to extract fine-grain parallelism with SIMD extensions can help to speed-up the execution of this algorithm, but its performance is still far from reaching the performance of heuristics strategies, especially when very large databases are used. On the other hand, with the important information obtained in the phase analysis, it is possible to focus a deeper performance analysis over small parts of the execution. We have identified how the performance behaves in low and high score regions. Also, this information is usefull to define which regions should be taken into account in future analysis to reduce the complexity of simulation and tracing process when architectural and microarchitectural studies are carried out. Our future work in this point is to obtain a complete performance characterization of these applications using simulation techniques that allow us to define several architectural and microarchitectural optimizations in high performance processors to speedup the execution of these applications. Additionally, we think that it is necessary to include other bioinformatic applications that perform another task over biological information in futures studies. Our future studies will include important applications from domains like multiple sequences analysis, Genome-level alignment, phylogenetic analysis, and so on. VII. ACKNOWLEDGMENT This work is supported by the Ministry of Science and Technology of Spain, the European Union (FEDER funds) under contract TIC2004-07739-C02-01 and by IBM. We acknowledge the Barcelona Supercomputing Center (BSC) for supplying the computing resources for our research. R EFERENCES [1] Computer hardware understanding development tools. (chud tools). http://developer.apple.com/tools/performance/. [2] Swissprot, universal protein database. http://www.expasy.org/sprot/. [3] Fast data finder (fdf) and genematcher, 2000. http://www.paracel.com. [4] P. Agarwal and D. J. States. Comparative accuracy of methods for protein sequence similarity search. BIOINF: Bioinformatics, 14, 1998. [5] K. Albayraktaroglu, A. Jaleel, M. Xue Wu, Franklin, B.Jacob, C. Tseng, and D. Yeung. Biobench: A benchmark suite of bioinformatics applications. Proc. 2005 IEEE International Symposium on Performance Analysis of Systems and Software (ISPASS 2005), Austin TX, March 2005., March 2005.
[6] B. Alpern, L. Carter, and K. S. Gatlin. Microparallelism and highperformance protein matching. In Proceedings of Supercomputing’95. ACM/IEEE, Dec. 1995. [7] S. F. Altschul, W. Gish, W. Miller, M. Myers, and D. J. Lipman. Basic local alignment search tool. Journal of Molecular Biology, 215:403–410, 1990. [8] D. Benson, I. Karsch, D. Lipman, J. Ostell, B. Rapp, and D. Wheeler. Genbank. Nucleic acids research, 28(1):15–18, 2000. [9] E. T. Chow, J. C. Peterson, M. S. Waterman, T. Hunkapiller, and B. A. Zimmermann. A systolic array processor for biological information signal processing. In ICS 91: Proceedings of the 5th international conference on Supercomputing, pages 216–223, 1991. [10] M. Dayhoff, R. Schwartz, and B. Orcutt. A model of evolutionary change in proteins. Atlas of Protein Sequence and structure, 1978. [11] K. Diefendorff, P. Dubey, R. Hochsprung, and H. Scales. Altivec extension to powerpc accelerates media processing. IEEE Micro, 20(2):85–95, April 2000. [12] O. Gotoh. An improvement algorithm for matching biological sequences. Journal on Molecular Biology, 162:705–708, 1982. [13] P. Green. Swat. www.genome.washington.edu/uwgc/analysistools/swat.htm. [14] J. Henikoff, S. Henikoff and S. Pietrokovski. Blocks+: a non-redundant database of protein alignment blocks derived from multiple compilations. Bioinformatics, 15, 1999. [15] S. Henikoff and J. Henikoff. Amino acid substitution matrices from protein blocks. Proceding in Natural Academic Science, 89, 1992. [16] R. Hughey. Parallel hardware for sequence comparison and alignment. Proceedings of Int. Conf. Application Specific-Array Processors. IEEE Computer Society, Sep 1996. [17] B. Huhg, W. David, and J. Alexander. Strategies for searching sequence databases. BioTechniques, 28(6), 2000. [18] S. Needleman and C. Wunsch. A general method applicable to the search for similarities in the amino acid sequence of two proteins. Journal of Molecular Biology, 48:443–453, 1970. [19] W. R. Pearson. Searching protein sequence libraries: comparison of the sensitivity and selectivity of the smith-waterman and FASTA algorithms. Genomics, 11:635–650, 1991. [20] W. R. Pearson and D. J. Lipman. Improved tools for biological sequence comparison. In Proc. Natl. Acad. Sci (USA)., pages 2444–2448, Apr. 1988. [21] Rognes and Seeberg. Six-fold speed-up of smith-waterman sequence database searches using parallel processing on common microprocessors. BIOINF: Bioinformatics, 16, 2000. [22] T. Rognes. Rapid and sensitive methods for protein sequence comparison and database searching. Phd Thesis, Institue of Medical Microbiology. University of Oslo, 2000. [23] D. Sankoff. The early introduction of dynamic programming into computational biology. Bioinformatics, 16:1:41–47, 2000. [24] B. Schmidt, H. Schr¨oder, and M. Schimmler. Massively parallel solutions for molecular sequence analysis. In IPDPS 02: Proceedings of the 16th International Parallel and Distributed Processing Symposium, page 201. IEEE Computer Society, 2002. [25] P. Sellers. On the theory and computation of evolutionary distances. SIAM J. Appl. Match, 26:4:787–793, 1974. [26] S. Smith and J. Frenzel. Bioinformatics application of a scalable supercomputer-on-chip architecture. 1:385–391, 2003. Proceedings of the International Conference on Parallel and Distributed Processing Techniques. [27] T. F. Smith and M. S. Waterman. Identification of common molecular subsequences. Journal of Molecular Biology, 147:195–197, 1981. [28] C. White, R. Singh, P. Reintjes, J. Lampe, B. Erickson, W. Dettloff, V. Chi, and S. Altschul. Bioscan: a vlsi-based system for biosequence analysis. 1991. IEEE International Conference on Computer Design, ICCD. [29] A. Wozniak. Using video-oriented instructions to speed up sequence comparison. Computer Applications in the Biosciences, 13(1), 1997. [30] T. K. Yap, O. Frieder, and R. L. Martino. Parallel computation in biological sequence analysis. IEEE Trans. Parallel Distrib. Syst., 9(3):283–294, 1998.