Parameter estimation for stochastic hybrid model applied to urban traffic flow estimation Herman Y Sutarto a*, René K. Boel a and Endra Joelianto b a
SYSTeMS Research Group, EESA, University of Ghent, B-9052 Zwijnaarde, Belgium;
E-mail :
[email protected] ;
[email protected] b
Instrumentation and Control Research Group, Bandung Institute of Technology,
Bandung 40132, Indonesia. E-mail :
[email protected] Abstract This paper proposes a novel data-based approach for estimating the parameters of a stochastic hybrid model describing the traffic flow in an urban traffic network with signalized intersections. The model represents the evolution of the traffic flow rate, measuring the number of vehicles passing a given location per time unit. This traffic flow rate is described in this paper using a mode-dependent first order autoregressive (AR) stochastic process. The parameters of the AR-process take different values depending on the mode of traffic operation - free flowing, congested, or faulty – making this a hybrid stochastic process. Mode switching occurs according to a first-order Markov chain, and hence we call this hybrid process a jump Markov process. This paper proposes an expectationmaximization (EM) technique for estimating the transition matrix of this Markovian mode process and the parameters of the AR models for each mode. The technique is applied in this paper to actual traffic flow data from the city of Jakarta, Indonesia. The model thus obtained is validated by using the smoothed inferences algorithms and an online particle filter (PF). We also develop an EM parameter estimation that, in combination with a time window shift technique, can be useful and practical for periodically updating the parameters of hybrid model leading to an adaptive traffic flow state estimator. The proposed parameter estimation technique can thus be used as part of an adaptive model-based filter for feedback control of traffic lights. Keywords: Hybrid system, parameter estimation, particle filter, stochastic system, fault detection, urban traffic networks.
1 *) First author is currently with Institut Teknologi Harapan Bangsa, Bandung, Indonesia
1. Introduction Urban traffic congestion is a problem that significantly affects many aspects of the quality of life. A more efficient use of the existing road infrastructure, using advanced traffic control strategies, can lead to reduced congestion, reduced emissions, reduced fuel consumption, and improved safety. The model based control strategies that are needed in order to achieve such an improvement depend strongly on the quality and the accuracy of the dynamic model of the system, on the availability of reliable online data and also on the ease of implementation of the control strategy. The model must describe the variability over time of the traffic flow, allowing model based estimation of the current state, fusing noisy traffic data from various traffic sensors. This estimation together with the model in turn allows probabilistic prediction of future traffic flows, so that control actions – selecting switching times of traffic lights in the application we have in mind – can properly anticipate future traffic flow. In this paper we use a stochastic hybrid model to effectively describe the evolution over time of the arrival and flow rates of vehicles in an urban traffic network as stochastic processes. We define the flow rate as the number of vehicles that pass a location per red/green cycle, divided by the length of this cycle (veh./sec). The random value of the continuous variables defining the flow rates evolve according to an autoregressive model (AR) with time varying parameters, while some other events like changes in the environment, the inflow from outside the area under consideration, or the occurrence of unexpected incidents, influence the parameters of the ARflow rate model. This stochastic hybrid models represents uncertainties in the evolution of the traffic flow in probabilistic form, for time scales of the order several red/green cycles of the traffic light. This corresponds to the prediction horizon that should be taken into account for a real-time model-prediction based feedback controller of the traffic lights in an urban network. A great deal of recent work has considered traffic flow state estimation for freeway traffic and for arterial roads [1,2,3,4]. Our focus on urban networks requires different models and different estimation procedures, due to the stop and go phenomenon resulting from the green/red switching. The traffic flow state estimation algorithms typically rely on the knowledge of a stochastic dynamic model that describes the evolution of the traffic flow variables. This model depends on the noise characteristics in between mode changes, as well as on the transition probabilities from one discrete mode of operation to another mode. We identify or estimate the parameters of this hybrid system model from data observed during the normal operation of the plant. Since the discrete event and discrete time dynamics of such models are coupled, partially observable and stochastic, this is a very challenging problem in the field of data driven estimation and control. Previous work of the authors [5] uses a single ARX model and applies a particle filter and kernel smoothing method to estimate the parameters of the ARX model. However, the disadvantage of this model is that it fails to accurately classify the mode-dependent variance of the data which deteriorates the performance of the estimator. The disadvantage is due to the fact that the model consists of only one single ARX model, keeping the variance for the whole given measurement data set constant. Off course this assumption is quite unrealistic due to that the variance of the video-type sensor usually depends on the intensity of traffic flow, and to the influence of external factors on the traffic flow evolution. This is the another reason for developing the stochastic hybrid model which basically consists of a multiple model. It has also been shown in [6] that using mode-dependent models and identifying these modes leads to better estimation and prediction results for the traffic flow. By using different models in different modes of traffic behavior, we significantly improve the performance of the estimator in terms of the accuracy both in free-flow and congested flow regime. The stochastic hybrid models for which we estimate the parameters can be used for estimating and predicting traffic flow rates, and thus also for predicting queue lengths at signalized intersections. The variability of the traffic flow during successive cycles of the traffic light must be estimated with sufficient accuracy in order to predict the expected queue-length resulting from control decisions. Therefore estimating parameters of the traffic flow model, the
2
topic of this paper, is a prerequisite for implementing a good real-time controllers of the traffic lights in an urban environment. In traffic measurement data we have to deal with many types of noise and uncertainty. In the case study in section 5 we use traffic data obtained from a video-type sensor that detects vehicles passing several locations near two neighboring intersections in the capital city of Indonesia, Jakarta. Our past experience with this type of video data has indicated that there are a lot of missed detections (due to lack of detail in the image, or due to one vehicle obscuring another) as well as false detections (due to reflections, or other errors in the image processing). A model based state estimator is therefore necessary in order to filter the noise from the useful data, and to obtain a sufficiently accurate estimate of the flow rates at the different locations. Our stochastic hybrid model must also take into account errors due to incidents (like accidents) that may occur in the measured lanes. An incident may block traffic flow causing a traffic jam. In order to build a highly accurate estimate, a reliable fault detection system, and a good realtime description all of these phenomena should be considered in the dynamic models. In this paper, we present a novel approach to parameter estimation for a stochastic hybrid model of traffic flow. Traffic flow is described by a continuous random variable (t ) which expresses that the number of vehicles passing a given location in the urban network during the time interval [t , t dt ) is (t ) .dt (in order to avoid working with large integers we fluidize our traffic variables, approximating integer numbers of vehicles by real number, see [7]). We observe the traffic flow k (tk ) at an increasing sequence of discrete time t k (the easiest case is t k k .t , but in our application these t k ’s are successive switching times of traffic lights that may not operate with a fixed cycle). So we define as traffic flow the ratio
k N k (t
k 1
tk )
where N k counts the number of vehicles that pass the given location in
the interval [t k , t k 1 ). The fluid flow approximation implicitly assumes that the traffic flow remains constant during the interval [tk , tk 1 ) , i.e. k (t ) for t [t k , t k 1 ). Of course this assumption that vehicles travel approximately at equal distances during the interval [t k , t k 1 ) is an approximation that is only acceptable for sufficiently small values of the time increments tk+1-tk, but it reduces the computational complexity of our algorithms a lot since we do not have to consider individual vehicles. Moreover in our application we look at flow rates averaged over a typical red or green cycle period of the traffic light, and traffic flow is fairly regular during such a period. As long as the mode of operation of the traffic remains unchanged we make the very reasonable assumption that k evolves as a first order autoregressive (AR) process. The parameters of this AR-process however can take different values depending on the mode of traffic operation - free flowing, congested or faulty. Mode switching can be seen as a discrete event and we assume that these events occur after geometrically distributed random times, so that the modes are described by a first-order Markov chain. This hybrid stochastic process is called a jump Markov model. The transition probability matrix of the mode switching system must also be estimated using the online data available from the video cameras. The problem considered in this paper thus is this following : Determine those parameters that maximize the likelihood of the proposed stochastic hybrid model, best describing the stochastic dynamic model of the traffic flow rates at the given location, using a sufficiently long sequence of data k , k 1, 2, ..., K of traffic flow measurements, observed at a that location and use the model thus obtained for estimating and predicting the traffic flow. Note that these hybrid model parameters include both the parameters of the AR-process (including the noise variance) and the entries of the transition matrix . In this paper, the parameter estimation is performed as an offline technique using a given batch of observations, a
3
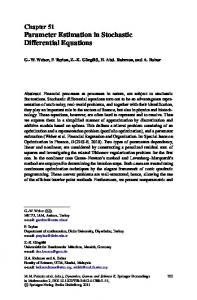
window of time during which the model is valid. Based on those parameters, we apply the model to be used in estimating/ predicting the traffic flow for the next time-window. This time window shift technique can be useful and practical for periodically updating the parameters of hybrid model leading to an adaptive traffic flow state estimator. The remainder of this paper is organized as follows. Section 2 explains the motivation for the stochastic hybrid model used in this paper. This jump Markov model representing the traffic flow rates via an autoregressive equation with mode dependent parameters is explained in detail in section 3. Section 4 describes the expectation maximization (EM) technique as a tool for estimating the parameters of this model while section 5 presents the experimental lay-out for the data used in our validation of the EM technique. Model validation is described in section 6. Finally, section 7 summarizes the findings of this paper and draws some conclusions on its practical usefulness. 2. Problem formulation In this section, we concentrate on stochastic hybrid modelling of traffic flow along one particular approach route to a signalized intersection, and indicate how this model is useful in controlling the operation of a signalized intersection. This explains how the parameter estimation problem treated in this paper fits into the overall traffic control problem. We validate our traffic flow model, and the parameter estimation algorithm based on this model, using data collected at 2 neighboring intersections, called 313 and 314, in the traffic network of Jakarta, Indonesia as shown in Fig.1. At each of the location indicated in Figure 1 by a bar, identified by their names D_F_ij, a video camera tries to detect all passing vehicles using a computer based counting algorithm. While false detections and missed vehicles cause significant errors in the data, the output y (t ) of the sensors approximately counts the number of vehicles that cross an entrance location D_F_ij during one cycle of the traffic light. The data set also lists the number of vehicles that cross a location per cycle of the local traffic light, as well as the duration of each cycle (between 120-200 seconds). This provides us with a data set of traffic flow rates averaged per cycle. By using measurement data obtained from video cameras at the locations at the intersections described above we build a model describing the dynamics of the traffic flow (t), use the EM-parameter estimation technique to estimate the model parameters, and validate the model thus obtained by using smoothed inference for predicting future values of (t). A good model should have the capability to cope with variation of urban traffic flow enabling queue length based traffic control. Indeed the evolution of the queue-length at approach route ℓ is given by t
Q (t ) Q (t 0 ) ( ( ) ( )) d t0
(1)
where (t ) ( (t )) is the traffic flow rate (generically called (t) earlier) of the arrival stream of vehicles (resp. the departure stream of vehicles) for a location along approach route ℓ, both flow rates measured in veh/sec, averaged over one measurement cycle corresponding usually to one cycle of the traffic lights. As mentioned above we use the fluid-flow approach, aggregating the number of vehicles during a cycle period, implicitly assuming that during the k -th cycle, between t k and t k 1 , the flow rate remains constant, equal to k , resp. k . Using our hybrid model equation (1) therefore also allows us to obtain probabilistic predictions for the queue lengths. Figure 1 shows that intersection I-313 has arrival flow L11 which is determined by summing the number of passing vehicles detected at sensor location 9,6,7 and 12 divided by the cycle length of the intersection I-314. The value of this the arrival flow rate as measured during the k-th cycle of the traffic lights is further on called λk. The departure rate for intersection 314, called L11 , is defined by counting the vehicles that pass the sensor location 8,9,10 at downstream intersection I-313, divided by the green period of lane L11 at intersection I-313 (the time delay corresponding to the travel time between intersection 313 and 314 must of course be taken into account when using the flow rate L11 as inflow rate at the downstream intersection I-
4
313). The value of this departure flow rate as measured during the k-th green period is further on denoted μk. Of course this is under the assumption that drivers of vehicles that pass the sensor locations 9,6,7 and 12 follow the traffic rules. For each intersection the traffic cycle is divided into 2 separate periods, called the red and the green period. In each of these periods only some traffic flows are allowed to cross the intersection, so that the departure rate L11 (t ) 0 whenever traffic in the North-South direction sees red at intersection 313. As shown in Figure 2 there are, for each intersection and for each cycle, two decision variables: Tg t 2 k 1 t 2 k (the green period) representing the time duration between switching times t 2 k and t 2 k 1 , and Tr t 2 k 2 t 2 k 1 (the red period between
t2 k 1 and t 2 k 2 ). The traffic signal control problem determines for each cycle, a good value for these two decision variables, minimizing some cost function, typically depending on the expected evolution of the queue-length. The design of a good traffic controller therefore requires that a good model is available describing the evolution of the arrival and departure traffic flows, k (a non-negative random process defined such that k.(t2.k+2 – t2.k) vehicles enter the intersection during the k-th cycle, from t2k to t2(k+1) ) and k (a non-negative random process such that k.(t2k+1 – t2k) vehicles cross the intersection during the k-th green period from t2k till t2k+1). Note that the departure flow rate takes the value 0 whenever the traffic light is red for the corresponding direction. The purpose of this paper is to identify the parameters of the stochastic hybrid model describing the evolution of k and of k, k = 1,2,.... Our parameter estimation algorithm uses real data from sensors at the location where the model is to be applied.
L13
D_F_1_3
D_F_1_4
L14
313 D_F_1_1
L12 D_F_1_2
8 9 10
L11 L23 D_F_2_4
D_F_2_3
9
L24
314
12
L22
D_F_2_2 D_F_2_1
67
L21
Figure.1 Configuration of area under investigation
5
T-cycle k
T-cycle k+1
Tg
Green
movement L2
Green
and L4 Tr
Green
t2
t2k
k
+1
Green
movement L1 and L3
t2(k+1)
Figure 2. Signal Traffic Sequence
Consider 4 queues ℓ= 1,…,4 at 4 approach roads to an intersection (like I-313 or I-314 in fig. 1), and assume that the evolution of arrival rate ℓ,k and departure rate ℓ,k is well defined by the parameters of the stochastic hybrid model identified with sufficient accuracy by the methods proposed in section 4. Further on we consider only one queue at a time, and hence we drop the subscript ℓ to simplify the notation. Define a ‘clock’ state variable zi (t ) [ z1 (t ) , z2 (t ) ] , associated with the GREEN light cycle for queues {1, 3} and for {2, 4} respectively; z1 (t ) measures the time since the last switch from RED to GREEN of the traffic light for queues {1, 3} . It is reset to 0 as soon as the GREEN cycle length 1 is reached and remains at this value while the light is GREEN for queues {2, 4} ; as soon as the cycle ends, i.e., z 2 (t ) 2 ,
then z1 (t ) is reset to 1 and the process repeats. The same applies to z2(t), but for determining the evolution of queues {2, 4} . This provides the control designer with a complete model for predicting the queue sizes x j (t ) for the j-th queue :
j (t ) x j (t ) 0 j (t ) j (t )
if z1 (t ) 0, j 1, 3 or z 2 (t ) 0, j 2, 4 if x j (t ) 0 and j (t ) j (t ) otherwise
(2)
The operation of the intersection can be modelled as a stochastic hybrid system as shown in Fig.3 with the time-driven dynamics described by equation (2) and event-driven dynamics dictated by GREEN-RED light switches and by events causing some x j (t ) to switch from positive to zero or vice versa. We can describe the evolution of queue-length xj(t) for example by a Stochastic Hybrid Automaton as shown in Figure 3, equivalent to equation (2). The event set that affects the evolution of queue xj(t) is E {e1 , e2 , e3 , e4 , e5 } (dropping again subscripts j in order not to overload the notation), where : (a) e1 corresponds to the value of j (t ) j (t ) becoming strictly positive (after a period where it was non-positive), ( b) e2 corresponds to a switch of j (t ) from 0 to strictly positive, (c) e3 corresponds to the queue-length becoming empty, i.e., x j 0 , (d) e4 switches a traffic light from RED to GREEN, (e) e5 switches a traffic light from GREEN to RED.
6
Mode-2
e5
Mode-1
x 1 1, R ( t )
x1 1,G (t ) 1 (t )
e4
[ x1 0 , 0 z1 (t ) 1 ]
[ x1 0 , z1 (t ) 0 ]
e1 e3
e2
x1 0 [ x1 0 ]
Mode-3
Figure 3. Stochastic Hybrid Automata 3. Jump Markov Model Structure In this section we describe in detail the stochastic hybrid model, also called further on the jump Markov model (JMM), for a generic traffic flow rate k (which could represent the arrival flow rate k or the departure flow rate k ). During a period of time when the traffic conditions, also called the mode s of operation of the traffic, remains unchanged, this variable k is modelled by a first-order autoregressive (AR) model: k 1 (s) (s) k wk (3) (where (s) and (s) are mode-dependent parameters to be identified, and wk , k 1, 2, .... is an independently identically distributed sequence of zero mean random variables with variance 2 ( s) , with 2 ( s) also a mode dependent parameter to be identified). The fluid flow assumption of this paper implies that the traffic flow is constant during each interval [tk,tk+1): (t) = k for t [t k , t k 1 ). The traffic flow implication is that during any interval [θ, r)
t [t 2 k t 2( k 1) ) the number of vehicles that cross the location where this model is valid is on the average k .(r ) , and that these vehicles are approximately uniformly distributed over this interval. From time to time the mode s(t) of operation will change, due to external changes of the inflow rate, due to incidents that make the operation more or less efficient, or due to randomness. The mode variable s used above therefore should also be considered as a time varying random process. We assume that the mode changes only occur at times t k when the value of the traffic flow rate k is updated by the AR equations. Therefore, we denote the mode as s k in the interval [t k , t k 1 ). In the traffic model we consider 3 different values for the mode of operation s k 1, 2, 3 :
s k 1 denotes the desirable mode of operation where traffic is flowing normally
without too much interference between successive vehicle; s k 2 denotes the congested mode where vehicles hinder each other significantly, and the system operates inefficiently; s k 3 corresponds to a faulty state, describing outliers in the behaviour that may be due to incidents (like accidents, bad weather conditions). We assume that the mode process s k can be modelled by a Markov chain, i.e. at each time t k
the mode variable s k 1 i changes randomly to the value s k j with a probability ij
7
Prob ( s k j | s k 1 i, s k 2 , s k 3 , ...) which only depends on the most recent mode (or Markov state) s k 1 , not on states further in the past. Equation (3) with its interpretation (t ) k for t [tk , tk 1 ) , together with the Markov chain model for the mode s k provides us with a complete mathematical model of traffic flow. The parameters of this model will be estimated in the next section according to the EM method. In total there are 15 parameters to be estimated.: For each mode s1, 2, 3 the AR model (3) has 3 parameters, (s) , (s) and ( s) 2
The transition matrix ( ij ) of the Markov chain describing the mode process has 3 rows of 3 elements, satisfying the normalization condition
j 1, 2, 3
ij
1, i
The observations, providing the data used in the parameter estimation described in section 5 and section 6, which are also the data that an online traffic controller could use, are obtained by counting the number of vehicles y k passing the location to which the model is applied during the interval t [t k , t k 1 ). This output variables y k is defined as :
y k k .(t k 1 t k ) nk where n k , k 1, 2, ... is a sequence of independent zero mean random variables with known distribution (describing the probabilities of missed vehicles and false detections in the video cameras). Note that the output y k only becomes available at time t 2( k 1) . This is not a problem for our offline parameter estimation algorithm, but it should be taken into account for an online control algorithm.
4. Parameter estimation: EM approach Estimation of the parameters ( ( ( s), ( s), ( s), s 1,2,3 ) of the AR-models, and of 2
the transition probabilities ( ij , i, j 1, 2, 3 ) of the JMM can be performed using an iterative two-step EM procedure. Therefore the EM algorithm allows us to completely identify the JMM stochastic hybrid model proposed in the previous sections as a model for traffic flow. In this section, we develop the application of the EM approach, originally proposed by [8] and further extended in [9,10], to switching systems as our JMM, based on forward-backward recursion or ’smoothing’. A good introduction and survey paper on EM can be found in [11]. This EM approach is formulated in batch or offline form, i.e. it uses a given number of observations obtained over a time interval [0,T) to iteratively find better and better estimates of the unknown parameters of a model that is valid over the period [0,T). This offline approach needs significant memory requirements and processing power for storing and processing large datasets, but this approach is shown to be useful and applicable further on in this paper. In this paper we do reformulate the EM approach proposed by [9] in order to get a simpler and easier algorithm, changing the cost-function in the M-step by adding a weighted term with corresponding smoothed inferences about the currently active mode. The smoothed inferences are the probabilities P S (t ) i y 1t 1 ; that the t -th observation comes from mode i
t-1
given all the information y1 available at time t , where we use the notation t 1 y 1 y1 , y 2 ,, yt 1 . The reason for this modification is that each observation y (t ) belongs
to the i -th mode with probability P S (t ) i y (t ); . By using these smoothed inferences we find a better maximum likelihood estimate. If we transform our AR model to state-space (SS) form then we notice that the SS model can be classified as an observable canonical form (it can
8
be seen as an output feedback form) and the assumption that the mode S (t ) depends on past t 1
only through the value of S (t 1) , implies that the calculation of the
observation y 1
distribution P S (t ) i y 1t 1 ; is a problem of hidden state estimation of hybrid systems, where
0 , 0 , ,...., i ,i , , . The key idea of this calculation is to perform a forwardbackward or ‘smoothing’ filter recursion for each possible mode sequence. The algorithm starts with an arbitrarily chosen vector of 15 independent parameters (see section 3), chosen randomly but using prior information in order to speed up convergence of the algorithm and to increase the probability of converging to the global maximum. The EM technique for hybrid systems requires a method for recursively approximating the conditional probability P S (t ) i y 1t 1 ; , for each index m counting the number of EM iterations. 2 0
2 i
Moreover an algorithm for finding the parameter values that achieves the maximum likelihood must be available. This differs from the approach proposed in [12] for a general non-linear system, where the objective is to find the best estimate of the conditional density p y (t ) | y1t . In the case of hybrid systems, as in this paper, the E-step, indirectly infers about the modes. Since the mode S (t ) , is unobservable, only the expected values of the modes at successive time t, given the observation vector, can be calculated. Since each measurement y (t ) evolves according to the i-th mode with probability
P S (t ) i y 1t ; (given all the data y (t ) , t = 1, 2…., T ), it is reasonable if each component on the right-hand side of equation (4) below has to be weighted with the corresponding smoothed inferences (see Appendix for further details). Therefore, the weighted log-likelihood function is given by (assuming that the noise terms nk have a normal distribution; similar formulae can be written down for other noise distributions): T
L log ( ) log ( i , i , i , ) P( S (t ) i | y1t ; m ) t 2
ln 2 i yt i i yt 1 2 * 2 i2
(4)
A detailed explanation of the EM-algorithm is given below: The E-Step The E-step consists of forward filtering and backward filtering/smoothing and this step m aims to calculate the conditional probabilities P S (t ) i y (t ); m . Assume that is the
parameter vector calculated in the M-step during the m-th iteration and i0 PS (1) i . The algorithm starts with an arbitrarily (but sensibly, as explained above) chosen vector of initial parameters 0 0 0 0 10 , 10 , 12 , 20 , 20 , 22 , 30 , 30 , 32 , 0 i) Step E-1: Forward Filtering : for t = 1,2…., T iterate:
P S (t ) i y1t ; m
; g y (t ) | S (t ); y
P S (t ) i y1t 1 ; m g i y (t ) | S (t ); y1t 1 ; m
PS (t ) i y 3 i
t 1 1
m
i
t 1 1
; m
(5)
where y y1 , y2 ,, yt is the vector of traffic flow measurements available at time t and
t 1
gi y (t ) | S (t ); y1t 1; m is the conditional probability density function at of y(t) time
t
assuming that the mode i is active at time t:
g i y (t ) | S (t ); y ; t 1 1
m
y (t ) i i y (t 1) 2 exp 2 2 2 i i 1
9
and
P S (t 1) i y1t ; m j 1 mji P S (t ) i y1t ; m
3
until P S (T ) i y (T ); m is calculated.
The starting point for the iteration is chosen as : P S (1) i y (1); m im where im is the likelihood of being in mode i obtained in the previous iteration m The Proof of Step E-1 is straightforward using Bayes’ Rules. ii) Step E-2: Backward filtering : for
P S (t ) i y (T );
m
t
= T 1 , T 2 ,..., 1 iterate on
P S (t ) i | y1t ; m P S (t 1) j | y (T ); m ijm
3
P S (t 1) j | y ;
j 1
t 1
m
(6)
See [9] for the proof (taking into account that the structure and terminology used there is completely different from what is used in this paper). The M-Step m 1 In the M-step of the EM algorithm, new and more exact maximum likelihood estimates for all model parameters are calculated. As mentioned previously each component of the loglikelihood function has to be weighted with the corresponding smoothed inference. In particular, for the model defined by equation (3) explicit formulas for the estimates can be derived by setting the partial derivatives of the log-likelihood function to zero and solving the resulting system of non-linear equations by a substitution technique:
PS (t ) i | y(T ), y(t ) y(t 1) T
m
i
t 2
i
PS (t ) i | y(T ),
(7)
T
m
t 2
[ PS (t ) i | y(T ), y(t ) y(t 1)] [ PS (t ) i | y(T ), y(t 1)] T
T
m
i
m
i
t 2
t 2
PS (t ) i | y(T ), y(t 1)
(8)
T
m
2
t 2
[ PS (t ) i | y(T ), y(t ) T
i y (t 1) ] 2
m
i2
t 2
i
(9)
PS (t ) i | y(T ), T
m
t 2
Because equations (7-8-9) are nonlinear, it is not possible to solve analytically for as a function of {y1,y2,..,yT}. However, these equations do suggest an appealing iterative gradient ascent algorithm for finding the maximum likelihood estimate (or in practice a gradient descent for the loglikelihood since the relation between likelihood and log-likelihood is monotonely decreasing). m
Iterating back from T to 1 we obtain im1 P S (1) i y T ; m and the transition probabilities are estimated by using equation (10) (for a proof see [8]).The transition probabilities are restricted only by the condition that ij 0 and ( i1 i 2 i 3 ) 1, i 1, 2, 3 :
10
ijm PS (t 1) i | y 1t ; m t 2 PS (t ) j | y(T ); PS (t ) j | y t 1 ; m 1 T
ijm1
m
t 2 P S (t 1) i | y(T ); m T
(10)
where ijm is the transition probability obtained during the m-th iteration. All values obtained in the M-step are then used as a new parameter vector m1 and im1 , i 1, 2, 3 in the next iteration of the E-step. m1 im1 ,i( m1) , i2 , m1
The algorithm is terminated when m m1 for some preset accuracy. It means that one continues iterating in this fashion until the change between and is smaller than some specified convergence criterion. In the algorithm that we implemented we used the L2 norm, but other norms could also be used. The EM-algorithm can be implemented in 2 different forms, EM and GEM (Generalized EM) [8]. The EM algorithm maximizes the conditional expectation at every iteration, while the GEM only ensures that the likelihood increases at each step. Our implementation follows the GEM form. We avoid oscillations between different modes with identical likelihoods by updating the model only when the likelihood increases. The algorithm implementing this Generalized (G) EM-iteration procedure is shown in Table 1 by referring equations in both E-step and M-step above. m 1
m
Table.1 : GEM Algorithm 1). Initialization 2). Expectation (E) Step 3).Maximization (M) Step
Set m=1. Select ε ϵ R arbitrarily small 1 Initialize to initial guess Set m = m+1 m m Given calculate L using equation (4), (5) and (6)
Set
m 1
to value of by using equation (7), (8), (9) and
(10) that maximize L 4). Convergence check
m 1
Evaluate L . If | L Otherwise go to 2. m 1
m 1
- L |< ε, , stop. m
Related to the algorithm, the two main problems with the its implementation are: (1) the conditional expectation is difficult to compute, and therefore we replace it by smoothed inferences. Thus we use the whole data (batch) obtaining more accurate results, especially for the estimate of the mode of operation at each time t. This the reason why in E-step we need the backward filtering as shown in equation (6). (2) since the convergence may be to a local maximum that is not the global maximum, a good choice of initial conditions is necessary. In our traffic case, we simply choose the initial conditions based on intuitive guesses corresponding to similar historical real measurement data. Since we use a stochastic model with Gaussian noise, the likelihood functions are bounded and the Hessian is always negative definite [20]. Therefore, the sequence converges to a local maximum (of the likelihood, a local minimum of the log-likelihood), proving convergence of our parameter estimation, assuming identifiability of the model (see [19,20]). In practice we found that the urban traffic model propose in this paper always leads to an identifiable system.
5. Experimental layout This section focuses on modeling urban traffic flow, estimating parameter values based on the GEM-algorithm of section 4, using the data over a time window [0,T] for the experiment
11
layout shown in Figure 1. The time-window size is important to define the model that will be used for estimating traffic flow for the next time-window. In this section, we consider as an example the arrival flow and departure flow L11 and
L11 at the intersection I-313, and apply of it the parameter estimation techniques of section 4, using the data obtained during one single day by the video cameras that are part of a currently implemented SCATS traffic control system. The data obtained from the sensors of the SCATS system include measurements of the traffic flow as well as the period of each cycle of each intersection. Let Nks be the number of vehicles passing sensor location s (s=8,9,10 at intersection n=313) during the time intervals [tkn,tkn+1), n=313, then L11k = (N7,314k + N8,314k + N9,314k + N12,314k)/(tk+1314 - tk314), while L11k = (N8,313k + N9,313k + N10,313k)/(tk+1313 - tk313). Note that the k-th sample for arrival and for departure flows does not in general correspond to the same physical time t. Due to this limitation in our experimental setup, for the time being, we will only focus on the study of the development and validation of a model of traffic flow (not a queuelength) as a hybrid system. Online control applications will be treated in a future paper. Aim of the current experiment is to check the practical implementability of our algorithm by identifying the parameters 1 , 1 , 12 , 2 , 2 , 22 , 3 , 3 , 32 , of the JMM model for arrival and departure traffic flows. For this purposes we use as input for the EM-algorithm described above data for one-day (0 pm – 24 am) obtained on September 1, 2012, from the video cameras installed for the operation of the SCATS traffic control system.. The data is taken from the area of Thamrin Street (data courtesy of the Newtel Pte Ltd ). Table 2 shows the 18 parameters of the model for traffic flow thus obtained. It turns out to be feasible to identify all possible modes: free flow mode, congested mode and faulty mode. By using these parameters we can characterize the AR model of the traffic flow in each of the 3 modes, and the transition probability matrix = (ij, I,j = 1,2,3) describing the Markovian mode transition process. Since for all estimated values we find that i 1 , the stationary value Ei y(t ) can be defined Ei y (t )
i , where i 1, 2 and 3. The values of stationary value Ei y(t ) 1 i
can be found in Table.2. It is clear from the results of parameter estimation in Table 2, that the EM technique is able to identify the modes. In the case of traffic flow L11 , the first and third modes have an
average value Ei y(t ) that is almost the same but with very different values of the variance. This might make the results sensitive to how outliers –unlikely or abnormal events or observations - in the data set are treated. In estimation techniques, a standard approach to deal with this outlier issue is to reject any measurement that is at least three standard deviations away from ‘the normal’ measurement. This means that the definition of outlier depends on what we consider the normal variation. A value for the variance that is almost tripled, is a strong indication that the third mode is an outlier mode. This is also obvious from Figure 4 when considering the results for the estimated probabilities for those measurement data y (t ) marked with a circle, indicating that they belong to the third mode. These points in time correspond to events like traffic incidents, persistent counting errors, night counting error. It is important to know the system dynamics at each time, including at these rare events, and to detect when a change in the AR model parameters occurs.
12
# veh / G period Pr(st=1| yt) Pr(st=2| yt) Pr(st=3| yt)
# vehicle pass through lane no 8,9 and 10 of I-313 1 0.5 0
0
100
200
300
400
500
600
700
1 forward filtering backward filtering
0.5 0
0
100
200
300
400
500
600
700
1 forward filtering backward filtering
0.5 0
0
100
200
300
400
500
600
700
600
700
1 forward filtering backward filtering
0.5 0
0
100
200 300 400 500 green-duration index of I 313
Figure 4. One-day (0 pm – 24 am) measurement data of L11 (top graph), JMM based estimated probability of mode s = 1,2,3 (second, third and bottom graph) Table 2. Parameter estimation results Traffic flow
L11
Traffic flow
L11
S n =1
S n =2
S n =3
S n =1
S n =2
S n =3
1 =
2 =
3 =
1 =
2 =
3 =
0.6130
0.9205
0.4579
0.6123
0.8163
0.5033
1
2
3
1
2
3
0.0950
0.0330
0.1459
0.0608
0.0180
0.0373
12 =
22 =
32 =
12 =
22 =
32 =
0.0070
0.0078
0.0222
0.0068
0.0292
0.0045
E1 yt
E2 yt
E3 yt
E1 yt
E2 yt
E3 yt
0.245
0.415
0.269
0.157
0.098
0.075
Transition Probabilities 0 0.1164 0.8836 0 0.9979 0.0021 0.1788 0.0142 0.8071
Transition Probabilities 0.9843 0.0071 0.0086 0.0054 0.9946 0 0.0122 0 0.9878
Figure 4 shows both forward and backward filtering results and it seems that both approaches give similar results in terms of predicting the outliers. Overall, the EM algorithm is able to correctly identify clusters of mode-1, mode-2 or mode-3 operation, meaning that the EM technique is applicable for modelling free flow and the congested modes as well as the faulty/outlier modes.
13
Analysis of Figure.4 and Table 2 shows that the transition probability to the outlier mode for traffic flow L11 is very high. By analyzing the green duration data (not shown here) at times when the probability of an outlier is high, it becomes clear that this is due to the fact that when the traffic volume increases, the green duration is decreasing compared to the previous one. This is an undesirable effect of the control system that can be classified as an error in the timing of the green switches. This implies that traffic flow at those times increases drastically, as shown in fig. 4 with a circle marking. In the case of traffic flow L11 , the EM parameter estimation is also able to identify the modes as shown in Table 2. The performance of this EM algorithm against the weighted log-likelihood function m L can be evaluated and does provide insight in how close the convergence to the true maximum likelihood is feasible. We first analyse the convergence of the algorithm in terms of m the evaluation of L . Figure 5.d shows that, after a short transient period (< 40 iterations) ,
the EM-algorithm decreases the value of the weighted log-likelihood function L - thus also increases the likelihood - as the iterations of the parameter estimation proceed, indicating convergence of the estimated parameters (assuming identifiability). m
L(theta) - Mode 1
L(theta) - Mode 2
3
6
2
4
1
2
0
0
100
200
300
0
0
100
L(theta) - Mode 3 7
4
6
2
5
0
100 200 EM-iteration number
300
4
0
of the EM algorithm for of mode 2 (c) L of mode 3 (d) L Figure.5 Convergence L
100 200 EM-iteration number
k
k
300
L(theta) - total
6
0
200
L11
300
of mode 1 (b) L
: (a) L
k
k
k
6. Model Validation and Estimation In the previous section we analysed the convergence of the log-likelihood parameter estimation to an equilibrium. To validate whether this equilibrium is useful for model based state estimation and for online control we compare in this section the evolution of ^ measurement y (t ) and the estimated values y (t ) , based on a simulation that implements the JMM model of equation (3), with parameter values shown in table 2, identified by EMalgorithm. In other word, model validation is performed by using the model based estimator using the identified model (obtained via EM parameter estimation) and checking how accurately this estimator predicts the traffic flow. As mentioned in the previous section, modes are not directly observable and hence, ‘the smoothed inferences’ about the mode state process are used. There are two different ways in which the smoothed inferences can be used for the model based prediction: (a) equally weighted empirical distributed function (ewedf) , (b) weighted empirical distribution function (wedf).
14
Below we compare the performance of the ewedf and the wedf approach as part of the algorithm for the prediction of the traffic flow rates. For the ewedf approach, we use the natural choice of relating each observation with the most probable mode by letting S (t ) i if
P S (t ) i y1t 1; 0.5 . The evolution of the modes is shown in Figure 6. The mode classification using ewedf does not always work well, especially for cycle-indices around 300 (around 10 am, marked by a red oval). Around this time the probabilities of mode-1, mode-2 and mode-3 are all less than 0.5. The probabilities for all modes can be found in Figure 4. This implies that during this period around 10 a.m., observations cannot be unambiguously classified to one of the modes. The first graph of Figure 7, which shows more detailed results around the cycle time 300, shows that, during this period (again marked by a red oval and represented as ‘mode-0’) the simulation results also show a big difference with the measurement data. In order to overcome this problem we developed the wedf approach where we define weights wf i P S (t ) i y1t 1; , and based on these weights, we predict the measurement by
multiplying the weights wfi and the right-side of equation (3): i i y(t 1) w(t ) and then summing the 3 products (as symbolized by ∑ ) which amounts to averaging over modes: 3
^
y(t ) wf i ( i i y(t 1) w(t )) , i 1
The 2nd graph of Figure 7 shows that wedf gives better predictions results than ewedf, especially during those periods when observations cannot be classified unambiguously to one of the modes. It should be emphasized that both approaches ewedf and wedf use the smoothed inference that was generated by the iterated EM algorithm. These approaches are not easily implementable in real time due to the need for a bigger memory to save the whole available information P S (t ) i y 1t 1 ; , but the approach is quite useful for validating the model.
To overcome the limitation of the offline approach, we developed a method that can be used both for validating the model and for estimating traffic flow in an online algorithm. For the online method, we only use the parameter of the JMM in order to estimate the traffic flow for the next time-window. In this paper we use a type of particle filter technique called observation and transition-based most likely modes tracking particle filter (OTPF) technique for hybrid systems as developed by [14]. We will not discuss in detail the OTPF algorithm that has been implemented in this experiment with N=500. We will use a simulation scenario with different time-window shift in order to study the performance of the JMM based prediction : Simulation is tested in the period of index 350-450 with a hybrid model, which is obtained from the EM-estimated parameters using measurement data from the period with index 1: 350 (corresponding in real time to midnight till approximately 10.30 am). Figure.8 shows the simulation of JMM based prediction w.r.t the scenario above. Simulation with different simulation scenario shows a similar performance (not shown here).
15
# vehicle pass through lane no 6,7,9 and 12 to L1 during cycle duration
# veh/cycle
0.8 0.6 0.4 0.2 0
0
100
200
300
400
500
600
700
200 300 400 500 cycle-duration index of I 314
600
700
Mode-Estimation 3
Mode
2
1
0
0
100
Figure.6 Mode-evolution
ewedf approach
# veh/cycle
0.6 0.4 0.2 0 -0.2 280
measurement data model based simulation 285
290
295
300
305
310
315
320
310
315
320
wedf approach
# veh/cycle
0.8 0.6
measurement data model based simulation
0.4 0.2 0 280
285
290
295 300 305 green-period index of I 313
Figure.7 Measurement data vs model based simulation : ewedf approach ( first graph) and wedf (second graph)
16
Model Validation
# veh/cycle
1 measurement data ewedf based simulation 0.5
0 350
360
370
380
390
400
410
420
430
440
450
410
420
430
440
450
420
430
440
450
# veh/cycle
1 measurement data wedf based simulation 0.5
0 350
360
370
380
390
400
# veh/cycle
1 measurement data PF based simulation 0.5
0 350
360
370
380
390 400 410 green-period index of I 313
Figure.8 the simulation of JMM based prediction The results of the scenario above shows that: (1) EM offline parameter estimation along with a time-window shift technique can be useful and practical for updating the parameters of the JMM hybrid model. In the future we will investigate what choice of window size W is best for estimating and for prediction in the sense that it leads to the most useful results for online traffic light control. One approach to consider is a sliding window method, where the JMM model parameters are updated at times m.W, using measured data yk over the interval k [(m - n).W, m.W-1] to identify the model parameters, and these model parameters are then used over the interval [m.W, (m+1).W) for predicting the traffic flow rate. (2) Based on the update of JMM hybrid model, online PF estimator for the next time-window can be applied and may be a good candidate as a traffic flow state estimator for coordinating traffic light control in small network. This may of course be combined with the sliding window approach. The results above confirm that a good model is pre-requisite for predicting traffic flow. In the context of designing feedback control at a signalized intersection, the prediction is an important factor to anticipate the variability of traffic flow coming from neighbouring intersections. This variability should be anticipated by traffic control in terms of green/red switching in order to reduce the congestion and to reduce the delay time. Many works in traffic engineering consider the prediction of traffic flow in designing traffic light control. Interested readers may refer to paper [15,16]. The data-driven modeling approach of this paper fits into the currently very active research domain trying to take full advantage of the huge amounts of available process data [17,18]. However, this EM offline parameter estimation along with the time-window shift technique has a disadvantage that the performance of state estimator strongly depends on the length of the time window shift. Certainly, the optimal choice of W is a compromise. EM algorithm will estimate the parameters more accurately if the time-window W is long enough. This is reasonable since the EM algorithm needs a certain amount of measurement data for accurate
17
parameter identification. But of course this will affect the ability of adaptive filters to detect a change of the model parameters sufficiently quickly. In the context of the coordinated control, the online parameter estimation approach is a critical part of an adaptive filter and finding the best window size W becomes an interesting research topic for further research. 7. Conclusions This paper proposes a hybrid dynamic system model as a powerful approach for capturing the complicated dynamics of urban traffic flow, including many sources of uncertainty. The model is appealing as traffic flow conditions can be classified into three-modes and the switch between these 3 modes is controlled by a first-order Markov chain. The model is characterized by a set of parameters to be estimated using measured data (e.g. from a video camera overlooking traffic) and it is shown that a time-window shift technique may lead to a useful real time state estimation algorithm, that can be part of a feedback control loop. The study reported in this paper investigated the proposed approach by using actual traffic flow data and confirmed its validity by showing that the smoothed inferences technique and a particle filter based on the identified model provide satisfactory state estimation and correctly capture the random variation of the traffic flow. The proposed hybrid model along with the particle filter estimator will be applied in a paper in preparation for queue length estimators as crucial part for the synthesis of traffic light control. Acknowledgments The authors would like to gratefully acknowledge to ir. Agoes Suwardi and ir. Rosyad from P.T Newtel, Bandung, and also ir. Zulkarnaen Zakaria, MEng from P.T General Intelligent Technology, Bandung for their helpful discussion and assistance of the measurement data. The work of the first and second author was also supported in part by European Community’s Seventh Framework Programmed under Project DISC (Grant Agreement n.INFSO-ICT224498). The work of the first and third author was supported by Research and Innovation Program, Bandung Institute of Technology, 2013 8. References [1].Wang, Yibing., Papageorgiou, Markos., Messmer Albert., Coppola, Pierlugi., Tzimitsi, Atina and Nuzollo, Agustino, ” An adaptive freeway traffic estimator”,Automatica Vol 45 ,issue 1,January 2009. [2].Mihaylova, Lyudmila., Boel, Rene and Hegyi, Andreas ,”Freeway Traffic Estimation within Particle Filtering Framework”,Automatica, vol 43,pp 290300,2007 [3]. Anthony.S and Karlaftis, Matthew G, “Multivariate state space approach for urban traffic flow modeling and prediction,” Transportation Research Part C vol 11, pp. 271– 350, 2003 [4]. Yasdi, R ,”Prediction of road traffic using a neural network approach”, Neural Computing and Application 8, 135-142,1999. [5]. Sutarto, Herman Y., Joelianto, Endra and Sumardi S,Taufik,” Estimation and prediction of road traffic flow using particle filter for real-time traffic control”, IEEE Conference on ICCSII, Bandung, 2013 [6]. Vlahogianni, Eleni I., Matthew G. Karlaftis, and John C. Golias. "Temporal Evolution of Short‐Term Urban Traffic Flow: A Nonlinear Dynamics Approach." Computer‐Aided Civil and Infrastructure Engineering 23.7 (2008): 536-548. [7]. Julves,J. and Boel, R.” A Continuous Petri Net Approach for Model Predictive Control of
18
Traffic Systems”, IEEE Transactions on Systems Man and Cybernetics – Part.A Systems and Humans, August, 2010. [8]. Dempster,A., Laird,N.,Rubin,D.B ,”Maximum Likelihood from incomplete data via the EM algorithm.Journal of Royal Statistics Society,39,1-38,1977. [9]. Hamilton J,”Analysis of time series subject to changes in regime”, Journal of Economics,45,39-70,1990 [10].Kim,C.J.”Dynamics Linear Model with Markov-Switching”, Journal of Economics,60,1-22,1994. [11]. Moon, Todd K,” The Expectation-maximization algorithm”, Signal Processing Magazine, IEEE 13, no.6 (1996) : 47-60. [12]. Schon, Thomas B., Wills, Adrian and Ninness, Brett ,”System Identification of Nonlinear State-Space Models”, Automatica, vol 47(1), January 2011. [13]. Roads and Traffic Authority, SCATS NSW Government, http://www.scats.com.au/ accessed Jan 2014 [14]. Tafazoli,Siamak and Sun, Xuchong,”Hybrid System State Tracking and Fault Detection using Particle Filters”, IEEE Transactions on Control System Technology,Vol 14,No 6,Nov 2006. [15]. Lucas Barcelos de Oliveira, Eduardo Camponogara, ” Multi-agent model predictive control of signaling split in urban traffic networks”, Transportation Research Part C ,18(1), 120-139,2010 [16]. K. Aboudolas, M. Papageorgiou, A. Kouvelas, E.Kosmatopoulos, ” A rolling-horizon quadratic programming approach to the signal control problem in large-scale congested urban road networks”, Transportation Research Part C, 18(5),680-694, 2010. [17]. S.Yin, S.X. Ding, X.Xie and H.Lao. ”A Review on Basic Data-Driven Approaches for Industrial Process Monitoring”, IEEE Transactions on Industrial Electronics, Vol.61.No.11,Nov,2014. [18]. S.Yin, X.Li,H.Guo and O.Kaynak, ” Data Based Technique Focused on Modern Industry: An Overview”, IEEE Transactions On Industrial Electronics, Vol. 61, No 2,Feb,2014. [19]. C. F. WU, ”On the convergence properties of the EM algorithm”, The Annals of Statistics, 11, pp. 95–103, 1983 [20]. L.Ljung, ”System Identification: Theory for the User”, Prentice Hall Inc, New York, 1999.
19