Proceedings of the 2nd International Symposium on Computer, Communication, Control and Automation (ISCCCA-13)
Research on Intelligent Borehole-Surface Electrical Method MultiParameters Detection System Zhengsen Jia, Jun Lin*, Xuetao Li, Lei Shao College of Instrument Science and Electrical Engineering Jilin University Changchun, China
[email protected] [email protected]
Abstract—Accurate detection of the direction of hydraulic fracturing cracks in the oil field is one of the crucial factors in rational exploitation of the remaining oil and enhanced oil recovery. In this paper, using the potential and the potential gradient test methods and virtual instrument technology, we design and develop an intelligent borehole-surface electrical method multi-parameters detection system(BEMDS), which can achieve multi-channel, multi-parameter and high-precision borehole-surface electrical method data acquisition. Joint programming technology of Labview and Matlab gains the simultaneously measurement of the parameters of resistivity and induced polarization. As a result, the drawbacks of the original instrument that measuring single parameters and cannot mutually authenticate has been overcome. Keywords-Virtual Instrument Technology; Borehole-Surface; Multi-Parameters
I.
Intelligent,
INTRODUCTION
The remaining oil is a huge potential resource in the oil extraction process [1]. Fracturing is an important means for the transforming low-permeability reservoir [2]. It will form underground artificial cracks by fracturing which can improve the flow conditions of the stratum, open the blockage and improve wells’ productivity. Borehole-surface fracture monitoring technology uses the distinguishing sensitivity of electrical characteristics to the interface of oil and fracturing fluid to analyze the changes in the electrical parameters before and after fracturing [3, 4], reveal the hydraulic fracture trend and consequently infer the location of the remaining oil. Although traditional electrical measuring instruments could support multi-channel synchronous acquisition, most of them cannot meet the actual needs due to the limitation of channel number and collection points. However, with the increase in the input channel number instrument costs are bound to increase, which cannot meet the needs of modern instruments with low-cost and are scalable. Combined with computer communication technology, SYSTEM uses virtual instrument technology, which make receiver have data acquisition and processing unit, and put intelligent electrode conversion on each collection points, thus, it reduces the instrument costs and increases its scalability at the same time.
II.
MEAUSURING PRINCIPLE OF INTELLIGENT BOREHOLESURFACE ELECTRICAL METHOD MULTI-PARAMETERS DETECTION SYSTEM
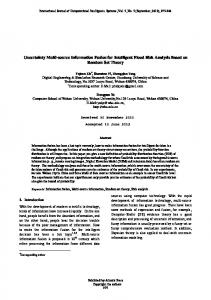
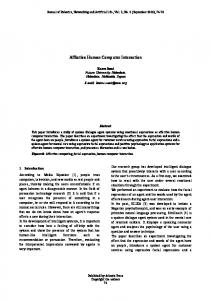
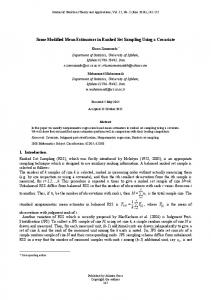
Electrical method is to launch a large current from the surface to well casing. Relative to the several kilometers casing length, the casing diameter can be neglected, so the sleeve can be seen as a line current source. It also equivalent to the line power placed in the vicinity of the target layer due to the density of cement, as shown in Fig. 1. Compared with the stratum of detection well, cement casing processes high resistance, so the current mostly through the surface section, without cement bond interval and perforation interval, flow into underground. In the process of monitoring fracturing, electrode is circularly arranged the centre which is the projection of fracturing segment in the surface. The electrode arrangement schematic diagram shown in Fig. 2, 18 measuring line, every two line spacing 20 degrees, is radically arranged around the well, and each measuring line arrange at least three observation points, the adjacent two fixed points from 50 meters. The measurement processes are based on two fundamental steps: a) Collection: collect the signal before and after fracture. b) Imaging: Calculate the change of the resistivity of the target layer to determine abnormal body azimuth. Induced polarization method is to calculate the first potential and second potential to obtain polarization rate parameters. Consequently, multiple parameters can simultaneously obtain in only one measurement, thereby, increased the working efficiency and ensured the accuracy of measurement results. III. HARDWARE DESIGN OF BOREHOLE-SURFACE ELECTRICAL METHOD MULTI-PARAMETERS DETECTION SYSTEM Borehole-surface electrical method multi-parameters detection system is mainly composed by receiver relay box, sub-station box and non-polarized electrode, as can be seen in Fig. 2: Receiver is mainly composed by front end conditioning module, data acquisition module and master control module,
Published by Atlantis Press, Paris, France. © the authors, 2013 0624
Proceedings of the 2nd International Symposium on Computer, Communication, Control and Automation (ISCCCA-13)
as shown in Fig. 3, Among them, the front end conditioning module including signal calibration, grounding resistance measurement, signal amplification and filtering. A. Front Conditioning Module Design Due to the work field exists uncertain factors, such as DC offset, grounding resistance and so on. DC offset can lead to signal drift too large, which will be beyond AD collection dynamic range, to collect. So we design a feedback loop to correct DC offset. If the electrode does not have a good grounding in the work field process, will cause the signal cannot be normal collected. Therefore, it is very critical to determine whether the electrode well grounded. In the system design, grounding resistance measurement module is added. The constant current source in parallel in each channel input, compare the voltage, which is collected by system, with constant current source current value, to gain the grounding resistance of input terminal. The signal is a low frequency weak signal with strong noise, large dynamic range. It is required high technology in signal conditioning part to get a good signal. We use two stage gauges with instrument programmable amplification method, which is to magnify signal amplification to ADC quantitative best interval under the control of MCU, to improve the dynamic range and sensitivity of the instrument. We use amplifier PGA204 and PGA205 as programmable amplifier (low noise PGA series, manufactured by BB Company). It can reach 1-8000 times programmable magnification. In order to restrain power frequency interference, designed a fourth order Butterworth active low-pass filter in system hardware. Amplitude frequency response characteristic is: It has the most flat amplitude response in the range of less than the cutoff frequency ωc , when
ω > ωc , Amplitude frequency response fell rapidly [5]. B. Data acquisition and control circuit design We selected the ADS8364 as an AD converter chip, 6 channel synchronization acquisition to meet the system multi-channel synchronous acquisition requirements, and also the chip has a reference source with 2.5 V voltages, used as ADS8364 reference voltage. ADS8364 also provides flexible digital interface mode, in the chip configuration mode, software and hardware configuration mode, direct addressing mode, circulation mode and first in first out (FIFO) mode for data output. The system, which is applied three pieces of the chip, through the sequential control realized 18 synchronous acquisitions, use FIFO for speed matching to meet the needs of the USB high-speed transmission. Master control module completed the USB interface control, the system sequential control and system function setting, which is based on USB2.0 peripherals, embedded enhanced 51 of the EZ-USB FX2 series microcontroller CY7C68013-100AC. In order to meet the required USB2.0
transmission of high bandwidth and reduce internal data transmission time, FX2 will be unified use its FIFO and Slave FIFO, which are controlled by a called universal programmable interface (GPIF) FX2 internal clock generator [6]. The system adopt Slave FIFO mode [7, 8]. Peripheral circuits read and write FX2 multilayer buffer FIFO like ordinary FIFO. CPLD charges the control of A/D module and storage and read of data. Its sequence is revealed in Fig. 4. IV. SOFTWARE DESIGN OF BOREHOLE-SURFACE ELECTRICAL METHOD MULTI-PARAMETERS DETECTION SYSTEM The borehole-surface electrical technique multiparameter detection system consists of underlying driver software and the upper function software. With respect to the underlying driver software, it needs to finish corresponding firmware program according to the system control. Fig. 5 shows the framework flow chart of firmware that the framework completes a simple task cycle. First, the framework initializes the internal state variables, then calls the initialization function of user with TD_Init(). After the function returns, the framework initialize USB interface to the none-configuration state and enable interrupt. Then the device re-enumerates per second until the endpoint “0” receives a SETUP packet. Finally, the framework will schedule the interactive task. Write the bottom firmware program of system to the device driver that the controller can call. So that, realized the communication between application of user and USB peripherals to reach the control of upper interface to the lower. The upper functional software applies programming technique combined Labview and Matlab [9] to achieve the functional modular design. Functional block diagram of the software has been presented in Fig. 6. According to the collection requirements, it can perform the system initialization settings, such as selection of acquisition parameters, magnification settings, and acquisition time settings and file storage path settings etc. When measure the grounding resistance and calibrate system, it needs to call these two processing modules respectively to get the grounding resistance and calibration coefficients. And after data have been collected by the receiver, the microcontroller will transmit it to the PC via the USB. Thus, the resistivity parameter calculation module and IP parameters calculation module were sent to the PC, and thereby generate the multiparameter measurements. V.
SINK COMPARATIVE EXPERIMENTS
A. Experimental conditions a) Device type: adopt the ladder device [10], electrode distance AB= 100cm, receiving pole pitch MN= 1 cm, dot pitch = 4 cm, as shown in Fig. 7.
Published by Atlantis Press, Paris, France. © the authors, 2013 0625
Proceedings of the 2nd International Symposium on Computer, Communication, Control and Automation (ISCCCA-13)
b) Abnormal situation: place a metallic copper cuboid at the midpoint of AB, the center point locate on 76, the transverse width of 8cm. c) Measurement Number: A pole (coordinates 26), B pole (coordinates 126), and the measurement begins with point 48 and termination at the point 104, sum to 15 points. d) Situation of power supply: power-on time is 2 s, the entire cycle of 8s, supply current is 200mA. e) Measurement methods: potential compensation is absent in the hardware circuit during the measurement, so all signals acquisition at the same time. Using the method of PC software compensate spontaneous potential. Measurement delay and integration time are both 200ms.
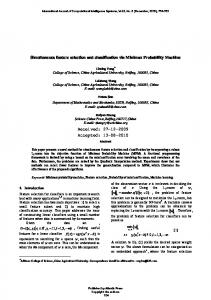
y of each measuring point can be calculated by (1) and (2). F ig. 10 presents the apparent resistivity curve and polarization curve. To visually see the contrast of the two methods, the cu rves of the two parameters is given in a diagram. The red cur ve is apparent resistivity curve, and the blue curve represents the polarization curve. Compare the two curves, one can lear n that these two can both reflecting the exception specific wi dth shape (this copper abnormal body has lateral width of 8 c m, the center point locates on point 76), but the polarization r ate has a higher transverse resolution and tell more accuratel y feature of anomaly relative to the resistivity.
B. Analysis of experimental results:
Zhengsen Jia, Jun Lin, Xuetao Li, Lei Shao thanks for Zhenfeng Li, Kaiguang zhu,kaichang Xue, longlong Shi, Yao Sun, who offer a great support and help in the experiments and the article.
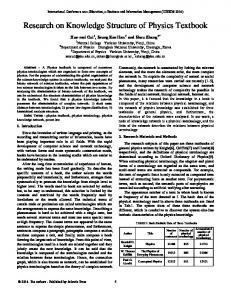
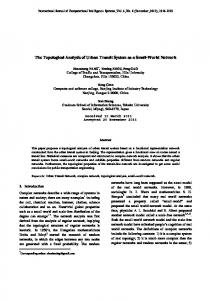
The waveform of TIP collected is revealed in Fig. 8. Through the calculation of TIP module, one can get a potential, secondary potential as well as the polarization rate value. Compared with the measurement results of DWJ-3A microcomputer, the ladder excitation electric anomaly main profile curve (Fig. 9) can be obtained. In Fig. 9, the red curve on the behalf of the polarization curve, and the blue represents the polarization curve measured by DWJ-3A. It can be seen that there will be some error exists, due to the different energization time. Consequently, leading to the slightly different of measuring results obtained two instruments. However, but the variation tendencies from the two are the same. They all project the exception of intermediate copper body, and thereby verified the feasibility of the system function. We also performed the comparative experiments of resistivity method and time domain IP law with our homemade system. The resistivity is calculated by (1): ΔU (1) ρ =K s
I
The ladder device factor can be achieved by(2) K =
2π 1
AM
−
1
AN
−
1
BM
+
1
BN
(2) ΔU , defined as primary voltage values measured by the system, the supply current I= 200mA. The apparent resistivit
Figure 1. Principle diagram of borehole-surface electrical method measurement
ACKNOWLEDGMENT
REFERENCES [1]
B. Y. Gao, S. B. Peng, J. B. Wang, “Research status and develop ment trend of the remaining oil in the formation and distribution”.Chinese J Special Oil & Gas Reservoirs.(in Chinese),2004,11(4):7 [2] Y.J. Huo, “borehole-surface method of testing techniques in the hydraulic fracture detection,” Special Oil & Gas Reservoirs,2007, 12(14), p.117-119 [3] H. Z. WU, Y. S. HE. “Potential method to determine the orient tation of fracturing cracks,” Beijing:Geological Pres s,1986, p.144-153 [4] Z. W. LI, Y. Y. ZHOU. “The application of drilling fracturing the fracture azimuth measuring instrument, ” Chinese J Department of Geology and Mineral Resources of Geophysical and Geochemical Exploration Institute Journal (in Chinese),1987, (01), p.7 [5] H. G. Kang,D. Q. Cheng, “basis of analogue electronic technique,” [M]beijing, Higher Education Press1999, p.366. [6] Y. Yun, J. Lin , “Application research on spectrometer of USB equipment,” J. Name Stand. Abbrev., in press. [7] Y. W. Li, C. R. Wang, USB2.0 principle and engineering development, Beijing, national defense industry press, pp. 10-25 [8] L. S. Shen, The principle and application High speed data acquisition system principle and application, Beijing, Posts & Telecom press,1995 [9] L. R. QU, R. HU, S. K. FAN. LabVIEW, MATLAB, extremely mixed programming.Bjing. Machinery Industry Press, 2011 [10] J. M. Li, Earth electric field and electrical prospecting, Beijing: geological publishing house, 2005, pp. 216-227.
Figure 2. Instrument structure and the measurement mode
Published by Atlantis Press, Paris, France. © the authors, 2013 0626
Proceedings of the 2nd International Symposium on Computer, Communication, Control and Automation (ISCCCA-13)
Figure 3. System structure diagram
Figure 5. System firmware flowchart
Figure 7. TIP Flume experimental measurement methods
Figure 4. CPLD timing sequence
Figure 6. The overall system software block diagram
Figure 8. Acquisition signal waveform of point 76 in experiment of tank TIP
Figure 9. Acquisition signal waveform of point 76 in experiment of tank TIP Figure 10. Contrast picture of apparent resistivity and apparent polarizability
Published by Atlantis Press, Paris, France. © the authors, 2013 0627