Pattern Recognition in Histopathological Images: An ICPR 2010 Contest Metin N. Gurcan1, Anant Madabhushi2, Nasir Rajpoot3 1
Department of Biomedical Informatics, The Ohio State University, Columbus, OH 43210, USA 2 Department of Biomedical Engineering, Rutgers The State University of New Jersey, Piscataway, NJ 08854, USA 3 Department of Computer Science, University of Warwick, Coventry CV4 7AL, UK
[email protected],
[email protected],
[email protected]
http://bmi.osu.edu/cialab/ICPR_contest/
Abstract. The advent of digital whole-slide scanners in recent years has spurred a revolution in imaging technology for histopathology. In order to encourage further interest in histopathological image analysis, we have organized a contest called “Pattern Recognition in Histopathological Image Analysis.” This contest aims to bring some of the pressing issues facing the advance of the rapidly emerging field of digital histology image analysis to the attention of the wider pattern recognition and medical image analysis communities. Two sample histopathological problems are explored: counting lymphocytes and centroblasts. The background to these problems and the evaluation methodology are discussed. Keywords: histopathology, computerized image analysis, pattern recognition, follicular lymphoma
1 Introduction The advent of digital whole-slide scanners in recent years has spurred a revolution in imaging technology for histopathology. The large multi-Giga-pixel images produced by these scanners contain a wealth of information potentially useful for computerassisted disease diagnosis, grading, and prognosis. Processing and analysis of such high-resolution images, however, remain non-trivial tasks, not just because of the sheer size of the images but also due to complexities of the underlying factors, 1
The authors are the organizers of this contest and have contributed equally to this article as well as to the design, preparation and evaluation of the contest.
including variable staining procedures and practices, illumination variations, diversity in imaging devices, and last but not the least the ultimate goal of the analysis. In order to encourage further interest in histopathological image analysis, we have organized a contest called “Pattern Recognition in Histopathological Image Analysis,” as part of the ICPR 2010. This contest aims to bring some of the pressing issues facing the advance of the rapidly emerging field of digital histology image analysis to the attention of the wider pattern recognition and medical image analysis communities. We proposed two problems and provided the training dataset for each problem to the contestants. The problems are described in the following sections and Table 1 summarizes the data information: Dataset Name Problem 1 Problem 2
Number of training images 10 5
Number of test images 10 5
Table 1: Summary of Datasets.
1.1 Problem 1: Counting Lymphocytes on Histopathology Images Breast cancer (BC) is the second leading cause of cancer related deaths in women, with more than 182 000 new cases of invasive BC predicted in the United States for 2008 alone [1]. Although it is a common cancer diagnosis in women, the fact that BC exhibits an exceptionally heterogeneous phenotype in histopathology [2] leads to a variety of prognoses and therapies. One such phenotype is the presence of lymphocytic infiltration (LI) in invasive BC that exhibits amplification of the HER2 gene (HER2+ BC). Most HER2+ BC is currently treated with agents that specifically target the HER2 protein. Researchers have shown that the presence of LI in histopathology is a viable prognostic indicator for various cancers, including HER2+ BC [3]–[5]. The function of LI as a potential antitumor mechanism in BC was first shown by Aaltomaa et al. [4]. More recently, Alexe et al. [5] demonstrated a correlation between the presence of high levels of LI and tumor recurrence in early stage HER2+ BC.The ability to automatically detect and quantify extent of LI on histopathology imagery could potentially result in the development of an image based prognostic tool for Her2+ and ovarian cancer patients. However, lymphocyte segmentation in Haemotoxylin (H) and Eosin (E)-stained histopathology images is complicated by the similarity in appearance between lymphocyte nuclei and other structures (e.g. cancer nuclei) in the image. Additional challenges include biological variability, histological artifacts, and high prevalence of overlapping objects. Although active contours are widely employed in image segmentation, they are limited in their ability to segment overlapping objects and are sensitive to initialization [6].
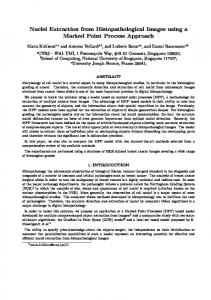
Hematoxylin and eosin (H&E) stained BC biopsy cores were scanned into a computer using a high resolution whole slide scanner (Aperio Systems) at 40x optical magnification at The Cancer Institute of New Jersey (CINJ). A total of 20 HER2+ BC images (from nine patients) exhibiting various levels of LI were used for this competition. The images were downsampled by a factor of 2 and saved as 200 × 200 pixels digital images. The ground truth for spatial presence of LI was obtained via manual detection and segmentation performed by a breast cancer oncologist from CINJ. The ground truth for LI detection evaluation was obtained in the form of highlighted pixels representing the approximate centers of each of the lymphocytes in all 100 images. Note that, since the 20 images comprised over 2000 individual lymphocytes, and on account of the effort involved in manual segmentation, only a few dozen lymphocytes randomly chosen from the set of 20 images were delineated by the expert to allow the evaluation of the segmentation performance of the model. The detection performance of the model, however, was evaluated on all lymphocytes across all 20 images. The H&E-stained histopathology images comprise of four main structures or entities, namely: 1) BC nuclei; 2) lymphocyte nuclei; 3) stroma; and 4) background, as illustrated in Figure 1. Note the extent of overlap between objects and the similarity between lymphocyte nuclei and BC nuclei. Lymphocyte nuclei tend to be stained deeper than BC nuclei and are often smaller in size. Lymphocytic centers were indicated on all the images. A distinct set of testing images will be provided to the contestants on the day of the competition. These images may have been digitized on the same scanner and stained in a different lab compared to the training images.
1.2 Problem 2: Counting Centroblasts from Histology Images of Follicular Lymphoma Follicular Lymphoma (FL), a common type of non-Hodgkins lymphoma, is a cancer of lymph system. According to World Health Organization's recommendations, FL has three histological grades indicating the degree of the malignancy of the tumor [7]. Histological grading of FL is based on the number of centroblasts, large malignant cells, in ten representative neoplastic follicle regions in a high power field (HPF) of 0.159 mm2. Based on this method FL is stratified into three histological grades: FL grade I (0-5 centroblasts/HPF), FL grade II (6-15 centroblasts/HPF) and FL grade III (>15 centroblasts/HPF) ordered from the least to the most malignant subtypes, respectively. Further information about this problem and some previous work in this area can be found in the References [8-17]. There were a total of five images containing centroblasts which were H&E stained and digitized at 40 x resolution to serve as the training set. Centroblast centers were indicated on all the images, as marked by at least two expert pathologists. Figure 2 shows an example image. A distinct set of testing images will be provided to the contestants on the day of the competition. Characteristics of these images will be similar to those of the training images in terms of slide preparation and digitization.
2 Competition Twenty three groups showed interest in the competition and were provided with the training dataset as well as the ground truth for Problems 1 and 2 as described in Sections 1.1 and 1.2. Five of these groups developed algorithms to solve these problems and submitted their results; three groups turned their efforts into papers, which are published in this volume.
3 Evaluation Methodology All the submitted results were evaluated using a standard criteria and automatically. The following sections describe the evaluation methodologies.
3.1 Evaluation Methodology for Problem 1: 3.1.1 Region-based measures The region-based performance measures were defined as follow • Dice Coefficient (DICE) = ; •
Overlap (OL) =
;
•
Sensitivity (SN) =
•
Specificity (SP) =
•
Positive Predictive Value (PPV) =
; ; ,
where is the total number of pixels in the image and represents the cardinality of any set . | | and | | are the areas of the closed boundary of segmentation results and manual delineation, respectively. The values shown in Table 1 are the values obtained by averaging across ten images. Note that higher values for each of the region-based measures indicates superior performance with a maximum value of 1.0 reflecting the best possible segmentation performance, while 0.0 reflecting the worst possible performance. 3.1.2 Boundary-based measures The boundary-based performance measures are defined as follow • Hausdorff distance (HD) =
;
• Mean absolute distance (MAD) = , where and are closed boundaries of segmentation results and manual delineations, respectively. Each of S and G are represented as set of image pixels and respectively, where any pixel c is represented by its two dimensional Cartesian coordinates. is the number of pixels on the closed boundaries of segmentation results. Note that lower values for each of the boundary-based measures indicates
superior performance with a value of 0 reflecting perfect concordance between the boundary obtained via the segmentation algorithm and the expert delineated ground truth.
3.2 Evaluation Methodology for Problem 2: The ground-truth information regarding the centroblasts are the locations marked by a consensus of pathologists. Therefore the evaluation is based on counting the number of true/false detection by comparing the centroid locations of the cells detected by the proposed computerized systems. If the distance between the centroid of a detected cell and the ground-truth marking is less than a threshold (30 pixels, equivalent of ~7.5 microns), then it is considered as a true positive, otherwise it is counted as false positive. The threshold value is determined empirically by measuring the average size of a cell on the training set of images.
Figure 1: Example of a HER2+ BC histopathology image showing lymphocyte nuclei, BC nuclei, stroma and the background. Note the overlap between adjacent nuclei and the similarity in appearance between cancer and lymphocyte nuclei [6].
Figure 2: An example of part of an H&E-stained follicular lymphoma image with centroblasts.
4 Evaluation Results Five groups participated in this competition and only four of these submitted papers. These groups are shown in Table 2. Below we summarize the results of evaluation for both off-line and on-line results for the training and testing data, respectively. 4.1 Evaluation of Off-line Results for the Training Data Submitted results of the five groups participating in this competition are summarized in Tables 3 and 4 below. As seen in these results, for Problem 1, Group 4’s algorithm outperformed all the other methods in terms of both region-based and boundary-based measures of performance. For Problem 2, only two groups submitted their results, again Group 4’s method producing impressive results. However, Group 4 chose not to submit details of their methods for publication in these proceedings. It is worth noting that these results were obtained using training data provided to these groups before the actual contest, where previously unseen test data was given to the contestants for on-site evaluation (please see Section 4.2).
Group 1
People Cheng, J, Veronika, M, Rajapakse, J
2
Gupta, S, Kuse, M, Sharma, T
3
Graf, F, Grzegorzek, M, Paulus, D
4 5
Bruynooghe, M Panagiotakis, C, Ramasso, E, Tziritas, G
Institute Singapore-MIT Alliance, Singapore The LNM Institute of Information Technology, Jaipur, India Institute for Computational Visualistics, University of Koblenz-Landau, Germany
Paper [18]
Alkmaar, The Netherlands Department of Computer Science, University of Crete, Greece
[20]
[19]
[21]
Table 2: Groups participating in the competition.
Group# Group 1 [18] Group 2 [19] Group 3 Group 4 Group 5 [20]
Region-based Measures DICE OL SN SP PPV 0.73 0.57 0.57 1 1 0.74 0.58 0.58 1 1 0.37 0.23 0.23 1 1 0.83 0.71 0.71 1 1 0.74 0.59 0.59 1 1
Boundary-based Measures HD MAD 4.58 0.77 3.63 0.65 21.95 9.14 3.73 0.41 3.51 0.62
Table 3: Evaluation results for Problem 1 (Detecting Lymphocytes in Breast Histopathology Images); Best performance is shown in bold.
Group# Group 1 Group 4
TP R 0.38 1
FPR 0.83 0
Table 4: Evaluation results for Problem 2 (Detecting Centroblasts in Follicular Lymphoma Histopathology Images); Best performance is shown in bold. Centroblast coordinates or contours were not submitted to evaluate more detailed region-based or boundary-based measures. 4.2 On-site Evaluation: All the five groups participated at an on-site evaluation. The groups were given test images which were different from the training images and were asked to run their
programs on these images and provide the organizers with results. The participating groups only attempted the first problem. All groups were evaluated on (a) ability to identify lymphocytic centers and (b) the total number of lymphocytes identified. All groups were asked to provide segmentation results in the form of binary masks with just the centers of the lymphocytes identified. They were also asked to provide the contours of the individual cells, though these were not used for the evaluation (since ground truth evaluation for contours could not be obtained from a second independent expert). For criterion (a) and (b) above, the mean and standard deviation errors were tabulated. For all 4 numbers reported, a smaller number represented a better result. In case of criterion (a) the Euclidean distance d between the ground truth and the result provided by the participants was calculated. In case of criterion (b) the absolute difference between the true number of cells and the number of cells N found by the participating group was identified. Table 5 shows the on-site evaluation results with the ranking of performance, where µ and σ denote the mean and standard deviation, respectively.
Ranking 1 2 3 4
Group µd σd µN Number 2 3.04 3.40 14.01 5 2.87 3.80 14.23 3 7.60 6.30 24.50 1 8.10 6.98 26.67 Table 5: Evaluation results for Problem 1 for on-site evaluation.
σN 4.4 6.3 16.2 12.5
No results were obtained for the Group 4 since they required feeding in the centers of the cells to their segmentation program and since contour evaluation was not performed during the on-site evaluation.
5 Conclusions The main purpose of this contest was to encourage pattern recognition and computer vision researchers in getting involved in the rapidly emerging area of histopathology image analysis. Twenty three groups registered their interest in participating in this contest, while five of these groups actually submitted their results on training data released before the actual contest. Two of the groups submitted results for both the problems, detection of lymphocytes in breast histopathology images and detection of centroblasts in follicular lymphoma histophathology images. Of these, one group has produced quite promising results in terms of both types of performance measures, region-based and boundary-based. Given this was the first contest of its kind, we are encouraged by the level of enthusiasm and interest shown
in this contest so far and look forward to the results of these groups’ algorithms in the actual contest at the conference. Given that digital pathology is a nascent field and that application of pattern recognition and image analysis methods to digitized histopathology even more recent, there is not yet consensus on what level of performance would be acceptable in the clinic. While it is clear that most algorithms in this domain should produce an output which either directly (or via some transformation) correlates highly with clinical and patient outcome, it is not yet clear what level of algorithm performance would suffice towards this goal. Further versions of this competition will thus seek to explore, in a more quantitative fashion, the correlation between algorithmic performance and disease outcome. Acknowledgments. This work was supported in part by Award Number R01CA134451 from the National Cancer Institute (MG), the Wallace H. Coulter Foundation, the National Cancer Institute under Grants R01CA136535‐01, R01 CA140772-01, Grant ARRA‐NCI‐3 R21 CA127186‐02S1, R21CA127186‐01, R03CA128081‐01, and R03CA143991‐01, and the Cancer Institute of New Jersey. The content is solely the responsibility of the authors and does not necessarily represent the official views of the National Cancer Institute, or the National Institutes of Health. The authors would like to thank Olcay Sertel, Jun Xu, Dr. Shridar Ganesan, and Ajay Basavanhally for their help in the preparation of the datasets and evaluation of the results.
References 1. 2. 3. 4. 5.
6.
7.
A. Jemal, R. Siegel, E. Ward, Y. Hao, J. Xu, T. Murray, and M. J. Thun, “Cancer statistics, 2008,” CA Cancer J. Clin., vol. 58, no. 2, pp. 71–96, 2008. F. Bertucci and D. Birnbaum, “Reasons for breast cancer heterogeneity,” J. Biol., vol. 7, no. 6, 2008. J. R. van Nagell, E. S. Donaldson, E. G. Wood, and J. C. Parker, “The significance of vascular invasion and lymphocytic infiltration in invasive cervical cancer,” Cancer, vol. 41, no. 1, pp. 228–234, Jan. 1978. S. Aaltomaa, P. Lipponen, M. Eskelinen, V. M. Kosma, S. Marin, E. Alhava, and K. Syrjanen, “Lymphocyte infiltrates as a prognostic variable in female breast cancer,” Eur. J. Cancer, vol. 28A, no. 4/5, pp. 859–864, 1992. G. Alexe, G. S. Dalgin, D. Scanfeld, P. Tamayo, J. P. Mesirov, C. DeLisi, L. Harris, N. Barnard, M. Martel, A. J. Levine, S. Ganesan, and G. Bhanot, “High expression of lymphocyte-associated genes in node negative her2+ breast cancers correlates with lower recurrence rates,” Cancer Res., vol. 67, no. 22, pp. 10 669–10 676, Nov. 2007. Fatakdawala, H, Basavanhally, A, Xu, J, Bhanot, G, Ganesan, S, Feldman, M, Tomaszewski, J, Madabhushi, A, Expectation Maximization Driven Geodesic Active Contour with Overlap Resolution: Lymphocyte Segmentation on Breast Cancer Histopathology, IEEE Transactions on Biomedical Engineering, vol. 57[7], pp. 1676-89, 2010. (PMID: 20172780) E. S. Jaffe, N. L. Harris, H. Stein, and J. W. Vardiman, World Health Organization Classification of Tumours - Tumours of Haematopoietic and Lymphoid Tissues. Lyon: IARC Press, 2001.
8. 9.
10.
11. 12. 13. 14. 15. 16. 17.
18. 19. 20. 21.
Gurcan MN, Boucheron L, Can A, Madabhushi A, Rajpoot N, Yener B, “Histopathological Image Analysis: A review,” IEEE Reviews in Biomedical Engineering, vol. 2, pp 147-171, (2009) Sertel O, Kong J, Catalyurek UV, Lozanski G, Saltz J, Gurcan MN, “Histopathological image analysis using model-based intermediate representations and color texture: Follicular lymphoma grading,” The Journal of Signal Processing Systems, vol. 55, pp. 169-183, (2009) Cooper L, Sertel O, Kong J, Lozanski G, Huang K, Gurcan MN, “Feature-Based Registration of Histopathology Images with Different Stains: An Application for Computerized Follicular Lymphoma Prognosis,” Computer Methods and Programs in Biomedicine, 96(3), pp. 182-192, (2009) Sertel O, Kong J, Lozanski G, Catalyurek U, Saltz J, Gurcan MN, “Computerized microscopic image analysis of follicular lymphoma,” SPIE Medical Imaging 2008, 16 21 February 2008, San Diego, California Sertel O, Kong J, Catalyurek U, Lozanski G, Shanaah A, Saltz J, Gurcan MN, “Texture classification using nonlinear color quantization: Application to histopathological image analysis,” IEEE ICASSP 2008, March 30-April 4, 2008, Las Vegas, NV Belkacem-Boussaid K, Sertel O, Lozanski G, Shana’aah A, Gurcan MN, "Extraction of color features in the spectral domain to recognize centroblasts in histopathology," IEEE EMBC 2009, September 2-6, 2009, Minneapolis, MN Samsi S, Krishnamurthy AK, Groseclose M, Caprioli RM, Lozanski G, Gurcan MN, "Imaging Mass Spectrometry Analysis for Follicular Lymphoma Grading," IEEE EMBC 2009, September 2-6, 2009, Minneapolis, MN Teodoro G, Sachetto R, Sertel O, Gurcan MN, Meira W, Catalyurek U, Ferreira R, “Coordinating the use of GPU and CPU for improving performance of compute intensive applications,” IEEE Cluster 2009, August 31 – September 4, 2009, New Orleans, LA Belkacem-Boussaid K, Prescott J, Lozanski G, Gurcan MN, “Segmentation of follicular regions on H&E slides using matching filter and active contour models,” SPIE Medical Imaging 2010, 13-18 February 2010, San Diego, California Belkacem-Boussaid K, Pennell M, Lozanski G, Shana’ah A, Gurcan MN, “Effect of pathologist agreement on evaluating a computer-assisted system: Recognizing centroblasts in follicular lymphoma cases,” IEEE ISBI 2010, 14-17 April 2010, Rotterdam, The Netherlands Cheng, J, Veronika, M, Rajapakse, J, “Identifying Cells in Histopathological Images,” Proceedings of the ICPR 2010 Contests, Springer, 2010 Gupta, S, Kuse, M, Sharma, T, “A Classification Scheme for Lymphocyte Segmentation in H&E Stained Histology Images,” Proceedings of the ICPR 2010 Contests, Springer, 2010 Panagiotakis, C, Ramasso, E, Tziritas, G, “Lymphocyte Segmentation using the Transferable Belief Model,” Proceedings of the ICPR 2010 Contests, Springer, 2010 Graf, F, Grzegorzek, M, Paulus, D, “Counting Lymphocytes in Histopathology Images Using Connected Components,” Proceedings of the ICPR 2010 Contests, Springer, 2010