Open Access
et al. Korbel 2009 Volume 10, Issue 2, Article R23
Software
PEMer: a computational framework with simulation-based error models for inferring genomic structural variants from massive paired-end sequencing data
Jan O Korbel*†‡, Alexej Abyzov‡, Xinmeng Jasmine Mu§, Nicholas Carriero¶, Philip Cayting‡, Zhengdong Zhang‡, Michael Snyder‡§ and Mark B Gerstein‡§¶¥ Addresses: *Gene Expression Unit, European Molecular Biology Laboratory (EMBL), Meyerhofstr., Heidelberg, 69117, Germany. †EMBL Outstation Hinxton, EMBL-European Bioinformatics Institute (EMBL-EBI), Wellcome Trust Genome Campus, Hinxton, Cambridge, CB10 1SA, UK. ‡Molecular Biophysics and Biochemistry Department, Yale University, Whitney Ave, New Haven, CT 06520, USA. §Department of Molecular, Cellular, and Developmental Biology, Yale University, Whitney Ave, New Haven, CT 06520, USA. ¶Department of Computer Science, Yale University, Prospect Street, New Haven, CT 06511, USA. ¥Program in Computational Biology and Bioinformatics, Yale University, Whitney Ave, New Haven, CT 06520, USA. Correspondence: Jan O Korbel. Email:
[email protected]
Published: 23 February 2009 Genome Biology 2009, 10:R23 (doi:10.1186/gb-2009-10-2-r23)
Received: 1 September 2008 Revised: 22 December 2008 Accepted: 23 February 2009
The electronic version of this article is the complete one and can be found online at http://genomebiology.com/2009/10/2/R23 © 2009 Korbel et al.; licensee BioMed Central Ltd. This is an open access article distributed under the terms of the Creative Commons Attribution License (http://creativecommons.org/licenses/by/2.0), which permits unrestricted use, distribution, and reproduction in any medium, provided the original work is properly cited.
Paired-End PEMer olution over previous Mapper approaches.
(PEMer) enables mapping of genomic structural variants at considerably enhanced sensitivity, specificity and res-
Abstract Personal-genomics endeavors, such as the 1000 Genomes project, are generating maps of genomic structural variants by analyzing ends of massively sequenced genome fragments. To process these we developed Paired-End Mapper (PEMer; http://sv.gersteinlab.org/pemer). This comprises an analysis pipeline, compatible with several next-generation sequencing platforms; simulation-based error models, yielding confidence-values for each structural variant; and a back-end database. The simulations demonstrated high structural variant reconstruction efficiency for PEMer's coverageadjusted multi-cutoff scoring-strategy and showed its relative insensitivity to base-calling errors.
Rationale
Following the sequencing of the genomes of hundreds of species over the past years, measuring variation within individuals of a species - such as across human beings - has become a center of attention in genomics [1]. While it was long assumed that most of the variation in our genomes is due to single nucleotide polymorphisms (SNPs), the relative importance of another form of genomic variation has been recognized more recently: these are structural variants (SVs), frequently referred to as copy-number variants (CNVs), and here defined as kilobase to megabase sized deletions, insertions, duplications, and inversions. SVs presumably contribute to more base-pair differences between individuals than SNPs
[2,3]. Furthermore, they may have considerable effects on human phenotypic variation [2] by causing common 'normal' phenotypic differences [4,5] and contributing to disease susceptibility [6-9]. A necessary prerequisite for identifying the functional impact of SVs on the genome is the construction of a comprehensive, high-resolution map of SVs across many individuals. However, relatively few approaches are available so far that allow mapping SVs at high resolution and in a cost-efficient manner. Previously, computational approaches have been described that enable detection of SVs at high resolution by either evaluating SNP genotyping information (for example,
Genome Biology 2009, 10:R23
http://genomebiology.com/2009/10/2/R23
Genome Biology 2009,
Volume 10, Issue 2, Article R23
Korbel et al. R23.2
[10,11]), scoring high-density microarray platforms [12-15], measuring DNA sequence read densities [16], detecting split sequence reads [17], or comparing different human genome assemblies [18-20]. Each of these complementary approaches enables the identification of at least a subset of SVs at a reasonable confidence level. However, each method also has drawbacks in terms of overall sensitivity, effective resolution, or efficiency.
based approaches for SV identification. PEMer can process data from several next-generation DNA sequencing platforms, for example, platforms from 454 (Roche), Illumina, and ABI. PEMer can be downloaded from [27], where instructions on how to install the framework are provided.
Results Optimal computational detection of SVs using PEMer
Recent surveys have used paired-end sequence reads to detect SVs in several individuals at high resolution [21-23], enabling identification at high confidence and subsequent analysis of hundreds of SV breakpoint sequences [21,22]. Several paired-end sequence read based methods have been described [21-25], some of which employ next-generation DNA sequencing. One such approach is high-resolution and massive paired-end mapping (PEM) [21]. Paired-end based approaches, including PEM, have several advantages over other SV-detection approaches. They allow SV-reconstruction at higher effective resolution than SNP genotyping-based algorithms and have a higher sensitivity than present microarray-based approaches, which are typically to some extent affected by cross-hybridization in repeat-rich regions. Furthermore, in contrast to SNP genotyping and microarraybased as well as read-depth-based approaches, they enable the identification of copy-number balanced SVs, such as inversions. Moreover, the comprehensive and high-resolution SV identification facilitated by PEM is more economical than assembly comparison or split read analysis. PEM is presently becoming more affordable due to the ongoing developments and cost decreases in next-generation DNA sequencing. Thus, PEM has recently been adopted for SV mapping in personal genomics endeavors such as the 1000 Genomes project and other personal human genome sequencing projects [23,26] as well as for the mapping of structural alterations in cancer tissues [16]. Thus far, paired-end sequence read-based surveys have mostly used custom approaches for SV detection, partially with ad hoc criteria. Although experimental validations indicated a reasonably successful performance of these approaches, a suitably parameterized approach to SV calling will be necessary to generate high confidence SV sets and to optimize the specificity and sensitivity of SV calling. In this regard it is evident that future studies that will utilize dense maps of structural variation in the genome for associating SV genotypes with phenotypic data will rely on high-confidence methods for SV calling. We thus developed a computational approach, Paired-End Mapper (PEMer), for mapping SVs at high resolution with a confidence measure and then analyzing them with a built-in database. Incorporated error models based on extensive simulations facilitated parameterization of PEMer and an evaluation of its performance. We benchmarked the computational approach on different datasets to show that it achieves SV assignments with improved sensitivity and specificity over previous paired-end sequence read
The paired-end sequence reads based method PEM, as well as the underlying strategy used for scoring PEM data, are depicted schematically in Figure 1. In PEM, the end stretches of randomly picked genomic DNA fragments of an individual are sequenced and compared to a reference genome. For that purpose, initially, random genomic DNA fragments with a known and fairly tight size distribution are generated. For instance, the PEM protocol from 454/Roche involves hydrodynamic shearing resulting in a lognormal fragment length distribution centered at the median fragment length, or insert size, L (for example, with L = 2.5 kb; Figure 1). In PEM, indels relative to the reference genome are identified by relating the distance in base-pairs between the fragment ends mapped onto the reference genome (that is, the paired-end span) to the known insert size distribution (Figure 1). Furthermore, by comparing the relative orientations or positions of mapped ends inversions or more complex SV events (see Materials and methods) relative to the reference genome can be identified. Our approach PEMer uses an optimized pipeline for calling SVs from datasets generated by several different nextgeneration sequencing platforms. Therefore, PEMer implements a number of subsequent computational procedures, or steps, which have been developed as a set of modular components (described in detail in the Materials and methods section; see also Figure 1). First, in the 'construct pre-processing' step, the data are formatted into a proper structure. Second, in the 'read-alignment' step ends are first rapidly indexed against and then carefully aligned onto a reference genome. Third, pairs of mapped ends are combined into paired ends in the 'optimal paired-end placement' step. When processing relatively short sequenced ends (for example, such as those generated with the Solexa/Illumina or SOLiD/ABI platforms) we recommend novel read-indexing approaches that directly compensate for variation in the mappability of short sequences in the context of a complex, repeat-rich reference genome [28,29]. Fourth, in the 'outlier-identification' step outlier paired ends are recognized. Outliers are characterized by ends mapping onto the reference genome with a distance that is significantly deviating from expected paired-end spans (indicating an SV indel) or by ends matching onto different strands of a chromosome (indicating an inversion) or in different order relative to each other (potentially indicating a complex SV). Fifth, the 'outlier-clustering' step combines paired ends that likely originated from the same SV into clusters. Sixth, clusters obtained using different parameterizations - that is, by applying different cluster sizes and according cutoffs for outlier identification - are joined in the
Genome Biology 2009, 10:R23
http://genomebiology.com/2009/10/2/R23
Genome Biology 2009,
shear into DNA of sample genome
Marker
fragments
Volume 10, Issue 2, Article R23
Marker
Korbel et al. R23.3
circularize
fragments of length L
select for
cleave randomly
marker
Next-generation sequencing, followed by PEMer analysis [1] construct pre-processing [2] read-alignment [3] optimal paired-end placement
[4] outlier-identification End distance < Ci
[5] outlier-clustering
different cluster sizes N
R
cutoffs Ci
Cd
Insertion
Cluster 1
R
Insertion
Deletion
Cluster 2
Altered end orientation 0
R
4000
Frequency
End distance > Cd
R
R
0 Deletion
[6] cluster-merging
Inversion
median L
5 Paired-end span in kb (end-distance)
[7] Display/storage of final SV set
Figure 1depicting computational steps carried out by PEMer Scheme Scheme depicting computational steps carried out by PEMer. In PEM, when using the 454/Roche platform, randomly sheared genomic fragments are circularized and cleaved randomly into sequence stretches amenable to ultrafast sequencing (figure adapted and extended from Figure 1 in [21]). We subject resulting DNA sequences to PEMer for calling SVs relative to the reference genome ('R'). By default, PEMer uses the following processing steps: [1] construct pre-processing, [2] read-alignment, [3] optimal paired-end placement, [4] outlier-identification, [5] outlier-clustering, and [6] cluster-merging. Subsequently, [7] SVs (insertions, deletions, inversions, and more complex events) are displayed and stored in a back-end database for further analysis. In the outlier identification step, several different cutoff points Ci and Cd for the paired-end span, which are derived from the known insert-size distribution, are applied using a multi-cutoff strategy together with distinct minimally required paired-end cluster sizes N. After merging clusters constructed using different cutoff points, different PEM libraries, or different next-generation DNA sequencing platforms, an enhanced SV call resolution may be achieved.
Genome Biology 2009, 10:R23
http://genomebiology.com/2009/10/2/R23
Genome Biology 2009,
'cluster-merging' step. Cluster-merging further enables combining data from different PEM libraries or from different next-generation sequencing platforms. This in turn helps increase the size range at which SVs can be detected and may add extra confidence in SV assignments through support from independent libraries or platforms.
parameters and SV-calling efficiency. Namely, we placed sets of SVs into a known reference DNA sequence, and then used the modified genomic sequence to simulate PEM experiments. Specifically, simulations were carried out in the context of the general repetitive structure of the genome, with SVs randomly placed relative to highly repetitive elements and segmentally duplicated regions. In our simulations, we furthermore applied a realistic PEM fragment size distribution and a reasonable span coverage (that is, physical coverage, taking into account the amount of DNA sequence in the reference genome spanned by paired ends) expected to be sufficient for detecting most SVs. Instead of using the entire human reference genome, we performed the simulations on a diploid chromosome 2. (The euchromatic regions of chromosome 2 encompass approximately 8% of the genome; thus, simulations required relatively little computing time.) The genomic background was altered by randomly introducing a set of SVs of various sizes near the expected boundary of resolution of PEMer. For instance, we initially chose to generate sets of 100 heterozygous deletions, respectively, in sizes of 1, 2, 3, 4, 5, 6, and 10 kb. These are arbitrary, but suitable, SV set sizes enabling an evaluation of the sensitivity of PEMer. In addition, we also simulated different SV types. Finally, we simulated PEM data generated with different library insert size distributions and with different next-generation DNA sequencing platforms (see below).
Finally, PEMer reports the merged clusters, which can be displayed and stored. To facilitate the display, storage, and further analysis of variants, our approach contains a special database for handling SV data from various sources. The database, for which a schematic is depicted in Figure S1 in Additional data file 1, allows for a smooth connection between called SVs, clusters of outlier paired ends, and the underlying sequence reads. The database enables consideration of complex SV assignments from base-pair resolution data - different SVs may partially overlap in their genomic coordinates or they may be 'embedded' within each other. As such, they may have occurred as a consequence of subsequent, partially intersecting de novo events affecting the same haplotype. Accordingly, we developed a recursive data definition for SVs, in which the coordinates of a SV may be stored either with respect to the reference genome or with respect to one another (Figure 2).
Parameterization and benchmarking of PEMer using simulations It is critical to properly parameterize PEMer in order to optimize the specificity, sensitivity, and resolution of the approach. Since the highly non-uniform nature of the human genome causes difficulties in deriving a parameterization analytically, we chose to use simulations for estimating Reference Genome chrX:1000
VX1 (insertion) VX1:100
VX2 (insertion) VX2:30 VX2:30
VX1:100
VX2:40
chrX:1000
VX3 (deletion)
Figure 2SV Depiction complex ofevents the strategy used for assigning genomic coordinates to Depiction of the strategy used for assigning genomic coordinates to complex SV events. Coordinates within our database BreakDB are stored in a recursive fashion, if multiple SVs with partially overlapping coordinates occurred within a single haplotype. In particular, where a coordinate is typically defined with respect to the reference genome, it can also be defined in respect to other SVs, as indicated in the scheme depicted in the figure. For example, an insertion event can take place within an earlier insertion event, affecting the same haplotype the earlier event occurred in. If coordinates for the second insertion event were reported merely relative to the human reference genome, positional information for the SV would be lost. BreakDB therefore reports both coordinates within the ancestral ('parent') event, but can also trace back all the way to the reference coordinates.
Volume 10, Issue 2, Article R23
Korbel et al. R23.4
Three essential parameters influence the performance of PEMer: the span coverage λ (which is proportional to the insert size L; see Materials and methods); the minimum number N of clustered outlier paired ends necessary for calling a SV; and the cutoff C for calling outliers. Based on the Poisson approximation, we initially estimated that for a diploid genome, a span-coverage λ of 4.75× will be minimally required to cover 95% of the heterozygous SVs within the detection range of PEM by at least two paired ends (see supplementary methods and notes in Additional data file 1). For simplicity, we applied a rounded λ = 5× in most analyses below. We then used PEMer to reconstruct SVs in the simulated genomic DNA and evaluated its performance by applying various values for C and N. We generally applied three distinct strategies for SV identification.
Strategy one The 'single cutoff' strategy was implemented as the previously most widely applied scoring approach for identifying SVs from PEM data (for example, described in [30]). The single cutoff applies a fixed required cluster size N of 2 and regards paired ends as outliers if the measured paired-end span exceeds a certain cutoff C, which is typically set at 3 standard deviations from the median (the median usually can be interchanged with the mean; note, for example, that in case of the 454/Roche platform the median is essentially identical to the mean in log-space). All outlier clusters of size N = 2 or larger are considered as SVs, whereas unclustered outliers are dis-
Genome Biology 2009, 10:R23
http://genomebiology.com/2009/10/2/R23
Genome Biology 2009,
carded. The cluster-merging step is unnecessary when applying this strategy.
4-5 kb or longer (Table 1). However, the multi-cutoff strategy was clearly superior for reconstructing SVs smaller than 4 kb. When applying both strategies with a realistic simulationbased sequencing error (see below) and with parameters resulting in similar false positive call rates, respectively, 30% additional events smaller than 4 kb and 73% additional events smaller or equal to 2 kb were identified with the multi-cutoff compared to the single cutoff, whereas the reconstruction efficiency for events >4 kb was similar among both strategies. Interestingly, the simplified multi-cutoff achieved results that are practically the same as for the multi-cutoff (Table 1) with a decreased computing time. This suggests the existence of a boundary on the optimal cluster size N at a given span coverage.
Strategy two In the 'multi-cutoff' strategy different cluster sizes N from 2 to 6 were applied together with different corresponding cutoffs C for outlier identification (Table S1 in Additional data file 1 and Figure 3). Note that, in theory, N = ∞ represents the limit; however, in reality at λ = 5× we did not observe additional SV calls when setting N to values greater than 6. The multi-cutoff strategy enables an enhanced resolution compared to the single cutoff strategy. In this regard, for a given cluster size N we conservatively defined the optimal cutoff C as the one for which no false positives and a maximum possible number of reconstructed SVs were observed in our simulations.
Strategy three The 'simplified multi-cutoff' was implemented as a compromise between the single cutoff and the multi-cutoff, using only cluster sizes N of 2, 3 and 4. During our simulations, results for the simplified multi-cutoff were nearly identical to the multi-cutoff strategy (Table 1), but had the benefit of a decreased computing time (see below). We initially assessed the SV-reconstruction capability of PEMer for heterozygous deletions by simulating data from the 454/Roche platform, and observed that the single cutoff is efficient and sufficient for the reconstruction of deletions of
Clustered paired-ends 2 3 4 5 6 7
False positives
1000
100
10
1
2
2.2
2.4
2.6
2.8
3
3.2
3.4
SD cutoff
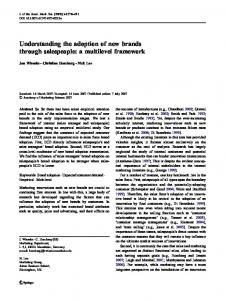
outliers 3 of false positive SV calls in relation to the cutoff used for defining Numbers Figure Numbers of false positive SV calls in relation to the cutoff used for defining outliers. Cutoff values for defining outlier paired ends are given in terms of standard deviations (SDs) from the median of the expected distribution of paired-end spans (which in turn is derived from the insert size). PEM data generated with the 454/Roche platform were simulated applying a median insert size L = 2.5 kb and a span-coverage of λ = 5× of the diploid chromosome 2. To arrive at λ = 5×, only optimally (uniquely) placed paired ends were considered when estimating λ ('effective span coverage'). Here, the genome-wide count of false positives is put in relation to outlier-identification cutoffs for various required cluster sizes N ('clustered paired ends') of 2 up to 7. 'False positives' refers to the number of false positives identified on chromosome 2.
Volume 10, Issue 2, Article R23
Korbel et al. R23.5
False positives were recorded during the simulations as SV calls of any type (deletion, insertion, inversion, or complex) generated by outlier paired ends not resulting from a simulated SV. As we describe in Additional data file 1, we further monitored the generation of false positive calls from chimeric PEM library inserts [21] and found that the effect of such chimera on the false positive rate is negligible. Furthermore, we determined the expected genome-wide number of false positives by scaling the observed number of false positives with the factor 'size of the diploid genome divided by the size of the diploid chromosome 2'. We also derived an analytical formula for calculating numbers of expected false positive deletions and insertions (see Materials and methods) and validated the formula by comparison with the simulation-based results. This enabled us to calculate E-values and P-values for both SV types (Table S2 in Additional data file 1 and Materials and methods). We defined as the false positive rate the number of detected false positives scaled by the number of SVs that we expect to be ascertainable with paired-end sequence-based approaches operating at the size range of PEM - for example, approximately a thousand when using the 454/Roche platform [21]. Using conservative cutoffs expected to result in a false positive rate of approximately 5%, when applying 1,000 as the scaling factor, PEMer reconstructed approximately 90% of all simulated heterozygous deletions >4 kb with λ = 5× (see Results for all three strategies in Table 1), that is, approximately 95% of the SVs expected to be ascertainable (when relating the observed 90% to the 95% of events expected to be ascertainable at λ = 5×; see supplementary methods and notes in Additional data file 1). The rate of false positives can be reduced to near zero by applying more stringent cutoffs, which leads to a slightly diminished reconstruction efficiency (Table S3 in Additional data file 1). Furthermore, we also analyzed heterozygous inversions and insertions by simulation. Specifically, we found that at 5× span coverage heterozygous inversions can be recovered with high reconstruction efficiency (>95%; Table S4 in Additional data file 1) and highly significant E-values (based on simulations; Table S2 in Additional data file 1). On the other hand, heterozygous insertions were reconstructed with poor effi-
Genome Biology 2009, 10:R23
http://genomebiology.com/2009/10/2/R23
Genome Biology 2009,
Volume 10, Issue 2, Article R23
Korbel et al. R23.6
Table 1 Results of simulations indicating the reconstruction efficiency of PEMer for heterozygous deletions of different sizes
SV size
Single cutoff
Multi-cutoff
Simplified multi-cutoff
Multi-cutoff*
Simplified multi-cutoff*
1000
3 (4)
3 (4)
3 (4)
3 (4)
3 (4)
2000
12 (13)
23 (26)
21 (23)
11 (13)
6 (6)
3000
52 (57)
61 (68)
61 (68)
49 (52)
44 (46)
4000
84 (85)
85 (86)
85 (86)
80 (82)
80 (82)
5000
91 (93)
91 (93)
91 (93)
91 (93)
91 (93)
6000
92 (92)
92 (92)
92 (92)
92 (92)
92 (92)
10000
88 (91)
88 (91)
88 (91)
88 (91)
88 (91)
Total
422 (435)
443 (460)
441 (457)
414 (427)
404 (414)
31 (31)
31 (31)
26 (31)
5 (4)
2 (1)
False positives (chromosome 2)
Each row displays statistics for reconstructed heterozygous deletions of a particular size, derived from simulations of 454/Roche based PEM data. Columns show numbers of identified SVs for each reconstruction strategy. Numbers in parentheses correspond to simulated SV reconstructions without sequencing error. All SVs were reconstructed at an effective span coverage λ = 5× (where, λ was assessed after optimal paired-end placement) of a simulated diploid chromosome 2. Note that for the single cutoff strategy events ≥ 5 kb were reconstructed at a level near the theoretical maximum of 95% derived from the Poisson approximation (see supplementary methods and notes in Additional data file 1). However, the multi-cutoff and simplified multi-cutoff strategies outperformed the single cutoff strategy in detecting SVs < 4 kb. *We also applied alternative - that is, optimal - cutoff parameters, for which the sensitivity is similar to the single cutoff, but for which a false positive rate of approximately 5% was observed.
ciency (4 kb were identified with λ = 5×. Furthermore, we observed an increased sensitivity in detecting SVs