Performance Evaluation in Parallel Systems Alexey Borisenko School of Information Technology University of Ottawa
[email protected]
Abstract—In this paper, a summary of performance evaluation is presented, including a discussion of different types of evaluations. The following performance metrics are introduced and defined: speedup, efficiency and scalability. The paper includes a literature survey of performance counters used in multiprocessor systems. A classification is established based on the various parameters of the counters. Next, applications for the performance counters are discussed. An overview of the connection between the hardware of the counters and the OS is given. Tracing using the performance counters is also addressed. Finally, research directions in multiprocessor performance counters is given.
I. I NTRODUCTION Performance evaluation can give the answer to the question of whether a given architecture provides the necessary performance for a chosen problem. The evaluation can take place at different stages of system design, from requirements gathering, to a fully implemented system. The accuracy of the performance evaluation tends to be directly proportional to the progress of a complete system, i.e. the more the system is implemented, the more accurate the evaluation will be. As the implementation of the system progresses, more details and parameters of the system can be evaluated and measured, rather than simulated which gives a much more accurate outlook on the performance of the system. Criteria for deciding performance are called metrics. This paper starts off with a classification of various performance metrics, then describes performance metrics themselves. The performance metrics include speed up, efficiency, scalability. Benchmarks are ways of assessing performance, the types of benchmarks and some practical implementations are outlined. Next, performance monitors, monitors that collect runtime data for system analysis, verification and management, are introduced and some examples of them are given. How the connection between the OS and the hardware monitors is implemented is described briefly, as well as tracing techniques. The paper end on the brief note of what research directions are being taken in the field of performance monitors. II. C LASSIFICATION Performance evaluation can be divided into three categories: measurement, analytical modelling and simulation [1], [2]. The usual procedure is to analytically model the system, i.e. setup a mathematical model with equations describing the states of the system, then perform simulation and finally measure the implemented system. Analytical modelling involves creating a mathematical model of the system. Measurement usually deals with direct measurements using software or hardware
monitors and is only done after system implementation and is meant for performance tuning, although measurements are also done in simulated environments. Analytical modelling and simulation can sometimes be combined into a single modelling scenario. They both deal with abstract models of the system and are oriented towards performance prediction. Contrary to measurement techniques, all three performance categories are used at any stage of the development of the system. Some types of the performance evaluation systems include: • • •
Analytical modelling Queueing networks, Petri nets Simulation Discrete events, trace/execution driven, Monte Carlo Measurement Software, hardware, and hybrid III. P ERFORMANCE METRICS
A performance metric is a measure of a systems performance. It focuses on measuring a certain aspect of the system and allows comparison of various types of systems. The criteria for evaluating performance in parallel computing can include: speedup, efficiency and scalability. Speedup Speedup is the most basic of parameters in multiprocessing systems and shows how much a parallel algorithm is faster than a sequential algorithm. It is defined as follows: Sp =
T1 Tp
(1)
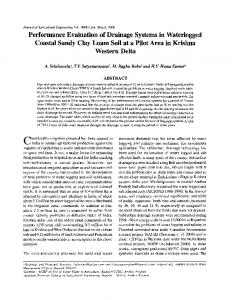
where Sp is the speedup, T1 is the execution time for a sequential algorithm, Tp is the execution time for a parallel algorithm and p is the number of processors. There are three possibilities for speedup: linear, sublinear and super-linear, shown in Figure 1. When Sp = p, i.e. when the speedup is equal to the number of processors, the speedup is called linear. In such a case, doubling the number of processors, will double the speedup. In the case of sub-linear speedup, increasing the number of processors, decreases the speedup. Most algorithms are sub-linear, because of various overheads associated with multiple processors, like communication. This can occur because of the increasing parallel overhead from such areas as: interprocessor communication, load imbalance, synchronization, and extra computation. An interesting case occurs in super-linear speedup, which can mainly be due to cache size increase.
IV. B ENCHMARKS
Fig. 1.
Speedup vs number of processors
An important guideline in regards to speedup is Amdahl’s Law, which states that the performance improvement that can be achieved is limited by the fraction gained in a parallel implementation, Eq. 2,3. Tp = (α + Sp =
1−α )T1 p
T1 (α +
1−α p )T1
=
1 α + 1−α p
(2)
(3)
where α is the fraction of the problem that must be computed sequentially. An enhanced version of the law exists, called Enhanced Amdahl’s law, which includes a parameter for overhead in parallel systems. The overhead arises from synchronization, interprocessor communication and other issues in parallel systems. Eq. 4 shows Enchanced Amdahl’s law. Sp =
(α +
T1 1−α p )T1 +
Toverhead
(4)
Efficiency Another performance metric in parallel computing is efficiency, Eq. 5. It is defined as the achieved fraction of total potential parallel processing gain. It estimates how well the processors are used in solving the problem. Ep =
T1 Sp = p pTp
(5)
where Ep is the efficiency. Scalability Usually, as the number of processors in a system increases, speedup and efficiency will drop because of the associated overheads. Scalability measures the capacity to effectively utilize an increasing number of processors. Modelling systems can be used to predict the scalability of the system. One such example is the SCALA system [3]. SCALA (SCALability Analyzer) is a framework for developing performance modelling and prediction systems.
One way of assessing the performance of a system is through the use of benchmarks. Three types of benchmarks exist: 1) Synthetic benchmarks - artificial programs, which copy the functionality of real programs. Examples include Hyper Pi, Sis oft Sandra, wPrime. 2) Kernel benchmarks - code fragments extracted from real programs. Examples: LINPACK, PARKBENCH. 3) Real application benchmarks - actual real-life applications. Examples: gcc, modern video games, AutoCad. The disadvantages of synthetic benchmarks are that they are easy to optimize for. A system architect might optimize his/her system to provide good results in a synthetic benchmark. Kernel and real application benchmarks tend to give better evaluations compared to synthetic. Challenges associated in creating benchmarks are the variety of sources needed to be tested, i.e. processor, memory, etc. Another issue is the variety of systems architectures needed to be tested for. Finally, selecting a suitable workload is a challenge in benchmark design. Some practical examples of benchmarks include: • SPEC suite - includes a wide range of benchmarks for various aspects, including: testing integer arithmetic, php/jsp performance, smtp/pop performance. A collection of real application benchmarks. • DMIPS - a synthetic benchmark program. Used to evaluate soft-core CPUs. • PARSEC - a suite of real application benchmarks, composed of multithreaded programs. V. P ERFORMANCE MONITORS Performance monitors collect runtime data which can then be analysed for system analysis, verification, and management [4]. Monitors could be used in real-time to auto-tune the performance of the system or the scheduling in a multiprocessor environment. The basic steps of the monitor are: DAQ, Analysis and Result output, some can identify the weak spots of a program and suggest a remedy. Performance monitoring of multiprocessor systems is a greater task than a single-processor system. The number of additional metrics involved in a multiprocessor system, like processor interconnection networks, synchronization overhead make the system more complex. The metrics for performance monitoring stems from the areas of major performance loss in multiprocessor environments. The following are the major areas of performance loss in multiprocessor systems: • Software- inefficient algorithms, synchronization, load imbalance • Hardware- instruction scheduling, instruction, memory stalls, interrupts, branch misprediction For multiprocessing systems, a list of 23 specific parameters was set out by [5]. These parameters need to be monitored to have the full state of the system. An extract of some of the parameters follows:
• • • •
Total cache miss cycles invalidation miss count TLB faults Cycles lost due to stalls
Performance montiors for multiprocessing systems usually implement only one or a small subset of these. The most significant source of performance loss are cache misses which account for 50% of performance loss [6]. Auto-tuning algorithms can use these performance counters to find when and where the program is experiencing performance loss, and adapt to improve the program. VI. M ONITOR CLASSIFICATION A wide variety of performance monitors exist, ranging from simple counters implemented in virtually every processor to FPGA-based hardware systems. A classification was established in [4], [2] Types of monitor classifications include: •
•
•
•
•
Software vs Hardware vs Hybrid Depending upon the level at which a monitor is implemented. Most common classification. Software monitors tend to be more popular. Passive vs. Active Passive monitors observe, collect and store, while active also analyse the data and take corrective action. Centralized vs Distributed Centralized monitors exist at a single central location of a system, typically some communication path. Locating a point which is central to all processors can be an issue, which is overcome by using distributed monitors. Distributed monitors are spread out and associated with multiple corresponding processors. Event driven vs Sampling Event-driven activate only on certain events, while sampling are activated at fixed time intervals. On-line monitors vs Batch monitors Online-monitors display the system state continuously, while batch monitor collect the data, which will later be analysed by a different program.
The following are examples of some of the implementations of monitors.
Fig. 2.
TED hardware monitor[4]
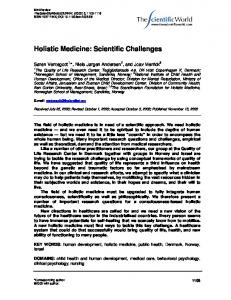
B. Hardware monitors TED hardware monitor is a distributed, event triggered monitor. Figure 2 shows its architecture. The probes of the monitor connect to the bus within the cluster. An event filter looks for the set of events specified in terms of the signals that are being monitored. The counter enumerates the number of events. A FSM unit coordinates the actions of all components. Applications for TED include: event recording and faulttolerance aid. C. Hybrid monitors Hybrid monitors offer a mid-ground between hardware and software monitors. They are less intrusive than purely software monitors and less hardware costs are associated with them. An example of such a monitor is the MSPARC multicomputer performance monitor[10]. Another example of a hardware monitor is the DASH[11], shown in Figure 3. The DASH performance monitor is placed on the directory controller. The monitor consists of two banks of SRAM-based counters, a DRAM-based trace buffer and a programmable controller. VII. AUTO - TUNING AND SCHEDULING WITH PERFORMANCE MONITORS
A. Software monitors The most ubiquitous example of a software monitor is the UNIX program gprof [7], counts number of times a subroutine is called. Although not meant for parallel programs, a lot of monitors for parallel systems were based on gprof. Quartz [8], designed for tuning parallel program performance on shared memory multiprocessors. Principle metric of Quartz is normalized processor time which is the total processor time spent in each section of the code divided by the number of other processors that are concurrently busy when that section of code is being executed. Paradyn[9] is also a parallel performance tool that can automatically search for performance problems in large-scale parallel programs.
One of the main applications of performance monitors is autotuning and scheduling. One goal of scheduling is to effectively use locality of reference, i.e. frequently accessed locations. Scheduling of threads should be aimed at reducing the number if cache misses. There are three scheduling guidelines employed in CMP (Chip Multiprocessor) platforms with multiple shared caches: 1) Better to schedule applications that contend less with each other on the same cache. 2) It is better to schedule applications or threads that share 3) It is better to affinitize applications to caches if their working set is still available on the cache from the previous scheduling.
IX. T RACING Apart from using performance monitors for performance measurement, they can be used for debugging. Tracing all available events over time can generate billions of events even for a moderate program runtime of a few minutes and a handful of CPUs. Intel’s Trace Analyzer and Collector can be used to filter out and present the events, such as cache misses, . It is supported on all Intel processors. The analyzer uses the PAPI interface to communicate with the hardware counters. The tool itself consists of two major parts: the Trace Collector and the Trace Analyzer. The Trace Analyzer simply provides a graphical representation of the trace data. The Trace Collector provides a method for recording performance data. The following can be traced with it: routine calls, communication data, hardware counter data, statistics. With this set of data, the programmer can identify bottlenecks of the program. X. R ESEARCH DIRECTIONS
Fig. 3.
DASH performance monitoring hardware[11]
One example of using scheduling with performance monitors is CacheScout[12]. A CacheScout enabled scheduler detects sharing between threads and employs this knowledge to coschedule sharing threads on the same cache. A CacheScout aware scheduler looks ahead in the queue and attempts to find a waiting task that has significant sharing with the other threads already running on other cores that share the same cache. The CacheScouts’ sharing matrix provides accurate information on sharing between applications and therefore this is used by the scheduler to perform this optimization. VIII. C ONNECTION OF OS/U SER SOFTWARE AND P ERFORMANCE MONITORS Software monitors and user programs can get data from hardware counters and monitors through the following interfaces: Performance Application Programming Interface (PAPI)[13] Common interface to performance-monitoring hardware for many different processors. Gives access to instruction counts, clock cycles, cache misses. Intel VTune Performance Analyzer[14] Supports performance-monitoring hardware of all Intel Pentium and Itanium processors, and provides additional performance analysis tools such as call graph profiling and processor-specific tuning advice. The Rabbit Performance Counter Library Provides a high-level interface to P6-based Pentium processors and AMD Athlon processors on Linux systems. Read and manipulate Intel or AMD processor hardware event counters in C under the Linux operating system.
The current research avenues in this domain are increasing the number of concurrent events that can be handled and supporting more types of events, such as core events, memory hierarchy and coherence, I/O and network traffic. These nextgen properties are being implemented in the BlueGene/P system[15]. XI. C ONCLUSION This paper presented a summary of existing solutions of performance monitors. First, performance parameters were defined. Net, types of monitors were introduced and some real-life examples were given. The topics of tracing, autotuning, and OS to performance hardware connection were touched upon. Finally, the research directions, and what can be expected from future performance monitors was mentioned. R EFERENCES [1] E. Brewer, “Aspects of a high-performance parallel-architecture simulator,” Master’s thesis, Massachusetts Institute of Technology, 1991. [2] R. Jain, The art of computer systems performance analysis: techniques for experimental design, measurement, simulation, and modeling. John Wiley & Sons New York, 1991. [3] X. Sun, T. Fahringer, and M. Pantano, “SCALA: A performance system for scalable computing,” International Journal of High Performance Computing Applications, vol. 16, no. 4, pp. 357–370, 2002. [4] A. Liu and R. Parthasarathi, “Hardware monitoring of a multiprocessor system,” Micro, IEEE, vol. 9, no. 5, pp. 44–51, 2002. [5] G. Lemieux, “Hardware performance monitoring in multiprocessors,” Ph.D. dissertation, Citeseer, 1996. [6] J. Hennessy, D. Patterson, and D. Goldberg, Computer architecture: a quantitative approach. Morgan Kaufmann, 2003. [7] S. Graham, P. Kessler, and M. Mckusick, “Gprof: A call graph execution profiler,” ACM Sigplan Notices, vol. 17, no. 6, pp. 120–126, 1982. [8] T. Anderson and E. Lazowska, “Quartz: A tool for tuning parallel program performance,” ACM SIGMETRICS Performance Evaluation Review, vol. 18, no. 1, pp. 115–125, 1990. [9] “Paradyn parallel tools project,” http://pages.cs.wisc.edu/ paradyn/. [10] J. Harden, D. Reese, F. To, D. Linder, C. Borchert, and G. Jones, “A performance monitor for the msparc multicomputer,” in Southeastcon ’92, Proceedings., IEEE, Apr. 1992, pp. 724 –729 vol.2. [11] D. Lenoski, J. Laudon, K. Gharachorloo, W. Weber, A. Gupta, J. Hennessy, M. Horowitz, and M. Lam, “The stanford dash multiprocessor,” Computer, vol. 25, no. 3, p. 79, 1992.
[12] L. Zhao, R. Iyer, R. Illikkal, J. Moses, S. Makineni, and D. Newell, “Cachescouts: Fine-grain monitoring of shared caches in cmp platforms,” in Parallel Architecture and Compilation Techniques, 2007. PACT 2007. 16th International Conference on, 2007, pp. 339 –352. [13] S. Moore, D. Terpstra, K. London, P. Mucci, P. Teller, L. Salayandia, A. Bayona, and M. Nieto, “Papi deployment, evaluation, and extensions,” in User Group Conference, 2003. Proceedings, 2003, pp. 349 – 353. [14] Intel, “Intel vtune performance analyzer how to guide,” 2010. [15] V. Salapura, K. Ganesan, A. Gara, M. Gschwind, J. Sexton, and R. Walkup, “Next-generation performance counters: Towards monitoring over thousand concurrent events,” in Performance Analysis of Systems and software, 2008. ISPASS 2008. IEEE International Symposium on. IEEE, 2008, pp. 139–146.