the performance between these link quality based metrics with networks of .... a central server, thus serial communication is enabled between the nodes and the ...
Performance Evaluation of Link Quality Estimation Metrics for Static Multihop Wireless Sensor Networks Tao Liu, Ankur Kamthe, Lun Jiang and Alberto Cerpa Computer Science and Engineering, University of California, Merced, CA 95344 {tliu5, akamthe, ljiang2, acerpa}@ucmerced.edu
Abstract—The lossy nature of wireless communication leads to many challenges while designing multihop networks. As an integral part of reliable communication in wireless networks, effective link estimation is essential for routing protocols. Recent studies have shown that link reliability-based metrics like ETX have better performance than traditional metrics such as hop count or latency. Usually, such metrics employ techniques like blacklisting, involving thresholds during the link estimation process. In this paper, we conduct a detailed performance analysis of three commonly used link-quality metrics in wireless sensor networks: ETX, 4Bit, and RNP. We study the interplay between these metrics and CTP, a tree-based routing protocol provided by TinyOS. The objectives of our experiment are two fold. First, by applying different link-quality metrics to the same routing protocol, we provide extensive evaluation on ETX, 4Bit and RNP with insights on their performance under different criteria. Second, we study the impact of the presence or absence of a blacklisting policy when using these link quality estimation metrics. As to our knowledge, this paper is the first to compare the performance between these link quality based metrics with networks of different qualities under realistic conditions.
than a link with consecutive losses. In this paper, we present an extensive performance comparison between ETX, 4B and RNP. These metrics are evaluated on the basis of routing performance in static, multihop wireless sensor networks, with four different network configurations. We also investigate the effects of blacklisting on ETX, 4B and RNP. A link estimator with a blacklisting policy will only consider links with quality above a threshold, and thus minimizes the potential costs for estimating a low quality link that will not be used in routing. Such a threshold is necessary to filter out neighbors with low quality links and avoid pollution of the neighbor table. However, the blacklisting policy may hide some neighbors to the routing protocol, reducing the number of available routing choices. To quantify the difference in performance derived from blacklisting, we conducted experiments using the same link estimator under the same network configuration, with and without blacklisting. II. R ELATED W ORK
I. I NTRODUCTION Due to the dynamic and asymmetric nature of the wireless links, various link quality estimation metrics have been proposed to cope with the vagaries of the wireless channel. In previous research [3] [4] [11] [6], the link reliability estimation metrics have been proved to have better performance than conventional metrics, such as shortest path or minimum latency, in wireless networks. In this paper, we evaluate some of the most commonly used link estimation techniques based on link reliability in the sensor network community. Expected Transmission Count (ETX), proposed by De Couto et al. [3], is based on measuring packet losses between a pair of neighbors. Four-Bit (4B), proposed by Fonseca et al. [5], exploits the radio channel quality information from physical layer, combines it with the ETX estimate and information from the network layer for better path quality estimation. ETX and 4B are implemented in the link estimator of TinyOS, a widely used operating system for wireless sensor networks. Cerpa et al. [2] proposed the Requested Number of Packets (RNP), which considers the temporal characteristics of wireless links while estimating link quality. Given links with identical packet reception ratios, RNP prefers links with discrete losses as they require less number of retransmissions
There is extensive literature comparing the performance of various routing protocols and link estimation techniques. Traditional metrics include hop count, round trip time and latency, but they generally failed to provide a highly reliable path estimation in wireless sensor networks. While proposing ETX, De Couto et al. [3] showed that a reliability based metric can achieve better routing performance than the shortest hop count. Woo et al. [11] outlined an effective design for multihop routing and confirmed that the reliability based metrics such as ETX are more suitable in cost-based routing scenarios. Further comparisons by Draves et al. [4] evaluated the routing performance of several metrics, including minimum hopcount, per-hop Round Trip Time, per-hop Packet Pair Delay and ETX. They concluded that in static wireless networks, ETX performs better than all other metrics. Wireless channel quality is also measured in the physical layer. SNR (Signal to Noise Ratio) is an immediate marker of link quality. D. Lal et al. [8] studied the correlation between SNR and the link quality in energy constrained sensor network. They found that once SNR is above a threshold, the packet success rate will remain high regardless of the actual SNR value, and if SNR is lower than the threshold, packet success rate will drop drastically. As such, they proposed to measure the SNR in
addition to a cost based metric similar as ETX. However, they did not provide a concrete implementation of their proposal. In addition to SNR, recent radios such as CC2420 that are based on IEEE 802.15 standard [7] provide LQI (Link Quality Indicator) to indicate the quality of a received packet. The 4B link estimation proposed by Fonseca et al. [5] incorporates LQI with ETX to provide integrated interface to the routing protocol. The authors showed that by combining information from the physical layer (LQI), link reliability information provided by ETX and routing information from network layer, 4B can achieve a better performance than using LQI alone. Another important factor in link estimation is blacklisting. Link estimators may utilize a blacklisting policy, considering only links with quality above a certain threshold. This minimizes the potential costs for estimating a low quality link that will not be used in routing. However, a blacklisting policy could filter routing options, severely limiting the efficiency of the routing algorithm if an improper threshold is chosen. Gnawali et al. [6] discussed the impact of retransmission and blacklisting on the routing reliability. They evaluated minimum latency metric with different blacklisting thresholds and number of retransmissions. Their results show that a non-quality based metric like minimum latency can achieve the same level of reliability with a carefully chosen blacklisting threshold and retransmission as ETX. However, ETX with a limited number of retransmissions is still a more robust choice that works well across a range of configurations. Unfortunately, their work only explored the effects of applying blacklisting to a nonquality based metric rather than the link quality based ETX. III. L INK Q UALITY M ETRICS A. Expected Number of Transmissions The purpose of ETX is to minimize the number of transmissions for data packets. ETX estimates the number of transmissions needed to send a unicast packet by measuring the delivery rate (or packet reception ratio) of beacon packets between neighboring nodes. The ETX metric for a link can be 1 calculated as df ×d , where df and dr are forward and reverse r delivery rates for a link. To compute df and dr , each node broadcasts beacon packets periodically. Every beacon packet contains the reception rates of beacons received from each of its neighbors. From the beacon packets, a node can read df , the delivery rate from itself to its neighbors, and compute the reverse delivery rate dr by counting the number of lost beacons from its neighboring nodes. ETX is implemented in the link estimator of the Collection Tree Protocol (CTP) [10] in TinyOS. By default, the link estimator employs a blacklisting policy to filter out neighbors with low link quality. B. Requested Number of Packets Cerpa et al. [2] proposed RNP in their study of temporal properties of low power wireless links. The goal of RNP is to account for the distribution of packet losses of a link when estimating link quality. In their study, they discovered that among links with similar delivery rates, a link with discrete
losses can deliver more data packets with the same number of send attempts than a link with consecutive losses over the same period of time. The aim of RNP is to measure the total number of transmissions needed in an Automatic Repeat Request (ARQ) enabled network where the underlying packet loss distribution is known. In this paper, we provide the first actual implementation of RNP for TinyOS. With the same link estimator architecture implemented in CTP, we can compute the RNP of the links between a node and its neighbors. Like ETX, RNP estimator broadcasts beacon packets periodically. To compute RNP for a link, a node records the sequence number of beacons broadcasted by its neighbors and calculates the difference in sequence number (D) between the last two received beacons. A D greater than 1 indicates packet losses, creating a gap in the continuous sequence numbers. In an ARQ network, the lost packets will be retransmitted repeatedly until they are acknowledged by the recipient. Assuming the gap indicates a loss period during which all transmission attempts will fail, then the number of retransmission attempts (R) for the lost beacons of the gap can be calculated as the following: D × (D − 1) 2 To be generic, let us assume N beacons are sent during one estimation. Since multiple packets may be lost during the transmission of total N beacons, multiple gaps may exist. Let G be the number of gaps appearing during the reception of N beacons, and Ri be the number of retransmission attempts for the ith gap. The gaps indicate the underlying packet loss distribution during the transmission of N beacons, so we can calculate the number of transmission required for delivering one packet as the following: PG N + i=1 Ri r= N where r is the total number of transmissions attempts needed for reliably delivering one packet under the packet loss distribution detected by the reception of beacons. A node piggybacks the r value in its own beacon packets so that its neighbors know the forward direction link quality. Therefore, a node can estimate the backward direction link quality by counting the lost beacons and read the forward direction link quality from received beacon packets. For a link, we define the RNP metric used by the routing algorithm as follows: R=
RN P = rf × rb where rf and rb are link quality estimates in forward and backward direction, respectively. RNP metric has the same range with ETX. A lower RNP value indicates better link quality, 1 meaning the link quality is 100%. But it differs from ETX in a number of ways. Firstly, RNP is applicable when a retransmission mechanism is in place, at the MAC or the network layer. Secondly, the RNP value tends to be lower for links with discrete losses compared to links with consecutive losses. As a result, the RNP value of a link can be quite different from ETX.
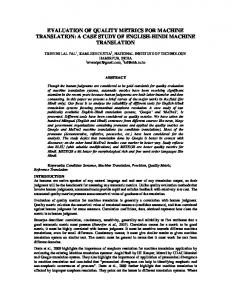
Fig. 1.
The testbed consists of 33 nodes, divided in 11 groups.
C. Four-Bit The 4Bit (4B) link estimation protocol provides well-defined interfaces that combine information from the physical, datalink and network layers 4B uses ETX as its link quality metric. In 4B, the interfaces provide 4 bits of information compiled from different layers: a white bit from the physical layer, denoting the low probability of decoding error in received packets. An ack bit from the link layer to indicate whether an acknowledgment is received for a sent packet. The pin bit and the compare bit are from the network layer. Routing protocols use the pin bit to keep important nodes in the neighbor table maintained by the link estimator and the compare bit to gauge the importance of a link. The 4B link estimator implemented in TinyOS operates as follows: the compare bit interface takes the beacon message received from a neighbor and the white bit as inputs, and finds the neighbor has better quality link, and, more importantly, the neighbor that is irreplaceable for routing proposes. The criteria to set the white bit differs for different platforms. For the CC2420 radio, the white bit is set when the Link Quality Indication (LQI) of a packet is higher than 105. The range of LQI in CC2420 radio chip is from 50 to 110 [1], so a packet with a LQI value greater than 105 indicates that the quality of the received frame is better than 90%.
There are 33 nodes in total, organized into 11 groups of 3 nodes. The nodes are MoteIV Tmote Sky, which comprise of a TI MSP430 micro-controller and a Chipcon CC2420 radio for wireless communications. Within one group, nodes are separated by one foot distance. All the motes are connected to a central server, thus serial communication is enabled between the nodes and the server. C. Experiment Settings
Collection Tree Protocol (CTP) [10] is a tree-based multihop collection protocol in TinyOS 2. We use it with the three metrics to evaluate the routing performance. CTP has three components: a link estimator, a routing engine, and a forwarding engine. The link estimator is responsible for estimating the quality of the links to single-hop neighbors. The link estimator is implemented with ETX and 4B. The routing engine is in charge of choosing the next hop (parent) based on the link estimation as well as network-level information such as congestion. The forwarding engine maintains a queue of packets to send. In our paper, we reimplemented the link estimator to incorporate RNP as the link quality metric.
The experiments were conducted under four different network configurations: 11 nodes with 0 dBm and -10 dBm transmission power; 33 nodes with 0 dBm and -10 dBm transmission power. Under each configuration, we conducted one-hour experiments for all three metrics (ETX, RNP, 4B) with and without blacklisting. In CTP, the root node acts as the sink for the routing tree. To increase the diameter of the network, the root node was set at one end of the corridor (depicted as a star in Fig. 1). In the 11-node experiments, only one node in each group was used. Except for the root node, all nodes send 1 packet/sec to the sink using CTP. In the 33-node experiments, all the nodes are used and the packet sending interval was set to 5 sec to avoid collisions. In all experiments, the payload of each packet was set to 100 bytes, resulting in a packet length of 117 bytes. In summary, we used 2 power levels (0dBm and −10dBm), 2 network densities (11 and 33 nodes), 2 blacklisting policies (with and without) for each link quality estimation metric. We conducted a total of 24 experiments covering the complete set of parameters for each link quality metric. In the 11-node experiments, each node sends about 3,600 data packets with 36,000 packets sent in total. In the 33-node experiments, each node sends about 720 data packets with 23,040 packets sent in total. For each packet, we kept a complete record of the path taken and the number of transmissions on each hop as it is being forwarded by CTP. Our evaluation is based on more than 700,000 packet traces we collected. Note that although the nodes are placed along a corridor, the actual topology is more like a mesh network due to the large number of links. The number of unique paths used by a node can exceed 40 during one experiment.
B. Testbed
D. Data Collection
The testbed is located on one floor of an office building, with the nodes placed along the ceiling of a long corridor. The nodes locations are fixed for all our experiments (see Fig. 1).
For each experiment, the end to end delivery rate, latency and path taken is recorded for each data packet. An exponentially weighted moving average (EWMA) is used to compute the
IV. E XPERIMENTAL M ETHODOLOGY A. Routing Protocol
Tx Power: -10 dBm
ETX RNP 4Bit
1
Avgr. Path Length
Avgr. Path Length
Tx Power: 0 dBm 8 7 6 5 4 3 2 1 0
8 7 6 5 4 3 2 1 0
37 56 74 92 125 140 166 179 203 230 Distance (feet)
ETX RNP 4Bit
1
(a) High Power, 11 Nodes
(b) Low Power, 11 Nodes Tx Power: -10 dBm
ETX RNP 4Bit
1
Avgr. Path Length
Avgr. Path Length
Tx Power: 0 dBm 8 7 6 5 4 3 2 1 0
37 56 74 92 125 140 166 179 203 230 Distance (feet)
(c) High Power, 33 Nodes Fig. 2.
V. E VALUATION In this section, we describe the results of our experiments. Firstly, we present the performance evaluation metrics used to analyze our results. Secondly, we compare the experimental results with the evaluation metrics. Note that the results presented in this section are from experiments with the presence of a blacklisting policy. Finally, we discuss the impact of blacklisting policy on routing performance. A. Evaluation Metrics and Parameters
•
•
8 7 6 5 4 3 2 1 0
ETX RNP 4Bit
1
37 56 74 92 125 140 166 179 203 230 Distance (feet)
(d) Low Power, 33 Nodes
The average path length with respect to node-sink distance.
reception rates of each link with non-zero throughput. This gives a good approximation of the instantaneous reception rate of the link at the time the packet was sent through it. To measure the quality of the path taken by the packet, we computed the product of the instantaneous reception rate of each link that constituted its path. For each path, we also record the number of attempts made for sending the packet at each hop along the path. The sum of all the send attempts per hop is the the number of transmissions required for sending a packet through along that path.
•
37 56 74 92 125 140 166 179 203 230 Distance (feet)
Path Length is the number of hops along a path. It measures routing depth of nodes in the network. The path length affects end-to-end latency and energy usage. Path Quality is the product of link quality for each hop along the path. To provide a uniform measurement for path quality, we define the link quality as the reception rate of a directed link at the time a packet is transmitted. Path quality reflects the end-to-end reliability of a path in the absence of retransmissions. End-to-End Delivery Rate is the total number of packets received at the sink from a specific source node divided
by the total number of packets originating from that source node. • Transmission Overhead refers to the number of send attempts needed to deliver a packet to the sink via an established route. It can be considered as the cost of delivering a packet, which is the summation of the send attempts including retransmissions, at each hop along the path. Transmission overhead is proportional to the total power consumption for delivering a packet in the network, as well as the end-to-end latency. • Routing Overhead is the cost of maintaining a routable network. It can be represented by the number of beacon packets sent during a experiment because the CTP maintains its routing tree by broadcasting beacons. • Stability measures the total number of routing topology changes in the network over a period of time. Most graphs are plotted with the average value and error bars with standard deviation. The values of the different routing metrics are slightly shifted on the x axis to improve readability with overlapping error bars. We also use boxplots in some graphs showing max, min, 1st, 2nd, 3rd quartiles, and average values, so we can provide a better understanding of the underlying distribution of the results. B. Performance Comparison 1) Path Length: Fig. 2 shows the average path length as a function of the distance between source nodes and the sink. In general, the higher the transmission power, the shorter the average path length for any source-sink pairs since high power links can cover a long distance. This can be seen by comparing Figs. 2(a) with 2(b) and Figs. 2(c) with 2(d) respectively. In the 33-node experiments this tendency is less apparent
Tx Power: -10 dBm
1
1
0.8
0.8
Path Quality
Path Quality
Tx Power: 0 dBm
0.6 0.4 0.2
ETX RNP 4Bit
0.6 0.4 0.2
0
ETX RNP 4Bit
0 1
37 56 74 92 125 140 166 179 203 230 Distance (feet)
1
(a) High Power, 11 Nodes
(b) Low power, 11 Nodes Tx Power: -10 dBm
1
1
0.8
0.8
Path Quality
Path Quality
Tx Power: 0 dBm
0.6 0.4 0.2
ETX RNP 4Bit
0.6 0.4 0.2
0
37 56 74 92 125 140 166 179 203 230 Distance (feet)
ETX RNP 4Bit
0 1
37 56 74 92 125 140 166 179 203 230 Distance (feet)
(c) High Power, 33 Nodes Fig. 3.
1
37 56 74 92 125 140 166 179 203 230 Distance (feet)
(d) Low power, 33 Nodes
The average path quality with respect to node-sink distance.
because the high network density leads to a larger number of available paths comparing to the sparse network in the 11node experiments. With some exceptions, there is a general trend of increase in path length as the distance from the source to the sink increases. The exceptions indicates that some links are considerably longer than the others, and they are quite stable. This can be explained with multipath effect. For example, in Fig. 2(b), the nodes farthest from the sink on average have shorter path length than the second farthest nodes since they are at the end of a corridor. Moreover, we can see that the average path length chosen by ETX and 4B is very close. This observation is not surprising since ETX is part of the 4B metric for link estimation. However, RNP chooses shorter paths than both ETX and 4Bit in the most cases. It is because RNP is less sensitive to sparse packet losses, allowing the routing protocol to select links with reasonably high quality that cover longer distances. This is an important characteristic of RNP, and we will discuss its impact on routing performance in the following sections. 2) Path Quality: Fig. 3 shows the average path quality as a function of the distance between source nodes and the sink. In almost all scenarios, the path qualities are above 90%. Only a few exceptions exist in the low power, high network density experiment with RNP. This indicates the most of the paths are constituted of high quality links. For low network density, the three metrics do not show significant differences and tend to pick high path quality links for both low and high power levels, as seen in Figs. 3(a) and 3(b). For high network density, RNP tends to pick paths that do not necessarily have high path quality whereas ETX and 4B tend to pick paths with better quality than RNP,
as shown in Figs. 3(c) and 3(d). In order to investigate the reason for this behavior, we need to look into the definition of RNP. Compared with ETX, RNP gives higher estimation to links with sparse packet losses. When the average reception rate of a link is moderate, e.g., above 70%, the number of lost packets is small compared to the number of delivered packets, and number of consecutive losses should be even smaller. In this case, RNP will give high estimate to the moderate links, making the routing protocol to consider them as well as the high quality links. Since the moderate links can likely cover longer distance than the high quality links do, the routing protocol will be able to select paths with less number of hop using RNP. Note that moderate link quality does not necessarily mean moderate delivery rate due to the retransmission mechanism. 3) Delivery Rate: Figs. 4(a)-4(d) show the average end to end delivery rate as a function of the distance between source nodes and the sink. For low network density (see Figs. 4(a) and 4(b)), the delivery rate is higher than 90% and remains unaffected by the distance and the metric used. In particular, 4B achieves an impressive near 100% delivery rate. In high network density and low power scenario, the average delivery rate remains above 90%, except for a few nodes, as seen in Fig. 4(d). For high power and high network density scenario in Fig. 4(c), the differences are more apparent. ETX keeps a high delivery rate for all the nodes, RNP shows some lower delivery rate in some nodes, and the delivery rate for 4B drops as the distance increases. The worst average delivery rate for any distance using ETX is 96%, whereas the worst average delivery rate for any distance using RNP and 4B is 70% and 82% respectively. Investigation of the cause revealed that the delivery rate drop is caused by hot-spots in the network
1 0.8 0.6 0.4 0.2
ETX RNP 4Bit
0 1
Tx Power: -10 dBm End to End Delivery Rate
End to End Delivery Rate
Tx Power: 0 dBm 1 0.8 0.6 0.4 0.2
ETX RNP 4Bit
0
37 56 74 92 125 140 166 179 203 230 Distance (feet)
1
37 56 74 92 125 140 166 179 203 230 Distance (feet)
(a) High Power, 11 Nodes
(b) Low power, 11 Nodes
1 0.8 0.6 0.4 0.2
ETX RNP 4Bit
0 1
Tx Power: -10 dBm End to End Delivery Rate
End to End Delivery Rate
Tx Power: 0 dBm 1 0.8 0.6 0.4 0.2
ETX RNP 4Bit
0
37 56 74 92 125 140 166 179 203 230 Distance (feet)
1
(c) High Power, 33 Nodes
(d) Low power, 33 Nodes
Tx Power: 0 dBm
Tx Power: -10 dBm
8
12 ETX RNP 4Bit
Num. Tx per Packet
Num. Tx per Packet
12 10
6 4 2 0
10 8
ETX RNP 4Bit
6 4 2 0
1
37 56 74 92 125 140 166 179 203 230
1
Distance (feet)
(f) Low Power, 11 Nodes
Tx Power: 0 dBm
Tx Power: -10 dBm 12
ETX RNP 4Bit
Num. Tx per Packet
Num. Tx per Packet
12
8
37 56 74 92 125 140 166 179 203 230 Distance (feet)
(e) High Power, 11 Nodes
10
37 56 74 92 125 140 166 179 203 230 Distance (feet)
6 4 2 0
10 8
ETX RNP 4Bit
6 4 2 0
1
37 56 74 92 125 140 166 179 203 230 Distance (feet)
(g) High Power, 33 Nodes Fig. 4.
1
37 56 74 92 125 140 166 179 203 230 Distance (feet)
(h) Low Power, 33 Nodes
The average end to end delivery rate and the total number of transmissions with respect to node-sink distance.
topology. The reason of the formation of hot-spots is explained in subsequent sections. 4) Transmission Overhead: The transmission overhead is measured in terms of transmission attempts per packet. Figs. 4(e)-4(h) show the average transmission overhead as a function of the distance between the source nodes and the sink. In general, the transmission overhead is very close to corresponding the path length, suggesting that most packets are successfully received in the first send attempts. This is consistent with the high path quality observed in Fig. 3. An
exception is the low power, high network density scenario in Fig. 4(h), during which the transmission overhead of RNP increases drastically for some nodes. It can be explained by RNP’s low path quality in this case, as depicted in Fig. 3(d). Note that although the number of transmissions required per hop are close to one for all three metrics, the total costs for sending a packet to the sink varies because of the different path lengths and qualities. Fig. 5(a) plots of the overall transmission overheads in all four scenarios. In low density scenarios, the overhead of RNP is lower than ETX and 4B as it sends more
500 ETX RNP 4Bit
Num. of Beacons
Num. of Tx per Packet
18 16 14 12 10 8 6 4 2 0
ETX 400 RNP 4B 300 200 100 0
High Power 11 Nodes
Low Power 11 Nodes
High Power 33 Nodes
Low Power 33 Nodes
High Power Low Power High Power Low Power 11 Nodes 11 Nodes 33 Nodes 33 Nodes
(a) Transmission Overhead Fig. 5.
(b) Routing Overhead
Boxplots of overall transmission overhead and routing overhead
packets through short paths than ETX and 4B. Even though these paths have slightly lower path quality comparing to those chosen by ETX and 4B, the overall cost of sending a packet is still significantly lower in the most cases. Also note that in low power scenarios (see Figs. 4(f) and 4(h)), 4B showed a slight improvement over ETX. The reason behind the 4B’s superior performance might be the interoperability between link estimator and the routing protocol introduced by the pin bit and compare bit, which enable the estimator to be aware of the important neighbors in the routing points of view. Given the small neighbor table in the estimator and the large number of neighbors available with different link qualities in a high density network, such interoperability can provide valuable information for a better neighbor management. 5) Routing Overhead: The routing overhead is the number of beacon packets sent during an experiment. The beacon packets are used by both CTP and the link estimator: CTP broadcasts beacons to proactively maintain a routing tree, while the link estimator use the same beacons to piggyback link quality information. Link estimators rely on the beacon packets to perform link quality measurements, but the beacon broadcasting is fully controlled by CTP. CTP immediately broadcasts a new beacon when the next hop of the current node changes or it detects a better path than the existing one. Otherwise, CTP will broadcast beacon packets periodically. Fig. 5(b) illustrates the number of beacons sent in all four scenarios. When using ETX as link estimator, CTP sends significantly more beacons than it does with RNP or 4B. The routing overhead of RNP is slightly larger than 4B (although not statistically significant). The high routing overhead of ETX indicates frequent routing changes, whereas the low routing overhead of 4B means CTP rarely changes the routing tree with 4B. In the case of ETX, it advise CTP changes its next hop whenever a better path is available, causing CTP constantly send beacons to inform the neighboring nodes about the route change. However, with 4B, routing changes hardly occur because CTP can use compare bit to keep important neighbors in the neighbor table. RNP reacts to link quality changes slower than ETX, but still more responsive than 4B. 6) Stability: The stability of a routing topology is a important factor for high level operations like scheduling and aggregation. In CTP, every node in the routing tree has one and only one parent node. Whenever the parent node changes,
Parameters Power Nodes 0 dBm 11 -10 dBm 11 0 dBm 33 -10 dBm 33 0 dBm 11 -10 dBm 11 0 dBm 33 -10dBm 33
BL Y Y Y Y N N N N
Unique Path ETX RNP 157 11 273 44 795 51 874 79 152 11 369 16 366 203 950 136
4B 10 18 39 59 39 10 64 11
Tree Change ETX RNP 310 1 585 47 1296 19 1159 53 325 1 927 6 495 211 1296 123
4B 0 8 7 27 38 0 41 3
TABLE I ROUTING TOPOLOGY CHANGES DURING THE EXPERIMENTS .
the routing tree will change. Table I lists the number of routing topology changes and the number of unique path taken during each experiment. We observe that nodes with ETX change parents much more frequently than RNP or 4B. 4B exhibits a very stable routing topology due to the fact that the routing protocol can direct 4B to keep certain nodes in its neighbor table for better estimation. RNP is slower to react to quality changes and hence has lower route changes than ETX but slightly higher than 4B. The high number of route changes for ETX reflects its tendency to pick perfect quality links at all times. These greedy approach leads to higher routing overhead, as shown in the previous section. Having a stable routing tree has both advantages and disadvantages. On the one hand, higher-level applications can take advantages of a stable routing tree for in-network data processing, but on the other hand, high density networks with stable routing trees will result in the formation of hot-spots. Since RNP and 4B are more stable with regards to the routing topology, most of the packets are sent along the same route during the entire experiment despite the existence of available alternatives routes to the sink. This leads to formation of hotspots in the network. Nodes in the hot-spots are overwhelmed by incoming packets, forcing them to drop some packets, hence increasing the packet losses that lead to a drop in path quality and end-to-end delivery rate. For example, in the high power, high network density experiment (see Table I, third line), when using ETX the routing topology changed 1296 times in total and almost all the nodes participated in forwarding packets. In contrast, RNP had 51 unique paths, suggesting that each node uses less than 2 alternative routes to forward packets on average. Similarly, 4B had 39 unique paths, and there are only 7 routing changes, which means most nodes used only one route to forward packets. In the case of ETX, the load of forwarding packets
Tx Power: -10 dBm 1 Path Quality
Path Length
Tx Power: -10 dBm 8 7 6 5 4 3 2 1 0
ETX RNP 4Bit
0.8 0.6 0.4 0.2
ETX RNP 4Bit
0 B NB
B NB
B NB
B NB
(a) Path Length
Tx Power: -10 dBm Num. of Tx per packet
End to End Delivery Rate
Tx Power: -10 dBm
0.8 0.6 0.4 ETX RNP 4Bit
0 B NB
B NB
18 16 14 12 10 8 6 4 2 0
ETX RNP 4Bit
B NB
B NB
(c) Delivery Rate Fig. 6.
B NB
(b) Path Quality
1
0.2
B NB
B NB
B NB
(d) TX Overhead
Path length, path quality, delivery rate and transmission overhead for experiments with and w/o blacklisting in 33-node network and low power.
is evenly distributed on the whole network. However, in the cases of RNP and 4B, most of the packets were forwarded along fewer (or almost one in the case of 4B) several high quality paths, creating hot-spots in the network and degrading the delivery rates, as seen in Fig. 4(c). C. Impact of Blacklisting In this section, we evaluate the effect of imposing a blacklisting policy. All results presented in previous sections were collected with blacklisting activated. By default, the TinyOS link estimator for ETX and 4B employs a blacklisting policy with a threshold of delivery rate 18%. For RNP, the threshold cannot be represented simply as a fraction of delivery rate because the RNP value changes as the distribution of losses change. In our implementation, RNP blacklists a link when delivery rate drops below approximately 20%. Our experimental results do not exhibit obvious differences in low network density configurations regardless of the presence or absence of blacklisting. This is because the link estimator has the capacity to handle all 11 nodes in the network. However, in the 33-node experiments, RNP and 4B perform quite differently with or without blacklisting whereas ETX is not affected by the absence or presence of blacklisting. For the sake of brevity, we omitted the figures in high network density and high power since they present similar behavior than the low power scenarios. Fig. 6 shows the three routing metrics operating with (B) and without (NB) blacklisting in the terms of overall path quality, path length, delivery rate and transmission overhead. Fig. 6(a) shows an improvement in all three metrics by reducing the path length, with the most notable improvement by 4B. However, this improvement comes at a cost for the 4B case, since there is a significant path quality and end-to-end delivery degradation as seen in Figs. 6(b) and 6(c). Both ETX
and RNP actually improve path quality without blacklisting. Similarly, in Fig. 6(d) the overall transmission overhead is improved in both ETX and RNP without blacklisting, while the 4B case makes the average case worse. D. Summary •
•
•
•
•
•
RNP takes advantage of long links and chooses shorter path length in comparison to ETX and 4B. All three metrics show near perfect path quality in most cases. RNP shows slightly lower path quality in high network density scenarios. End-to-end delivery rates are also near 100% for all three metrics. RNP and 4B show slight delivery rate degradation in high network density scenarios. RNP has a better cost per packet in low network density scenarios than the other metrics. ETX leads to a much higher routing overhead cost and forces routing to send significantly more beacon packets than RNP and 4B. The impact of blacklisting is not significant for ETX. RNP’s performance improves slightly without blacklisting. On the other hand, 4B performs much worse with the absence of blacklisting in all comparison metrics. VI. D ISCUSSION
As discussed in Section V-B, RNP is more tolerant to losses when the link quality is moderate. So, RNP gives the better estimated value to links with a wider range of delivery rates as compared to ETX. From the routing perspective, RNP allows the routing protocol to select paths with less total numbers of hops to set up a route with reasonable quality. Although packet losses occur more frequently in longer links of moderate quality, the retransmission mechanism in the routing protocol can still ensure a high delivery rate with
a few retransmissions. This is reflected in our experiments where RNP chooses paths with less hops than the other two metrics as seen in Fig. 2. This characteristic of RNP leads to a smaller overhead for delivering a packet, while maintaining a high end to end delivery rate that is comparable to that of ETX and 4B as seen in Figs. 4(a) and 4(b). However, RNP’s tolerance on sparse losses make it less responsive to changes in link quality than ETX. This causes RNP to change route when the link quality to the next hop drops to a very low level. In this case, the retransmission can no longer compensate for the high packet losses. Moreover, in high network density environments, excessive retransmissions increase contentions in the network, lowering the end to end delivery rates of RNP in comparison to ETX and 4B, as seen in Figs. 4(c) and 4(d). ETX and 4B exhibit the same preference in choosing paths with near perfect links. As a result, the average path length for ETX and 4B is almost the same. Since ETX selects parent nodes based solely on the quality of its neighbors, it has better path quality and is more adaptive to changes in link quality in a variety of scenarios. This very greedy adaptivity comes at a cost, since ETX significantly increases the routing overhead of the routing algorithm by constantly trying to pick the best instantaneous neighbor, as shown by Table I. While this behavior has the advantage of implicitly spreading the load among all nodes, we believe load balancing schemes should be implemented in higher layers and not at the link layer. 4B allows CTP to choose better neighbors when the neighbor table is full. As a routing protocol, CTP tends to choose nodes with high quality path to the sink. This results in a very stable routing topology for the entire network (see Table I), comprising of directed links to the sink. However, paths from multiple nodes to the sink will intrinsically lead to congestion at some shared links. This may cause degradation in link quality and hence, lowers the path quality and end-to-end delivery rate, especially in high density networks. On the one hand, RNP exhibits slightly better performance in the absence of blacklisting with better path quality, higher delivery rates and less overhead, refer to Figs. 6. This is because RNP could be more aggressive in picking longer links that would be filtered out, improving performance. On the other hand, 4B performs much worse without blacklisting, especially in high network density configuration. This counter-intuitive result can be explained by the design of the link estimator. Regardless of the metric, the link estimator maintains records for its 10 best neighbors by link quality. With blacklisting, a particular threshold is defined, and the link estimator rejects any new neighbor if the neighbor table is full and all the entries in it are larger than this blacklisting threshold, preventing the evaluation of potentially better quality neighbors. Without blacklisting, this threshold does not exist, and the link estimator simply replaces the lowest quality neighbor in its table, allowing the evaluation of all potential neighbors. This explains why ETX and RNP perform slightly better. In the case of 4B, if a new neighbor passes the blacklist threshold, the link estimator consults the routing protocol to evaluate the neighbor. If this neighbor has a high quality path
to the sink, the routing protocol instructs the link estimator to include this node in the neighbor table. In this case, 4B relies on blacklisting to filter out neighbors with low link quality. With blacklisting absent, the neighbor table will be polluted by neighbors with high quality path to the sink but low link quality to the node itself. In high density networks, the number of such neighbors will be big enough to affect the routing choices made in 4B, resulting in poor delivery rate as seen in Fig. 6(c). VII. C ONCLUSION In this paper, we evaluated the performance of ETX, RNP and 4B in a variety of network configurations. Our paper is the first to provide an implementation of the RNP metric in TinyOS. By applying different link quality metrics to the same routing protocol, CTP, we compared their performance with regards to path length, path quality, delivery rate, transmission overhead and network stability. In addition, we studied the effects of those metrics in the presence of different blacklisting policies and discovered several interesting properties. Future work involves improvements to the RNP implementation and integration into different routing protocols. ACKNOWLEDGMENTS This work was supported in part by the California Energy Commission (CEC) and California Institute for the Energy and the Environment (CIEE) under grant #MCU-09-03. We would like to thank the reviewers for their valuable comments. S OFTWARE The code with the RNP metric implementation integrated with CTP for TinyOS 2.0 can be found here: http://www.andes.ucmerced.edu/software/ R EFERENCES [1] CC2420 2.4 GHz IEEE 802.15.4 / ZigBee-ready RF Transceiver. http://www.ti.com/lit/gpn/cc2420 [2] A. Cerpa, J. L. Wong, M Potkonjak and D. Estrin. Temporal Properties of Low Power Wireless Links: Modeling and Implications on Multi-Hop Routing. In MobiHoc’05, Urbana-Champaign, IL, May 2005. [3] D. D. Couto, D. Aguayo, J. Bicket, and R. Morris. A High-Throughput Path Metric for Multi-hop Wireless Routing. In MobiCom’03, San Diego, CA, Sept. 2003. [4] R. Draves, J. Padhye and B. Zill. Comparison of Routing Metrics for Static Multi-Hop Wireless Networks. In SIGCOMM’04, Portland, Oregon, Sept. 2004. [5] R. Fonseca, O. Gnawali, K. Jamiesion and P. Levis. Four-Bit Wireless Link Estimation. In HotNets’07, Atlanta, GA, 2007. [6] O. Gnawali, M. Yarvis, J. Heidemann and R. Govindan. Interaction of Retransmission, Blacklisting, and Routing Metrics for Reliability in Sensor Network Routing. In SECON’04, Santa Clara, CA, Oct. 2004. [7] IEEE Standard 802.15.4. http://standards.ieee.org/ getieee802/download/802.15.4-2003.pdf [8] D. Lal, A. Manjeshwar, F. Herrmann, E. Uysal-Biyikoglu, A. Keshavarzian. Measurement and Characterization of Link Quality Metrics in Energy Constrained Wireless Sensor Networks. In GLOBECOM’03, San Francisco, 2003. [9] TinyOS 2.x. http://www.tinyos.net [10] TinyOS TEP 123: Collection Tree Protocol. http://www.tinyos.net/tinyos-2.x/doc/txt/tep123.txt [11] A. Woo, T. Tong, and D. Culler. Taming the Underlying Challenges of Reliable Multihop Routing in Sensor Networks. In SenSys’03, Los Angeles, CA, Nov. 2003.