Performance Metrics and Evaluation Issues for Continuous Activity Recognition David Minnen, Tracy Westeyn, and Thad Starner GVU, College of Computing Georgia Institute of Technology {dminn,turtle,thad}@cc.gatech.edu
Jamie A. Ward
Paul Lukowicz
Swiss Federal Institute of Technology (ETH) Wearable Computing Lab
[email protected]
University of Passau Passau, Germany
[email protected]
Abstract— In this paper we examine several factors that influence the evaluation of multi-class, continuous activity recognition. Currently, there is no standard metric for evaluating and comparing such systems, although many possible error formulations and performance metrics could be adapted from other domains. In order to make progress toward a standard metric appropriate for evaluating activity recognition, we outline the sources of errors in such systems, present different methods for detecting and labeling these errors, and compare existing metrics with a more nuanced performance visualization. We conclude with a discussion concerning the interpretation of the visualization for comparing recognition systems in different domains.
I. I NTRODUCTION Activity recognition describes the problem of detecting and identifying activities in time-varying sensor data. Throughout this paper, we will focus on human activities such as walking, running, driving, hammering, performing particular American Sign Language (ASL) signs, opening a door, etc. Our discussion of activity recognition metrics, however, extends to other behaviors and is not restricted to human activity. The evaluation of an activity recognition system requires that the output of the system be compared to ground truth labels representing the actual activities performed during the time period of interest. This comparison is complicated, however, since activity recognition is temporally continuous (i.e., both the label and the temporal boundaries of each activity must be determined) and since there are typically many different activities to be detected. We can contrast this situation with both isolated recognition, where the activity boundaries are predetermined, and with binary classification problems in which there are only two classes. The evaluation is complicated further by the requirements of activity recognition systems in different domains. A sign language recognition system may be judged by how well the system recovers understandable utterances. The activities in this case are relatively dense (continuous signing) with a large number of classes (the signs). The exact time that each sign starts and stops is not as important as interpreting the meaning of the signed phrase. On the other hand, a computer vision system that monitors swimming pools for drowning victims has very different requirements. While drownings are rare, the system should never miss a potential incident. On the other
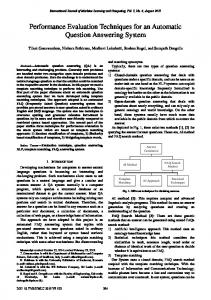
hand, some false alarms are acceptable since the lifeguard can quickly ascertain if someone is actually in danger. Figure 1 provides a simple illustration of the evaluation problem that we are addressing. The diagram shows the ground truth events in the top row, followed by the activities predicted by three different recognition systems in the subsequent rows. The difficulty of evaluating such systems is illustrated because all three have equivalent performance according to a widelyused metric (frame-based accuracy, discussed in detail in Section V). We can see from the visualization, however, that each system makes different kinds of errors that may be more or less significant depending on the particular application domain. Thus, we argue that it is important to consider the assumptions underlying potential evaluation methodologies and that relying on summary statistics computed over coarse error categories can sometimes mislead performance analysis. Many of the motivating and illustrative examples used in this paper are drawn from DARPA’s Advanced Soldier Sensor Information System and Technology (ASSIST) project. In this project, soldiers utilize body-worn sensors to augment their after-action recall and reporting capability. Sensors include accelerometers, microphones, high resolution still cameras, video cameras, GPS, altimeter, and a digital compass. With ASSIST, the soldier may return from a five hour patrol and ask the system to display all the images taken immediately before he raised his weapon. The soldier may use these images to help generate a report of the important events that happened during the patrol. Working with NIST, DARPA, and subject matter experts, we identified 14 activities of interest: walking, running, driving, sitting, crawling, lying, walking up stairs, walking down stairs, situation assessment, a weapon up state, kneeling, shaking hands, opening a door, and standing still. Obviously, activity recognition applications vary greatly, and system designers should be aware of the variety of tools available to evaluate these systems. In this paper we will review many of the common metrics currently in use and discuss a recently developed visualization method that has proven useful for our work with the ASSIST project. The remainder of the paper is organized as follows. Section II outlines fundamental issues such as sources of error and other factors that complicate the evaluation of activity recognition results. Next, in Section III, we discuss three
GT
W
W
D
R
W
A
W
W
D
W
W
D = 9 I = 6 C = 86 S = 5
W
D I C S
W
D = 2 I = 30 C = 8 S = 0
W
B
W
W
W
W
C
W
R
W
W
D
D
D
D
R R
R
W
= = = =
16 2 84 0
Fig. 1. Sample ground truth (GT) labels for a simple domain that includes walking (W), driving (D), running (R), and the null class (unlabeled). Hypothetical predicted labels are shown for three different recognition systems (A, B, and C). Each system has the same accuracy (66%), but the types of errors that each system produces varies dramatically. The total number of correct frames as well as deletion, insertion, and substitution errors (see Section II-B.2) is shown to the right of the output for each system.
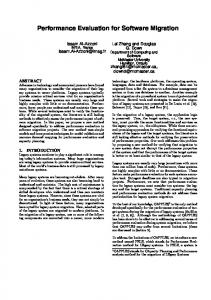
different levels of analysis that can be used as the basis for evaluation. Error types are discussed in Section IV with common summary statistics presented in Section V. Finally, we introduce a recently developed method for performance visualization in Section VI and discuss how it might be used to evaluate and compare activity recognition systems. II. I SSUES IN EVALUATING ACTIVITY RECOGNITION A fundamental issue for evaluating activity recognition concerns the level of analysis used to calculate performance (see Figure 2). Each occurrence of an activity represents one event, which is a contiguous block of time during which the activity label is constant. Evaluation could measure whether each event is detected, whether the event is detected at the correct time, and how closely the predicted event boundaries correspond to the true start and stop times. We call evaluation at this level event analysis. See the top row of Figure 2 for an illustration of events detected at the correct time but with poor boundary alignment. Alternatively, we can view the data as a series of equallength time intervals and consider the activity being performed during each interval. For example, we could divide an hour of data into 3,600 seconds and label each one-second block according to the dominant activity during that time. Evaluation would then depend on the correspondence between the ground truth label and predicted label for each second. We call evaluation at this level frame analysis. Note that the temporal duration of each frame is arbitrary. As discussed in Section II-A.3, however, inappropriately large values can artificially affect the inherent error of the evaluation. Finally, a hybrid approach divides the data into variable length segments. The segments are defined as maximal intervals within which both the predicted and true labels are
Walking Events
Running
Walking
W Frames
W
W
W
W
W
W
W
W
W
W
W
W
W
W
R W
W
R
W
R
R
R
R
R
R
R
R
R
R
R
R
Segments W
Ground Truth Predicted
Running
W
R
R
R
Ground Truth Predicted
Ground Truth Predicted
Fig. 2. An illustration of the three levels of analysis: events, frames, and segments.
constant. Thus the boundary of each segment coincides with a boundary of either a true or predicted label. Evaluation at this level is called segment analysis [1]. A. Intrinsic Sources of Error Deviation between the ground truth and predicted labels can arise for many reasons. Some of the differences correspond to important errors in the recognition system and should be represented in the evaluation metric. Others arise due to inherent evaluation difficulties or semantic inconsistency and may mask the abilities of a particular recognition system. In this section, we outline sources of both kinds of errors. 1) Errors in Ground Truth: A fundamental problem for all evaluation systems concerns obtaining accurate ground truth data. For activity recognition, this includes correctly labeling each event and specifying accurate event boundaries at the desired temporal resolution. Generating ground truth is a notoriously difficult task and is of paramount importance for accurate evaluation. Errors often arise due to clock synchronization issues, limited human reaction time, and imprecise activity definitions. For example, if a subject transitions from walking to running, boundary errors may arise because of reaction delays (the evaluator must perceive the transition, recognize it, and then mark the transition time) and because of the subjective nature of the transition (does running start when the subject first leans in to run, the first time both feet leave the ground, as soon as his velocity exceed a particular threshold, or at some other point?). Worse yet, different evaluators may choose different transition definitions. 2) Transition Effects: Just as human evaluators may have difficulty labeling the precise temporal boundaries of each activity, these transition effects also lead to automatic recognition difficulties. Agreement between the performance metric and recognition system is vital. Should a strict division point be located during the transition? Should the transition be ignored (i.e., it is recognized as neither the preceding nor following activity), or should it be explicitly recognized as a transition (i.e., each transition is treated like an extra activity to be recognized)? 3) Temporal Resolution: Errors due to mismatched temporal resolution between the ground truth and predictions can further exacerbate boundary errors. Simply put, the recognition system should report activity boundaries at the same temporal resolution as the ground truth, else boundary errors are inevitable. As an extreme example, consider a true event
occurring from 47.3 to 102.5 seconds from the beginning of the data sequence. If this is used to evaluate a recognition system with minute-long frames, the minimum boundary error is 30.2 seconds (12.7 seconds at the beginning and 17.5 seconds at the end of the true event). This lower-bound can be be easily reduced to 800ms by simply reporting predicted boundaries on a per second basis. 4) Temporal Quantization: In frame analysis, the atomic nature of each frame creates an additional complication. Regardless of the actual frame duration, an activity transition can occur within a single frame. In such cases, a single label must still be assigned to the frame. However, minor differences in the estimation of the boundary may change the overall label. In the extreme case when an inappropriately long duration is used, multiple activities might occur within a single frame. While decreasing the frame duration can reduce these errors, it cannot eliminate them entirely. 5) Parallel Activity: Our discussion of performance metrics for activity recognition is restricted to the case of temporally exclusive activities. That is, it is assumed that the subject is either walking or running or driving, etc., but never performing multiple activities at the same time. This means that the recognition system should report one activity for each time interval. However, in actuality the subject may perform multiple activities in parallel. For example, the ASSIST evaluation was intended to follow the temporal exclusivity assumption, but at times the soldiers would walk with their weapons up, and naturally everyone would sit while driving. In such cases the correct label is inherently ambiguous. Methods for resolving such ambiguity and accounting for it during evaluation are discussed in Section VII. B. Recognition Errors In addition to the intrinsic errors just described, there are many sources of errors based on the events predicted by the recognitions system. These errors are typically much more serious and thus their classification is important for comparing different methods. 1) Boundary Correspondence: Even when the predicted label matches ground truth, the precise start and stop times may not align (see top of Figure 2). For event analysis, care must be taken to appropriately match predicted events with ground truth, a non-trivial correspondence problem in general. Several approaches for handling boundary mismatches are discussed in Section III. 2) Label Correspondence: Serious errors can occur when the predicted activity differs from the true activity at a particular time (a substitution error), when an activity is predicted when none actually occurred (an insertion error), when an activity is detected multiple times (also an insertion error), and when nothing is predicted when an activity really did occur (a deletion error). See Figure 1 for examples of each of these errors. 3) Fragmentation: The recognition system may erroneously divide an activity into multiple short intervals, especially when an activity has a very long duration. For example,
a subject may walk for 15 minutes, but slight irregularities may cause a prediction of three walking segments each lasting roughly five minutes (see System B in Figure 1). Tripping, stumbling, stepping over an obstacle, pausing, making a quick turn, or a myriad other minor deviations may be the source of such false division. For evaluation purposes, one must decide whether such irregularities constitute ground truth errors that should not count against the recognition system or if they are noteworthy mistakes. In general, this decision is highly contextual. If the predictions are used to answer questions such as “How many times did the soldier raise his weapon?” then fragmentation may cause serious over-estimation. On the other hand, for the purposes of answering “How much time was spent running?” fragmentation due to brief interruptions is a minor issue. 4) Merging: Merging is the opposite of fragmentation and occurs when two separate but closely occurring instances of the same activity are predicted as a single occurrence. For example, a subject may shake one person’s hand and then shake another in quick succession. A merge error occurs when the recognition system identifies this as a single, longer instance of shaking hands. C. Domain Properties that Affect Evaluation In addition to the sources of error presented in the previous section, several other issues complicate activity recognition evaluation. These include the existence of a “null” class, the semantic interpretation of the activity, the relative sparseness of the event (prior likelihood), and the cost of incorrectly classifying the event. 1) Inclusion of a null class: The null class represents the time during which none of the predefined activities occur. For example, if the system should report walking, running, and crawling, then the null class will include standing and driving but also scratching your head, playing ping-pong, petting your dog, and literally everything else that a person can do other than walking, running, and crawling. In continuous recognition systems without a null class, insertion errors can occur when a long activity is falsely detected as several different, shorter activities. Similarly, a deletion error occurs when multiple different short activities are detected as a single long activity. Introduction of a null class complicates this by creating new kinds of insertion and deletion errors. Specifically, a known activity can be falsely detected during a period when an unknown (i.e., null) activity occurs. Equivalently, a known activity can be deleted by incorrectly predicting null during the relevant time period. Evaluation is further complicated because errors relative to the null class may be less serious than those relative to other classes. For instance, overextending the ending time of running when followed by null may be less critical than when running is followed by raising your weapon. In the latter case, the overextension of running would obscure the onset of an important event. This creates evaluation nuances that may mislead analysts if ignored.
2) Semantic Differences: Semantic differences between activities also affect evaluation. Activity classes can be divided into two categories according to whether they are “bounded” or “fluent.” Bounded activities are often gestural and tend to express a particular meaning or achieve a certain goal. For example, opening a door, signing a word in American Sign Language, and shooting a basketball are all examples of bounded activities. Erroneously detecting multiple occurrences of a bounded activity (i.e., a merge or fragmentation error) is quite serious since it would reflect the interpretation that you, for example, opened several doors, signed multiple words, or shot many basketballs. On the other hand, fluent activities typically have highly variable duration and are repetitive or periodic. For instance, standing, walking, running, and shaking hands are all fluent activities. Ideally, fluent activities should also be detected once and with accurate boundaries, however fragmentation is typically less serious. If a recognition system detects two instances of walking when only one longer instances occurs, it is still correct in that the subject was walking during both instances. This differs from a bounded activity in that the fragmentation does not imply an erroneous duplication of intent or action. 3) Activity Frequency: The frequency with which an event occurs can affect the interpretation of the evaluation. Consider a data sequence in which we are interested in detecting walking and standing. If standing occurs 90% of the time then many metrics may give misleading results. For instance, a very poor recognition system may simply recognize everything as standing, thereby achieving a high accuracy. Most would agree, however, that this recognizer would not generalize well and would have little practical value. 4) Misclassification Cost: In general, the cost associated with a labeling mistake may not be uniform across all activity pairs. For instance, it may be much more important for a system that recognizes “raising a weapon” and standing to correctly detect “raising a weapon,” even if standing accounts for the majority of the time. Similarly, in a system which recognizes kneeling, sitting, and running, mistaking an instance of kneeling for sitting may be much less severe than mistaking running for sitting. III. L EVEL OF A NALYSIS Each level of analysis represents the activity labels in a way that highlights different evaluation issues. In this section, we detail these differences and discuss how each representation facilitates detecting certain kinds of errors. See Figure 2 for a diagrammatic representation of the event, frame, and segmentbased analysis. A. Event Analysis Event analysis takes the individual activity occurrence as the basic unit for comparison. Events are temporally distinct, contiguous blocks of time with a specific start time, end time, and label. Event analysis methods can be divided into two categories, those that consider the actual occurrence time
Wa
(a) W1 1
W2 2
3
4
Ra W3
R1 5
6
7
8
9
Wb
10
11
12
Wa Wa Wa Wa Wa Wa Wa Wa
13
14
15
16
Ra Ra Ra Ra
(b) W1 W1 1
(c) W1
2
R1 R1 R1 W 3 W 3 W 3 R2 R2 R2 R2
W2 3
4
5
6
Wa Wa Wa
Wa
W2
R1
7
8
Ground Truth Predicted
R2
9
10
11
Wa Wa W3 W3
R2
17
18
12
13
14
Ra
Ra
Wb
R2
19
W b W b Ground Truth Predicted
Ground Truth Predicted
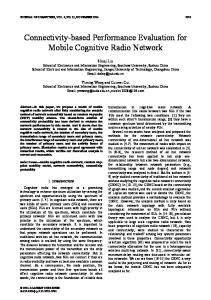
Fig. 3. Ground truth and predicted activity results demonstrating different types of errors for (a) event, (b) frame, and (c) segment analysis. The sample domain includes two known activities, walking (W) and running (R), as well as the null class, which is left unlabeled.
and those that only consider their order, but all carry the distinguishing characteristic of treating each event as an atomic structure. In the following sections, we discuss three different approaches for scoring events. The first only considers the order of the events when detecting errors, while the other two adopt different criteria for temporal matching. 1) Levenshtein distance: The Levenshtein distance (also known as the edit distance) computes the minimum number of modifications (insertions, deletions, and substitutions) needed to transform one string into another. This method can be used for activity recognition evaluation by treating each activity as a symbol, ignoring null labels, and representing the ground truth and predicted label sequences as two strings. Errors are detected by aligning the strings via dynamic programming, which will efficiently find the set of symbol correspondences that minimizes the number of errors. Use of this method arose in speech recognition where researchers were interested in measuring sentence-level accuracy rather than ensuring that each word or phoneme was detected at exactly the right time. Also, note that this method assumes that all of the activities are bounded. When fluent activities are involved, the detected errors may be less meaningful and thus mislead an analyst. As an example of applying the Levenshtein distance to an evaluation problem, consider Figure 3. This diagram shows hypothetical ground truth and predicted events for a system that can detect walking, running, or null. Since the edit distance does not consider the temporal location of each event, it will match W1 ↔ WA , R1 ↔ RA , and W3 ↔ WB . W2 and R2 are then marked as insertion errors. 2) Matching via temporal correspondence: When it is important to consider the actual time during which an event was detected, a temporal correspondence method can be used. This method seeks to match each ground truth event with a predicted event based on temporal overlap. Many different match criteria are possible (see Figure 4), including: • midpoint overlap A predicted event must span the midpoint of its matching ground truth event. This approach is often used to score word spotting systems in the speech recognition domain. • majority overlap A predicted event is paired with a ground truth event if the overlap accounts for a majority
Fig. 4. Illustration of three methods for temporal correspondence: midpoint, majority, and maximum overlap. The vertical, dashed line represents the midpoint of the ground truth label.
In addition to avoiding event correspondence issues, one of the major benefits of a segment-based representation is that it simplifies incorporating contextual information for detecting different kinds of errors. Thus, we include underfill, overfill, merge, fragmentation, substitution-fragmentation, and substitution-merge as possible segment analysis labels. Note that while these error types exist at all levels of analysis, they are most easily detected using segments. IV. C LASSIFICATION E RROR T YPES
of the time in both events. maximum overlap Predicted and ground truth events are paired based on maximizing overlap. Although computing the optimal correspondence is NP-hard, greedy approaches work well in practice. 3) Majority vote compared to ground truth: When the results of an activity recognition system are used in an interactive tool, the severity of false positives may be greatly diminished. Because the system is interactive, the human user can easily detect and ignore false positives. In these cases, an asymmetric evaluation method may provide a better indication of real world performance. One such method evaluates predicted activities by allowing them to vote on the label of each ground truth event. Whichever predicted activity accounts for the majority of the time of each true event is taken as the overall label. •
B. Frame Analysis Frame-based methods take fixed-duration intervals as the basic, atomic unit. The specific duration of the frame can be determined based on the time-scale of the domain. For example, one second intervals may be appropriate for finegrained human activities, while hour long frames may be more reasonable for predicting the highway traffic patterns, and annual frames are sufficient for many population statistics. Since the duration and start time of each frame is independent of both the ground truth and predicted labels, they are always aligned, making it is easy to compare the labels. With frame-based analysis, all discrepancies between activity classes are substitution errors, predicting a known activity where the ground truth is null is an insertion, and erroneously predicting null is a deletion error. For example, Figure 3b shows hypothetical ground truth and predicted frame labels for a simple domain. The predicted labels include four insertion errors (frames 1, 2, 11, and 12), three substitution errors (frames 6 – 8), and five deletion errors (frames 3, 5, 16, 18, and 19). C. Segment Analysis A hybrid approach combining aspects of frame and eventlevel analysis uses segments as the basic unit for comparison. A segment is an interval of maximal duration in which both the ground truth and the predicted activities are constant. Thus, each segment may have a different duration, but there are no aliasing problems or ambiguities associated with event correspondences and boundary alignment (see Figure 3c).
Once a level of analysis has been selected, the ground truth and predicted activity labels can be compared in order to determine which errors were made. Before detailing common evaluation metrics, we will introduce the standard classification error types that are used to calculate the metrics and build the performance visualizations. In isolated, binary classification problems, the two classes are often called the positive and negative class (as when a diagnostic test reports positive or negative for the presence of the disease or condition it detects) leading to the familiar four possible results: true positives (TP), false positives (FP), true negatives (TN), and false negatives (FN). The definition of these four types of errors can be generalized to the multi-class situation by treating the null class as negative and all other classes as unique positive classes. Thus, a correct identification of any known class is a true positive, correctly detecting null is a true negative, failing to detect a known class is a false negative, and substituting a known class for null is a false positive. In continuous recognition domains, researchers typically tally a different set of classification results that take into account the fact that there may not be a one-to-one correspondence of ground truth to predicted events (see Figure 5): 1) Correct (C) - sometimes called “Hits” (H); represents correct classification 2) Substitutions (S) - represent correct temporal detection but incorrect activity identification, 3) Insertions (I) - detection of an activity when none actually occurred; this can also occur when a long activity is partially detected multiple times (see Figure 3a, specifically W1 and then R1 and R3 represent both kinds of insertion errors). 4) Deletions (D) - failure to detect an activity (e.g., W B in Figure 3a). 5) Total Number of True Events (N) - a useful variable for calculating statistics, though not strictly a classification result: N = (C + D + S). Finally, we can also tally the additional error types mentioned in Section III-C to provide a more nuanced summary of performance: 1) Underfill (U) - when an activity is correctly identified, underfill errors account for the time at the beginning and end of the activity that is not detected, 2) Overfill (O) - when an activity is correctly detected, overfill errors account for the time before and after
Fig. 5. An illustration of the different error types. The ground truth labels are highlighted at the top.
occurrences will the recognizer correctly identify?” and “What percentage of the detected occurrences will be correct?”. 3) Specificity: Specificity can be thought of as the recognizer’s sensitivity to the negative class. It measures the proportion of correctly identified negative occurrences to all N true negative occurrences. Specificity is defined as T NT+F P 4) Negative Predictive Value (NPV): The negative predictive value can be thought of as “negative precision” and measures the likelihood that a negative identification is correct relative to all negative identifications. The negative predictive N value is defined as N P V = T NT+F N. 5) F-Measure: The F-Measure combines the precision and recall rates into a single measure of performance. It is defined as the harmonic mean of precision, P, and recall, R: (β 2 +1)P R
3) 4)
5)
6)
the activity that is incorrectly identified as part of the activity, Fragmentation (F) - errors due to detecting a long activity as multiple events separated by null, Substitution-fragmentation (S F ) - whereas a normal fragmentation error falsely divides an event with null, this error divides an event by incorrectly inserting known activities, Merge (M) - errors due to incorrectly detecting multiple, closely occurring events that are separated by null as a single, longer event, Substitution-merge (S M ) - like a standard merge error, a substitution-merge involved detecting multiple occurrences of an activity as a single occurrence, but here the separating activity is a known class. V. E VALUATION M ETRICS
Once the different error types have been accumulated, a variety of summary statistics can be computed. Each statistic highlights the recognition system’s performance relative to different criteria. Many of the most commonly used metrics are presented below [2], [3]. 1) Sensitivity / Recall: Sensitivity, which is also referred to as recall, corresponds to the correct detection rate relative to ground truth. It is the percentage of correctly detected activities out of all true instances of a particular class, averaged over P all activities. Sensitivity is defined as T PT+F N . Likewise, (1 − FN sensitivity) = T P +F N is the probability of the recognizer failing to detect an instance of an activity. 2) Precision / Positive Predictive Value: Precision is also known as the Positive Prediction Value (PPV) and measures the likelihood that a detected instance of an activity correP sponds to a real occurrence. Precision is defined as T PT+F P. FP Likewise, (1 − precision) = T P +F P is the probability of the recognizer incorrectly identifying a detected activity. Precision and recall are highly related. Both are based on the number of true positives, but sensitivity normalizes by the true number of occurrences (based on the ground truth), while recall normalizes by the total number of occurrences detected (based on the predicted label). Thus, they estimate different likelihoods: “What percentage of the total number of
F = β2 P +R , where precision and recall are evenly weighted when β = 1 [4]. 6) Likelihood Ratio: The Likelihood Ratio is the ratio of the likelihood that a particular activity would be predicted when it matches the ground truth to the likelihood that it would be predicted erroneously. This ratio can be computed for both true positive and true negative results: LR+ =
sensitivity 1−specif icity
=
T P (T N +F P ) F P (T P +F N )
LR− =
1−sensitivity specif icity
=
F N (T N +F P ) T N (T P +F N )
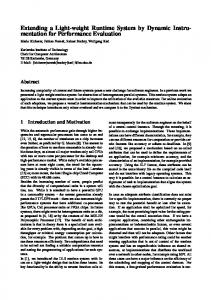
7) Accuracy: Accuracy is defined as C−I−D−S and meaN sures the percentage of correct identifications after discounting insertion, deletion, and substitution errors. Although accuracy has a maximum value of 100%, for continuous recognition systems, there is no general lower bound due to the penalty for insertion errors. Thus, a poor recognition system with a very low detection threshold could insert more false detections than there are true events, thereby leading to a negative overall accuracy. VI. E RROR DIVISION DIAGRAMS Recently, a method was developed for visually representing performance that explicitly accounts for overfill and underfill [5]. A slightly modified version of it appears here. The diagram represents the total duration of the data as a rectangle and subdivides it into sections corresponding to the different classification results. This method provides a relatively complete picture of the overall performance and error distribution for the system. Multiple recognition methods can be compared at a glance by aligning the corresponding diagrams and visually comparing the relative area of the true positive division and relevant error divisions. Figure 6 demonstrates error division diagrams (eight recognizers are simulated here for the purposes of illustration). Error division diagrams are labeled with the percentage of null activity in the data set, which allows the reader to determine the sparsity of the activities of interest. A column represents 100% of the time in the data. The two top divisions represent the percentage of true positive time and true negative time, respectively. The sum of these two divisions corresponds to
the month of data to just the specific, rare events he wishes to examine, such as heart palpatations. Even though the system may not accurately determine the temporal boundaries of the palpatations, the physician can manually scan past the “fuzzy” transition boundaries to analyze the real events. In other domains, the boundaries between events are important. For example, the ASSIST system can record hours of video for each soldier during a long patrol. Imagine a recognition system designed to help a commanding officer search the database for footage of “soldiers running” to splice into an intelligence debriefing video. If the footage starts with something other than running (an overfill) the viewer may be misled as to the topic. However, some fragmentation may be tolerable (e.g., the system might not return the full segment because of misclassifying some of the footage in the middle as null activity). Similarly, merges may be inconsequential for this application example (e.g., the system ignoring some null activity in the footage caused by a car passing in the foreground). Thus, in the figure above the designer of the video editing system may choose recognizers C and D over recognizer B and would certainly would prefer all three to recognizer A. In addition to providing a means to evaluate and compare recognition systems, error division diagrams can also provide information useful for tuning a recognizer. For example, a relatively large number of overfills and merges may mean that a threshold is set too low, which leads to erroneous inclusion of nearby null frames into a real event. A system designer might also suspect that the boundaries on his ground truth labeling are too permissive. On the other hand, a relatively large number of underfills and fragmentations may mean that a threshold is too high or that a ground truth labeling is not permissive enough. Of course, the system designer must be careful that changing thresholds or labeling policies does not exacerbate the more serious substitution, deletion, and insertion errors. If a system designer is interesting in building a system based 9.3 9.3 9.3 9.3 9.2 9.2 9.2 9.2 on events, the visualization method still provides a valuable 9.3 9.3 9.3 9.3 9.2 9.2 9.2 9.2 tool. Each graph shows the relative number of substitutions, 4.6 4.6 4.6 4.6 3.5 3.5 3.5 4.5 4.5 4.5 4.5 4.3 4.6 4.6 deletions, and insertions, which can be a critical factor in 4.6 4.6 4.6 4.6 20.8 4.1 6.9 4.5 4.5 4.5 4.5 comparing event based recognizers. For example, recognizers 4.7 E-H in Figure 6 all have the same percentage of serious 9.1 9.1 9.1 9.1 34.1 22.1 errors. Suppose we want to make a recognizer for just the 23.1 37.5 9.1 10.8 10.8 most critical four activities of the fourteen we defined for the 9.1 10.3 DARPA ASSIST program (i.e., running, crawling, lying down, 38.7 4.6 10.4 9.1 23.5 4.1 and weapon up). Soldiers we interviewed stated that if any 4.8 4.8 4.8 33.1 of these four critical activities happened, it generally meant 4.8 4.8 4.8 30.3 27.3 5.8 5.8 5.8 5.8 that the soldier was in trouble implying that the other soldiers 5.2 6.8 6.8 6.8 6.8 5.2 5.2 should be alerted. We place the remaining ten activities into the 6.7 6.7 6.7 6.7 5.2 5.2 5.2 null class (i.e., the recognizer’s output of walk, sit, stand,etc. is A B C D E F G H mapped to null) and then trigger an alert whenever one of the Fig. 6. Error division diagrams for eight recognizers showing, from top four critical activities is detected. In such a case, recognizer to bottom, the percentage of frames that were true positives, true negatives, E is superior to recognizer F. Recognizer F’s high deletion overfills, underfills, fragmentations, merges, insertions, deletions, substitution- rate indicates that it would not trigger much more often than fragmentations, substitution-merges, and substitutions. The dark horizontal bar in each column indicates the division between severe errors and those that may recognizer E, even if recognizer E would sometimes trigger be tolerable. because it thought the soldier was lying down even though TP
TP
TN
TN
O
O
TP
TN
TP
TP
TP
TP
TP
TN
TN
TN
TN
TN
O
O
O
O
O
O
U
U
U
U
U
U
U
F
F
F
F
F
F
F
M
M
M
M
I
I
I
I
SF
SF
M
M
I
U
D
SF
D
M
F
SM
SM
M I
I
I
S
D
D
D
SF
SF
SF
SF
SM
SM
SM
SM
SM
SM
S
S
S
S
S
S
SF
S
NU LL activity = 50%
the standard measure for the percentage of correctly labeled frames. All divisions below true negatives represent errors which increase in severity farther down the column. The next two segments, overfill and underfill, represent difficulties in determining the boundaries of events. For systems dedicated to event-based recognition, these errors may be deemed inconsequential. Fragmentation and merge, on the other hand, may be considered more serious errors. These segments in the visualization provide a sense of the difficulty the recognizer has in detecting a whole event, uninterrupted by the null class. On the other hand, for applications that focus on spotting relatively sparse activities, these errors may also be considered acceptable. Errors represented by divisions below merge, including insertion, deletion, and all substitution errors, are considered serious errors since they would be classified as errors in both frame-based and event-based systems. The visualization method allows the evaluator to compare the attributes of activity recognizers in the context of his application. For example, examining Figure 6 shows that recognizers A and B have about the same total number of errors from a frame-based perspective. However, recognizer B is superior if the intent is to make an event-based recognizer. Recognizer A has most of its errors concentrated under the serious error line (substitutions, insertions, and deletions), recognizer B, however, suffers most from overfill and underfill errors. Overfills and underfills of minor duration can be ignored. For example, most sign language recognition researchers would not bother to report overfill and underfill errors, focusing instead on accuracy rates at the event level. For chronic care medical monitoring systems, where the goal is to capture relatively rare events for later study, overfills and underfills can not be ignored, but they may be tolerable. For example, a patient may wear a heart monitor for a month. His physician could then use a recognition system to reduce
the soldier was crawling. Everything else being equal, one can imagine that a recognizer with a comparably high insertion rate could also be inferior to recognizer E. False alarms would be much more annoying to a soldier’s friends than being alerted to the soldier lying down when he was actually crawling. Error diagrams can also be used to help refine a recognition system. For example, in Figure 6 G and H, the dominance of the fragmentation and merge variants over pure substitutions may be an indication that some tuning may improve results. For example, in the ASSIST system previously described, “crawling” often involves “lying down” first. Perhaps the ground truth labeling ignored this fact, or perhaps the system is inserting crawling into the middle of a segment of lying down. The system might even be thrashing between the two classes because of the difficulty in distinguishing between them. Since the activities are similar and both result in the same alert action, the designer may want to make the classes equivalent or, at least, revisit his ground truth labeling. On the other hand, if the designer discovers that fundamentally unrelated classes are being substituted (for example, “running” often appears within segments of “lying down”) he may inspect his models and labeling more carefully for errors. A. Discussion All of the above metrics can be used to summarize multiclass recognition performance. For metrics such as precision, recall, specificity, NPV, F-Measures, and likelihood ratio, each class can be evaluated as a binary class problem considering all other classes to be the “other” class. The results can be averaged across classes, or weighted by the amount of time each class represents in the data set. The first emphasizes the recognition of the activities, and the second emphasizes describing the time in the data set as accurately as possible. The accuracy expands on the idea of two classes and includes substitutions, insertions, and deletions. Error division diagrams provide yet more information for the designer’s consideration. The visualization exposes the types of errors inherent to the accuracy metric which allows the system designer to choose a system based on the needs of the application. The designer has some information as to if false positives and false negatives are primarily due to confusion with the null class or with other classes. In addition, the error division diagrams simultaneously provide a sense of event, frame, and segment-based errors and provide an intuition as to how sparse activities are in the data space. Through the tracking of fragmentations and merges, error division diagrams also provide some intuition as to the temporal coherence of classes (if the recognizer is thrashing between two similar classes). Of course, the error division diagrams are not as compact as one or two number metrics, such as precision, recall, and accuracy rates. VII. F UTURE W ORK We are currently investigating several ways to improve the evaluation methods described here. For example, when scoring the different error types, we currently give all errors the same weight regardless of which activities are involved. Instead, the
scores could incorporate the prior likelihood of the activity and the cost of making a particular mistake. For instance, if confusing running for walking is serious, it could be given a cost of 2.0, while confusing standing for walking only carries a weight of 0.4. Overfill and underfill account for the often inconsequential mistake of correctly identifying an activity but failing to precisely detect the temporal boundaries. An equivalent issue exists for substitution errors, but this case is not handled by the current method. That is, if running is mistaken as walking, any boundary inconsistencies also count as insertion errors. These errors lead to asymmetry in the overall error calculation and may underestimate the performance of the system, especially if the substitution has low cost. To remedy this, we are exploring the use of “negative” overfill and underfill. Although recognizing overfill and underfill as relatively minor errors is important, the current method does not consider the amount of over or underfill. Our goal is to only ignore small boundary errors, whereas the current approach allows arbitrarily large over or underfill segments. VIII. C ONCLUSION We have described some of the factors that complicate the evaluation of a continuous activity recognition system, and we discussed metrics that are commonly used to describe system performance. In addition, we have examined the uses of a recent visualization tool that allows system designers to diagnose the performance of a recognizer and compare performance across recognizers with respect to the needs of event-based or frame-based applications. Continuous activity recognition applications span a wide range of domains, and the recognizers are currently difficult to characterize. We must strive to define tools that will allow the community to compare and communicate results as increasingly more researchers from diverse backgrounds join the field. R EFERENCES [1] J. Ward, P. Lukowicz, and G. Tr¨oster, “Evaluating performance in continuous context recognition using event-driven error characterisation,” in Proceedings of LoCA 2006, May 2006, pp. 239–255. [2] M. U. of South Carolina, “Diagnostic tests glossary,” Web Article, June 2006. [Online]. Available: http://www.musc.edu/dc/ice [3] H. M¨uller, W. M¨uller, S. Marchand-Maillet, and T. Pun, “Performance evaluation in content-based image retrieval: Overview and proposals,” University of Geneve, Switzerland, Tech. Rep., 1999. [4] D. Jurafsky and J. H. Martin, Speech and Language Processing: An Introduction to Natural Language Processing, Computational Linguistics, and Speech Recognition. Upper Saddle River, NJ, USA: Prentice Hall PTR, 2000. [5] J. Ward, P. Lukowicz, G. Tr¨oster, and T. Starner, “Activity recognition of assembly tasks using body-worn microphones and accelerometers,” Pattern Analysis and Machine Intelligence (in press), 2006.