--
--
Parallel Program Performance Metrics: A Comparison and Validation† Jeffrey K. Hollingsworth
Barton P. Miller
[email protected]
[email protected]
Computer Sciences Department University of Wisconsin-Madison 1210 W. Dayton Street Madison, Wisconsin 53706 Abstract There are many metrics designed to assist in the performance debugging of large-scale parallel applications. We describe a new technique, called True Zeroing, that permits direct quantitative comparison of the guidance supplied by these metrics on real applications. We apply this technique to three programs that include both numeric and symbolic applications. We compare three existing metrics: Gprof, Critical Path, and Quartz/NPT, and several new variations. Critical Path provided the best overall guidance, but it was not infallible. We also include a set of recommendations to tool builders based on the experience gained during our case study. 1. Introduction Performance metrics are a tool to help programmers reduce the running time of their applications. Profiling metrics are performance metrics that can be quantified for individual program components (such as procedures). These profiling metrics help direct the programmer to the place in the program that is causing the performance problem. While single value metrics, such as speedup, provide feedback about how the application program is performing, they do not provide direction in how to improve it. Profiling metrics (in sorted lists) also have the nice property that they scale well to massively parallel systems. These metrics are a natural complement to display and visualization tools. Many metrics‡ have been developed to help in the performance debugging of parallel programs[1, 9, 15, 17, 18]. Typically, new metrics either are compared to existing sequential tools or used in a case study to provide testimonials to their usefulness. Unfortunately, with testimonial case studies it is impossible to isolate the quality of the metric from the quality of the programmer using the metric. Direct comparison between hhhhhhhhhhhhhhhhhh
† To appear Supercomputing’92 Minneapolis. ‡ For the rest of this paper, we use the term metrics to mean profiling metrics, not all metrics. This work was supported in part by National Science Foundation grants CCR-8815928 and CCR-9100968, Office of Naval Research grant N00014-89-J-1222, and a grant from Sequent Computer Systems Inc.
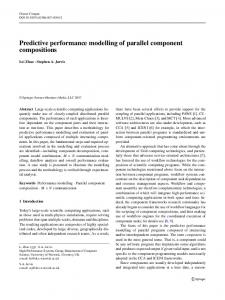
metrics is required to assess their quality. However, since metrics are incorporated into different (and often incompatible) performance tools, direct comparison between metrics has been difficult. We introduce a new technique, called True Zeroing, that permits direct quantitative comparison of the usefulness of the guidance supplied by different metrics. True Zeroing computes the actual improvement in an application if a single procedure is removed. This technique makes it possible to validate the quality of performance metrics. We use this technique to directly compare six metrics: Gprof[10], IPS-2 Profiling, Critical Path[18], Quartz NPT[1], Logical Zeroing[15], and a new metric called slack. We computed the value of the these six metrics for three programs representing both numeric and symbolic applications. Based on this study, Critical Path generally provided the best guidance, but each metric had strengths in specific cases. Finally, we provide a set of recommendations to application programmers and tool builders based on the results of our study. 2. Overview of Metrics This section describes the performance metrics that we used in this study. We describe these metrics in terms of a graph of the application’s execution history, called a Program Activity Graph (or PAG). Variations of this data structure are commonly used in parallel program correctness debugging[2, 6, 8, 14, 16] and performance debugging[7, 18]. Nodes in the graph represent significant events in the program’s execution (e.g. lock and unlock operations, procedure calls and returns). Arcs represent the ordering of events within a process or the synchronization dependencies between processes. Each arc is labeled with the amount of process and elapsed time between events. Figure 1 shows a simple PAG for a parallel program with three processes. The solid arcs represent useful CPU time intervals. The dashed lines indicate non-useful CPU time from activities such as spinning on a lock. The performance metrics used in our study can be described in terms of this graph. The implementations of some of the metrics (such as Critical Path and Slack) actually build the PAG, while others (such as IPS-2 Profiling
--
--
-2and NPT) only implicitly operate on this graph. For many real systems, it is not possible to build this graph, but it provides a unified characterization of a parallel program’s execution that permits a comparison of the performance metrics.
For a parallel application, the results for individual processes are aggregated, while ignoring inter-process arcs. The profiling environment on the Connection Machine[17] is an example of this metric. This metric is typically implemented by periodic sampling of the program counter. Gprof also provides a call graph profile, but we only consider the time directly consumed by a procedure. The additional data supplied by the call graph is useful, but we are interested in metrics that provide a single number for each procedure.
2.1. UNIX Profiling and IPS-2 Profiling The simplest of the metrics is an extension of the standard UNIX profiling tool, "Gprof", to parallel programs. For each process, this metric can be computed by traversing the PAG for that process. For each arc (including spin waiting time), the CPU time for that arc is added to the cumulative time for the currently active procedure.
One obvious problem with the UNIX Profiling metric on shared memory multi-processors is that it does not distinguish busy waiting time from productive work.
initial node
[0, 0]
[0, 0] call(A)
call(C)
[36, 36]
[0, 0] call(C)
[30, 30]
[24, 24]
preBarrier preBarrier call(B)
[36,36]
[42, 42]
[48, 48]
barrier barrierRelease
barrierRelease
[2, 2] [7, 7]
[5, 5]
exit
wait
[0, 2] call(B)
call(A)
[5, 6]
[6, 6] preLock & lock
[0, 1]
preLock
[1, 1]
unlock
[0, 1] call(C)
Legend Useful Time Spinning Time [CPU Time, Elapsed Time]
lock
[0, 1] call(D)
[1, 3] [4, 6]
preLock
[3, 3] unlock
lock
[1, 1] exit
[1, 1] exit
[0, 0] final node
Figure 1. A sample Program Activity Graph. Nodes represent interesting events in the application (e.g. procedure calls and message passing). The ordered pair indicates the CPU and elapsed times between events.
--
--
-3IPS-2 Profiling is a simple extension to UNIX Profiling that only counts useful CPU time. Like UNIX Profiling, it ignores inter-process arcs in the PAG. IPS-2 Profiling also differs from UNIX Profiling because it is computed from a trace of the program’s execution instead of by sampling.
of its inbound arcs. Once the path is found, a second (backwards) pass is made though the graph. This pass traverses the Critical Path and accumulates the time spent by each procedure on the path. The details of the implementation of this algorithm are described in [15]. 2.3. Quartz NPT Profiling
2.2. Critical Path Profiling
Quartz’s NPT[1] metric is computed by sliding a horizontal ruler down the PAG. At each node, the ruler is stopped and the elapsed time in each procedure since the last node is computed. Figure 2 shows a sample computation of this metric. For each process doing useful work, the time value is divided by the number of processes doing useful work during this interval of time (i.e. effective parallelism for that time interval), and then added to the cumulative total for the currently active procedure. No time is added to procedures that are not doing useful work, and inter-process arcs are ignored in this metric. The original implementation of NPT was an approximation based on periodic sampling; the version used in our study uses trace data.
The Critical Path of a parallel program is the longest CPU time weighted path through the PAG. Nonproductive CPU time, such as spinning on a lock, is assigned a weight of zero. The Critical Path Profile is a profile of the procedures along the Critical Path. The time spent in these procedures is the reason that the program ran as long as it did. Unless one of these procedures is improved, the application will not run any faster. Since the PAG is a directed acyclic graph and none of the arcs are negative, a variation on the distributed shortest path algorithm described by Chandy and Misra in [4] is used for this calculation. This algorithm[18] passes messages along the arcs of the graph. Each message contains the value of the longest path to the current node. At split nodes (nodes with one inbound arc and two outbound arcs), the message is duplicated and sent on each of the outbound arcs. At merge nodes (nodes with two inbound arcs and one outbound one), only the longest path is propagated. The first phase of the algorithm terminates when the last node in the graph has received messages on each
1 0
2
call(A)
call(C)
A = 24 ÷ 3 [24, 24] C = 24 ÷ 3 + 24 ÷ 3
[30, 30]
24
preBarrier
30 36
NPT Calculation
3
call(C) [36, 36]
Data for NPT should be collected from an application that is run on a dedicated machine. Because NPT is based on elapsed time, it is not possible to distinguish time spent doing useful work from time when the application is not running. However, an advantage of using elapsed time is that NPT implicitly includes kernel time spent by processes waiting for operating system services
A= 6 ÷ 2 C= 6 ÷ 2 A= 6 ÷ 1
preBarrier call(B)
B = 36 ÷ 1 [36,36] 72
[42, 42]
Critical Path procedure A B
value 36 36
NPT Metric procedure B C A
value 36 19 17
[48, 48]
barrier barrierRelease barrierRelease
Figure 2. Comparison of Critical Path and NPT Metrics. Calculation of Critical Path and NPT Metrics for the top half of the PAG shown in Figure 1. Critical Path suggests that either procedure A or B should be fixed first. NPT suggests that procedure B is the most important.
--
--
-4like paging and I/O. In contrast, the Critical Path metric uses only CPU time, which means that it is possible to get reasonable results even on a loaded machine. NPT also differs from Critical Path in that NPT does not use the synchronization dependencies in the application program. In Critical Path, the time spent in a critical section before another process starts to wait for the critical section is considered to be as important as the time spent in the critical section with another process waiting. For example, consider the PAG fragment in Figure 2 that shows part of the execution of a three process parallel application. Three procedures appear in this PAG fragment. The elapsed time for this fragment is 72 units. The tables in Figure 2 show the Critical Path and NPT metrics computed for this graph. Consider what would happen if we were able to fix A, B or C and the CPU time for these became zero. If A or B is fixed, the waiting time (in processes 2 and 3) is eliminated and the total elapsed time becomes 36. However if procedure C is fixed, the elapsed time of the program remains unchanged. Critical Path indicates that A and B are equally good to improve. NPT correctly identifies B, but assigns too low of a weight to A. The purpose of our case study is to determine the importance of differences like these in real applications. 2.4. Slack Slack is a new metric based on Critical Path that is helpful in assessing the benefit associated with fixing a procedure on Critical Path. Each procedure on the Critical Path has a slack value that indicates how much the procedure can be improved before the Critical Path will call(B)
be altered. Slack is computed using the algorithm described in [12]. The motivation for Slack is that improving a procedure on the Critical Path might not decrease the elapsed time of the program because there might be a second longest path that is slightly shorter than the Critical Path. The Slack metric considers these secondary paths and their relationship to the Critical Path. Figure 3 illustrates a Critical Path and Slack computed for the second half of the graph in Figure 1. This example shows that although procedure B is the largest component of the Critical Path, improving it will not help as much as fixing procedure D. If procedure D is fixed, the length of the program’s execution is reduced from 10 to 7. But, fixing B will only reduce the elapsed time by 1. In a balanced application (i.e. one in which the processes start and end at about the same time, and have about the same amount of useful CPU time), there will be no slack. This is because the Slack metric only considers the relationship between the lengths of the Critical Path and secondary paths through the PAG, and does not consider which procedures are along these paths. For example, if a procedure is on both the Critical Path and a secondary path, improving it will reduce the length of both paths. Because slack ignores this synergistic effect, the value assigned to the procedure will be too low. 2.5. Logical Zeroing The Logical Zeroing[15] metric attempts to provide an estimate of how much the execution of an application will improve when a selected procedure is improved. This metric is computed by setting the value of the PAG
call(A)
[5, 6]
[6, 6] preLock & lock
[0, 1]
preLock
[1, 1]
unlock
[0, 1] call(C)
Critical Path Procedure B D
lock
[0, 1] call(D)
Slack Metric
[1, 3] [4, 6]
preLock
[3, 3] lock
Value 6 4
unlock
Procedure D
Value 3
B
1
Figure 3. Comparison of Critical Path and Slack Metrics for a sample sub-program.
--
--
-5arcs for the selected procedure to zero, and then recomputing the length of the new Critical Path. The difference between the length of the new Critical Path and the original Critical Path is an estimate of the improvement possible by fixing the selected procedure. This is only an estimate because improving the procedure might cause a substantial re-ordering of the events in the application. Logical Zeroing is most helpful in a balanced application. Even if the second longest path is almost the same length as the Critical Path, it will provide useful guidance. This is because when a procedure is zeroed, both its component on the Critical Path and its component off the Critical Path (i.e. secondary paths) are altered. 3. Techniques for Comparison The ultimate test of a performance metric is how useful it is in assisting programmers in improving their programs. To provide a test-bed for comparing metrics, we added Slack and NPT to the IPS-2 system[15] (IPS-2 already provided Critical Path Profiling, Logical Zeroing, and IPS-2 Profiling). IPS-2 provided a uniform environment that permitted direct comparison of each metric for a single execution of a parallel application. Once we can compute several metrics for a single program, how do we quantitatively compare the guidance each metric is providing? A simple approach would be to give the same parallel application to two programmers and let each one try to improve the application’s performance using a different metric. Afterwards, we could compare the running times of the two improved programs. One problem with this approach is that it is difficult to separate the skill of the programmer from the quality of the information provided by the metric. A second problem occurs when different metrics provide different information about the same program. Consider an application in which procedure A has a large effect on the performance of the application but contains code that is extremely difficult to improve, and procedure B has a smaller effect but contains code that can be easily improved. If a metric incorrectly suggested that B had the larger performance effect, a programmer might actually profit more from this information than if the metric correctly picked procedure A †. This could lead us to conclude that the incorrect metric was providing better guidance than the correct metric. A more systematic approach is required to compare metrics.
a metric tells us that a procedure consumes 20% of a program’s execution, we want to see how much of this 20% improvement is obtained if we remove that procedure. Simply altering an existing PAG (such as done by Logical Zeroing) is not enough because synchronization patterns might change as a result of removing a procedure. We developed a technique called True Zeroing to see how the elapsed time of a program changes when a single procedure is removed. True Zeroing is computed by editing the source code for the application and removing the procedure to be tested. The application is then reexecuted to see the actual reduction in execution time. The difficult part is how to remove a single procedure from an application and still have a working program that does not alter the performance of other procedures. We must also be alert for performance changes caused by interactions with architectural features such as caching and virtual memory. IPS-2 allows us to easily monitor the levels of cache and virtual memory activity [11], so we can check that the modified program does not significantly change these behaviors. Several approaches were used to compute the True Zeroing value for each procedure. (1)
The easiest approach is to simply remove the procedure, which works well for printing routines and other parts of the application where the results of one procedure are not used by other procedures.
(2)
In many cases, a procedure will update the global state of the application. To handle this case, we first execute the application (on a given input) and record state changes made by that procedure. Next, we replace the procedure with assignment statements that make the appropriate changes to the global state. Last, we re-execute the application to determine the execution time without the modified procedure. This technique works well for procedures whose computation time is long compared to procedure call overhead. Fortunately, most procedures in our study (especially in the numeric application) exhibited this property.
(3)
If a procedure makes large changes to its global state (e.g., when modifying a large matrix), we can use a technique similar to the previous one. After recording the changes that a procedure makes to a large matrix, we store these changes in a similar matrix that is statically initialized with the changed values. We replace the procedure with one that simply switches pointers to the array containing the ‘‘pre-cooked’’ results.
(4)
The phase behavior of a program can help us. If a program has several distinct execution phases separated by barrier synchronization, it is possible
Our goal is to quantitatively compare the predicted performance improvement to the actual performance improvement if we follow the advice of a given metric. If hhhhhhhhhhhhhhhh † None of the metrics attempt to identify (or are able to identify) the difficulty in fixing a procedure, they just provide a ranking of the importance of improving specific procedures.
--
--
-6to analyze each phase separately. For example, if a procedure in the first phase is being analyzed, it is possible to simply remove that procedure as long as the results are not used until a latter phase.
25
The elapsed time of serial sections of code before any parallel computation can simply be measured since any improvement in these procedures will directly reduce the execution time of the program.
Applying these techniques require a fair amount of skill and creativity, but provide a set of results that can be used to quantitatively compare different metrics. By using the above techniques, we were able to compute the True Zeroing value for each of the procedures in our test applications. 4. Case Studies We chose three application programs to use in our comparison of performance metrics. They were written for the Sequent Symmetry by people not involved in the IPS-2 project. All measurements were conducted on a dedicated system, and each program was run five times and the best time used. Repeated runs were used to reduce the effects of periodic operating system processes. For each test, we computed the metrics that we wished to compare (Critical Path, IPS-2 Profiling, NPT, Slack, and Logical Zeroing). In addition, we also ran conventional Gprof on each program. Finally, we computed the True Zeroing of each procedure in each application using the techniques described in the previous section. 4.1. Sparse Choleski Factorization The first application we compared was an implementation of sparse Choleski factorization (a common numeric code). It consists of 2,100 lines of C and 3,400
True Zeroing Critical Path NPT Gprof
20
Metric Value
(5)
lines of Fortran. For our purposes, the program’s most interesting characteristic is that its performance is seriously limited by synchronization.
15
10
5
0
at
Cm
nt pri
ol
Tc
od
cm
c p lem callo llCm i y f m
sE
t
nex
Procedure Figure 5. Comparison of metrics for sparse Choleski factorization. The performance data for this application is summarized in Figure 4 and graphed in Figure 5. The values for each metric have been normalized to a single scale so that direct comparison is possible. For this application, Critical Path correctly identifies the most important pro-
iiiiiiiiiiiiiiiiiiiiiiiiiiiiiiiiiiiiiiiiiiiiiiiiiiiiiiiiiiiiiiiiiiiiiii c c c c c Logical IPS-2 c c Procedure c True c Critical Slack NPT Gprof c c c Zeroing c Path c Zeroing Profiling c iiiiiiiiiiiiiiiiiiiiiiiiiiiiiiiiiiiiiiiiiiiiiiiiiiiiiiiiiiiiiiiiiiiiiii c c c c c c printCmat c 21.29 c 14.00 23.91 10.54 14.00 7.30 c 7.00 c c c c c c 9.72 13.89 9.28 12.84 c 5.06 c c Tcol c 18.39 c 10.63 c cmod c 14.27 c 6.99 1.41 5.05 5.54 10.69 c 1.95 c c c c c c 6.24 c 7.49 12.79 8.56 7.49 3.90 c 9.34 c c sElem c c mycalloc c 6.24 c 4.19 7.16 5.10 4.12 2.19 c 14.01 c c c c c c c fillCmp c 5.69 c 5.69 9.72 4.82 5.69 2.97 c 4.67 c c c c c c next 5.02 5.99 7.93 4.42 5.99 4.88 7.78 ciiiiiiiiiiiiiiiiiiiiiiiiiiiiiiiiiiiiiiiiiiiiiiiiiiiiiiiiiiiiiiiiiiiiiii c c c c Figure 4. Summary of the guidance supplied by the metrics for sparse Choleski.
The first column shows the True Zeroing data for each procedure, and the table is sorted by this value. For each procedure, the weight (importance) assigned to it by each metric is shown. The sixth column shows the values for standard UNIX Gprof.
--
--
-7cedure to fix (printCmat). The results for NPT and Gprof are not quite as good, NPT indicates that Tcol is more important than printCmat and that sElem is more important than cmod. Gprof, fails badly here and suggests that both mycalloc and sElem are more important than printCmat. Critical Path also has an incorrect ordering of procedures, on the 3rd and 4th procedures, and assigns similar weights to each. When comparing metrics using the graph, the left side of the graph is more important than the right side, because the True Zeroing value for each procedure (and therefore the procedure’s importance) decreases from left to right. i iiiiiiiiiiiiiiiiiiiiiiiiii c Metric Correlation c ci iiiiiiiiiiiiiiiiiiiiiiiiiic c Critical Path c 0.89 c c 0.80 c Logical Zeroing c c IPS-2 Profiling 0.78 c c NPT c 0.73 c c 0.45 c Slack c c Gprof c − 0.43 ci iiiiiiiiiiiiiiiiiiiiiiiiiic
other metrics. Surprisingly, IPS-2 Profiling did a slightly better job than NPT. This is because the NPT metric reversed the order of the first and second procedures to fix, and the order of the third and fourth procedures. IPS2 Profiling assigned too low of value to the sequential procedure printCmat, but provided accurate guidance for the parallel procedures. Slack performed better on this application than it did on the other two in the study because this application is out of balance and spent excessive time waiting on synchronization. Gprof did a poor job on this program (it had a negative correlation!) because the metric ignores synchronization.
Figure 6. Correlation Coefficient for sparse Choleski application.
Figure 7 shows the performance data for this application. The most interesting thing about this data is the createPool procedure. This procedure does not show up in any of the CPU time based metrics, but does show up in the NPT metric and True Zeroing because it makes a call to the operating system to setup shared memory. This call (mmap) is slow, and consumes a lot of system time, but no user time. Since NPT is based on elapsed time, it detected the time spent in mmap. The other metrics are based on CPU time. Because this one procedure’s system time is responsible for 27% of the program’s elapsed
To provide a single number to compare the quality of guidance from the metrics, we computed the correlation coefficient between each of the metrics and True Zeroing data. A correlation coefficient of 1.0 indicates a perfect linear correlation between the metric and True Zeroing, meaning the relative magnitude and ordering of the values for all procedures was correct. Figure 6 lists the correlation coefficients for this application. Overall, Critical Path did a somewhat better job than any of the
4.2. Shared Memory Join The second application tested, shm_join, was a program that performed a database join in sharedmemory. It consists of 6,000 lines of C and is a purely symbolic application. Shm_join was extensively tuned by the author using conventional performance tools. The program consists of four major phases: serial initialization, parallel initialization, tuple partitioning, and joining.
iiiiiiiiiiiiiiiiiiiiiiiiiiiiiiiiiiiiiiiiiiiiiiiiiiiiiiiiiiiiiiiiiiiiiiiiiii c c c c c Logical IPS-2 c c Procedure c True c Critical Slack NPT Gprof c c c Zeroing c Path c Zeroing Profiling c ciiiiiiiiiiiiiiiiiiiiiiiiiiiiiiiiiiiiiiiiiiiiiiiiiiiiiiiiiiiiiiiiiiiiiiiiiii c c c c c createPool c 27.01 c 0.00 0.00 23.19 0.00 0.00 c 0.00 c c c c c c 0.00 18.31 29.78 31.11 c 28.66 c c effectJoin c 18.25 c 29.78 c partition c 15.04 c 21.24 8.57 19.64 20.56 21.31 c 14.89 c c c c c c 2.86 7.71 14.38 15.07 c 13.58 c c randomShuffle c 12.19 c 14.38 c exchange c 10.41 c 6.57 11.43 5.18 6.40 6.90 c 1.50 c c c c c c c createQueues c 4.99 c 0.67 17.14 2.29 0.67 0.18 c 0.63 c c c c c c 3.64 c 5.51 2.86 3.25 5.51 5.61 c 7.80 c c initRelation c c writeblk c 2.85 c 4.49 2.86 2.89 4.49 4.73 c 12.95 c c c c c c 1.85 c 4.27 14.29 2.53 4.27 4.31 c 12.19 c c readblk c c initDb c 0.64 c 0.56 11.43 0.30 0.56 0.12 c 1.27 c ciiiiiiiiiiiiiiiiiiiiiiiiiiiiiiiiiiiiiiiiiiiiiiiiiiiiiiiiiiiiiiiiiiiiiiiiiii c c c c Figure 7. Summary of the guidance supplied by the metrics for shm_join.
--
--
-8time, it dominates the other procedures. To compare metrics for the other procedures, we have removed the createPool procedure from the data and re-normalized the values for the graph shown in Figure 8. The NPT metric reverses the order the next two remaining procedures (effectJoin and partition). The other metrics correctly order the remaining five procedures.
30
Metric Value
True Zeroing Critical Path NPT Gprof 20
10
program both with and without the createPool procedure. Those results are shown in Figure 10. For the NPT metric, the correlation coefficient goes down when the createPool procedure is removed. The NPT and the True Zeroing values are similar for this procedure (because it is serial), and when this data point is removed, the error that NPT makes in the ordering of effectJoin and partition becomes more important. Gprof provided substantially worse results than Critical Path, Logical Zeroing and NPT. Slack did not provide any meaningful results for this program because the program is well balanced, and so the secondary paths are similar in length to the Critical Path. iiiiiiiiiiiiiiiiiiiiiiiiiiiiiiiiiiiiiiiiiiiii c c Correlation c Metric c wo/createPool with createPool c ciiiiiiiiiiiiiiiiiiiiiiiiiiiiiiiiiiiiiiiiiiiii c c 0.92 0.40 c Critical Path c c IPS-2 Profiling 0.92 0.40 c c Logical Zeroing c 0.92 0.39 c c 0.91 0.94 c NPT c c Gprof c 0.67 0.16 c c − 0.53 − 0.57 c Slack iiiiiiiiiiiiiiiiiiiiiiiiiiiiiiiiiiiiiiiiiiiii c Figure 10. Correlation Coefficient for shm_join application.
0
lk lk Db in ion fle ge es on tJo artit Shuf chan Queu elati readb riteb init c e w p om ex ate itR eff d cre in ran
Procedure Figure 8. Comparison of metrics for shm_join. To provide a better comparison between the metrics, we computed the correlation coefficients for this
4.3. Parallel Cache Simulator (Ptycho) The third application, ptycho, is a parallel cache simulator. It was written to compare various cache algorithms and contains about 4,000 lines of C. This program is unusual because it contains no synchronization except for a barrier at the end. While this makes it atypical of most parallel programs, it does provide an opportunity to validate our comparison technique.
iiiiiiiiiiiiiiiiiiiiiiiiiiiiiiiiiiiiiiiiiiiiiiiiiiiiiiiiiiiiiiiiiiiiiiiiiii c c True c Critical c Logical IPS-2 c c Procedure c c c Gprof c Slack NPT Zeroing Profiling c ciiiiiiiiiiiiiiiiiiiiiiiiiiiiiiiiiiiiiiiiiiiiiiiiiiiiiiiiiiiiiiiiiiiiiiiiiii c Path c Zeroing c c c c c c 10.00 30.69 34.52 35.65 c 28.30 c c forEachRef c 36.65 c 35.19 c mainloop c 14.03 c 9.13 10.00 8.43 9.13 9.17 c 6.75 c c c c c c 10.00 15.51 16.93 17.43 c 16.46 c c Match c 11.31 c 17.15 c updatestack c 7.24 c 6.90 10.00 6.58 6.68 7.06 c 2.95 c c c c c c fetch 5.43 8.91 10.00 7.93 8.91 9.17 c 9.70 c c c c c movetoop c 4.52 c 3.56 10.00 3.20 3.34 3.59 c 1.69 c c readInputStream c 4.07 c 7.35 10.00 6.91 7.35 7.52 c 4.22 c c c c c c 3.79 10.00 3.37 3.56 4.16 c 1.69 c c get_next c 1.36 c c updatedist c 0.00 c 5.35 10.00 4.72 5.35 5.52 c 5.49 c c c c c c main 0.22 10.00 4.72 0.22 0.06 cc 0.00 cc cciiiiiiiiiiiiiiiiiiiiiiiiiiiiiiiiiiiiiiiiiiiiiiiiiiiiiiiiiiiiiiiiiiiiiiiiiii cc 0.00 cc Figure 9. Summary of the guidance supplied by the metrics for Ptycho.
--
--
-9The performance data for this program are summarized in table in Figure 9 and graphed in Figure 11. The improvements predicted by each of the metrics (except slack) are similar and closely track the actual improvement possible ("True Zeroing"). The prediction by the Slack metric is worse than the other metrics because the program is well balanced, so all the paths through the PAG have the same length. This is to be expected in a SPMD (Single Program Multiple Data) program without synchronization; the program is either running serially or completely parallel and executing the same procedures. The only major deviation for the other metrics from the True Zeroing is for the procedure match. All the performance metrics indicate this procedure was the second most important in the program, but True Zeroing shows it to be third. Instrumentation overhead exaggerated the importance of this procedure. The match procedure is called over 157,000 times, far more than any other procedure. As a result, the instrumentation, which has a fixed overhead per procedure call, recorded higher values for this procedure. 40
Metric Value
True Zeroing Critical Path NPT Gprof
20
0
h ck ch op ad xt st f p in t Re oo atc o re _ne edi ma ch ainl m testa fe ovet t t e a a g d E m m da up for up
Procedure Figure 11. Comparison of metrics for the Ptycho application. Figure 12 shows the correlation coefficients for the ptycho program. The Critical Path, IPS-2 Profiling, Logical Zeroing, and NPT metrics all had the same result, 0.95 correlation. Gprof did slightly worse, with a correlation coefficient of 0.90. Slack provided no useful information. In a SPMD program without synchronization all of the metrics except slack should have similar correlations because each metric should have the same value for each procedure. The different result for Gprof is because it is computed from sampled data and the rest of the metrics
use more accurate trace data. i iiiiiiiiiiiiiiiiiiiiiiiiii c Metric Correlation c ic iiiiiiiiiiiiiiiiiiiiiiiiii c c Critical Path c 0.95 c c 0.95 c IPS-2 Profiling c c Logical Zeroing 0.95 c c NPT c 0.95 c c 0.90 c Gprof c c Slack c 0.27 ci iiiiiiiiiiiiiiiiiiiiiiiiiic Figure 12. Correlation Coefficient for Ptycho application. 4.4. Discussion of Results The ideal performance metric would provide correct guidance in all cases. While providing good information for sequential programs is not difficult, the synchronization structure of parallel programs makes providing accurate guidance difficult. All metrics compared in our study provided some degree of guidance to the programmer. This guidance varied from very helpful to only marginally usable. Overall, Critical Path did somewhat better than the other metrics, but it too had problems. As predicted in Section 2, Critical Path distinguished itself most on the program with the greatest amount of synchronization (sparse Choleski). The one area where all metrics could be improved is in their accounting for system time. Critical Path currently ignores this time altogether. Although NPT automatically picks up system time (because it is based on elapsed time), this can have both hidden benefits and problems. For example in the shared memory join application, the procedure partition had a large amount of system time from page faults. While this time is important, unless the programmer is aware that the problem with a particular procedure is due to system time, they will not know how to fix it. Currently IPS-2 collects system time information via an external sampling process[11]. This approach provides good coarse-grained information, but does not isolate the cause of a system time bottleneck to a specific procedure. We also discovered that the slack metric generally failed to provide useful guidance. Because all of the programs considered in our case study were written in a SPMD style, slack provided too low of a value for procedures that were on both the Critical Path and secondary paths. We are currently looking into ways to improve slack to handle this case. We are also investigating using slack on client-server applications where the code in each process is different. Another class of problems revealed in our study was caused by the way some of the metrics were imple-
--
--
- 10 mented. For example, procedure level profiling provides a wealth of information to the programmer, but for some programs, once a performance problem has been isolated to a specific procedure, it would be useful to profile basic blocks. None of the metrics compared currently support this level of data collection. For example in the ptycho program, the procedure forEachRef contains two important for loops, and it was not possible to identify which loop should be examined first. This problem is particularly acute in scientific programs because they tend to have several important loops located in a single procedure. Another implementation problem is instrumentation overhead. Overhead of as little as 15-20% can bias the results of a tool; this is especially true for short procedures that are called frequently. In our study, the importance of the match procedure from the ptycho application was exaggerated because of instrumentation overhead. Besides trying to reduce this overhead, tools need to provide feedback on observed overhead and perturbation. In this study, instrumentation perturbation was systematic and uniform for all of the metrics, so differences between metric values were due to fundamental differences, not artifacts of implementation variations. The goal of increasing the precision of data collected directly conflicts with the goal of reducing instrumentation overhead. To avoid this problem, tools need to incorporate better algorithms to reduce the amount of data collected. AE[13], QP[3], and Mtool[9] are examples of this approach to the problem. Another option is to alter dynamically the level of instrumentation during a program’s execution, depending on the desired information. This approach offers the greatest flexibility, but requires additional effort by the programmer (or a sophisticated performance tool) to select the right information to collect at the right time. Based on our case studies, we have also discovered several things that apply to performance systems and parallel programming in general. First, because each metric was useful on a least one of the programs, we feel that tools need to support multiple metrics. However, a performance measurement system must also provide guidance to programmers about which metrics are useful for a particular program. For example, the degree to which the program is balanced can influence which metrics will provide useful guidance. The complexity of a metric’s computation and the amount of data that must be collected to compute it also influence metric selection. A performance system should use this kind of information to help guide the user in selecting appropriate metrics; without this additional assistance, programmers can drown in a sea of metrics.
We also discovered an interesting trend in two of the three programs; the programmers were not making effective use of the system libraries. For example, the sparse Choleski program implemented its own bubble sort rather than calling the standard C library function qsort. In another application, the elapsed time was improved 20% by using a different version of the bcopy library that was optimized for word aligned transfers. Until programmers make better use of the libraries, parallel programs will be written as hand crafted programs and not built from modular building blocks. Finally, we have a few comments about our technique for comparing metrics. It provided valuable information and permitted us to compare the metrics we wanted. However, the technique is tedious. Removing each procedure from the program requires too much time. If it were possible to automate this process, the technique would be easier to apply to more programs. One possible approach is to use the methods of program re-execution developed for parallel debugging described in [5]. 5. Conclusion We presented a new technique, called True Zeroing, that permits direct, quantitative, and fair comparison of parallel program performance metrics. We applied this technique to six metrics on three parallel applications with widely varying styles. The result of this comparison was that while Critical Path provided the best overall guidance, it was not universally better than the other metrics compared. Because there is no single universal metric, future parallel performance systems need to support multiple metrics. However, these systems must also assist the user in selecting appropriate metrics for their application. This additional guidance is necessary to make complex performance tools easy to use. Tools must also provide feedback to the user about the overhead they introduce into applications. Proposals for new metrics should include comparison to existing metrics. There are many metrics that provide some degree of guidance, but only head-to-head comparison can show that a proposed metric is better on real programs. In general, it is easy to develop a new metric that provides some guidance, and performs better than Gprof†. References 1.
T. E. Anderson and E. D. Lazowska, "Quartz: A Tool for Tuning Parallel Program Performance", Proc. of the 1990 SIGMETRICS Conference on
hhhhhhhhhhhhhhhh † In fairness to the creators of Gprof, it was never intended to be used on parallel programs.
--
--
- 11 Measurement and Modeling of Computer Systems, Boston, May 1990, pp. 115-125. 2.
D. F. Bacon and R. E. Strom, "Optimistic Parallelization of Communicating Sequential Processes", SIGPLAN ’91 Symposium on Principals and Practice of Parallel Programming, Williamsburg, VA, April 21-24, 1991, pp. 155166.
April 1991, pp. 189-200. 12.
J. K. Hollingsworth and B. P. Miller, "Slack: A Performance Metric for Parallel Programs", Computer Sciences Technical Report, March 1992.
13.
J. R. Larus, "Abstract Execution: A Technique for Efficiently Tracing Programs", SPE 20, 12 (Dec 1990), pp. 1241-1258.
14.
B. P. Miller and J. Choi, "A Mechanism for Efficient Debugging of Parallel Programs", Proc. of the SIGPLAN/SIGOPS Workshop on Parallel and Distributed Debugging, Madison, WI, May 5-6, 1988, pp. 141-150.
15.
B. P. Miller, M. Clark, J. Hollingsworth, S. Kierstead, S. Lim and T. Torzewski, "IPS-2: The Second Generation of a Parallel Program Measurement System", IEEE Transactions on Parallel and Distributed Systems 1, 2 (April 1990), pp. 206-217.
3.
T. Ball and J. R. Larus, "Optimally Profiling and Tracing Programs", Conference Record of the Nineteenth ACM Symposium on Principles of Programming Languages, Albuquerque, NM, January 19-22, 1992, pp. 59-70.
4.
K. M. Chandy and J. Misra, "Distributed computation on graphs: Shortest path algorithms", CACM 25(Nov. 1982), pp. 833-837.
5.
J. Choi, B. P. Miller and R. H. B. Netzer, "Techniques for Debugging Parallel Programs with Flowback Analysis", ACM Trans. on Programming Languages and Systems 13, 4 (October 1991), pp. 491-530.
16.
J. Choi and S. L. Min, "Race Frontier: Reproducing Data Races in Parallel-Program Debugging", SIGPLAN ’91 Symposium on Principals and Practice of Parallel Programming, Williamsburg, VA, April 21-24, 1991, pp. 145-154.
R. H. B. Netzer and B. P. Miller, "Improving the Accuracy of Data Race Detection", SIGPLAN ’91 Symposium on Principals and Practice of Parallel Programming, Williamsburg, VA, April 21-24, 1991, pp. 133-144.
17.
R. Title, "Connection Machine Debugging and Performance Analysis: Present and Future", Proc. of the ACM/ONR Workshop on Parallel and Distributed Debugging, Santa Cruz, CA, May 2021, 1991, pp. 272-275.
18.
C. Yang and B. P. Miller, "Critical Path Analysis for the Execution of Parallel and Distributed Programs", 8th Int’l Conf. on Distributed Computing Systems, San Jose, Calif., June 1988, pp. 366-375.
6.
7.
R. J. Fowler, T. J. LeBlanc and J. M. MellorCrummey, "An Integrated Approach to Parallel Program Debugging and Performance Analsys on Large-Scale Multiprocessors", Proc. of the SIGPLAN/SIGOPS Workshop on Parallel and Distributed Debugging, Madison, WI, May 5-6, 1988, pp. 163-173.
8.
A. P. Goldberg, A. Gopal, A. Lowry and R. Strom, "Restoring Consistent Global State of Distributed Computations", Proc. of the ACM/ONR Workshop on Parallel and Distributed Debugging, Santa Cruz, CA, May 20-21, 1991, pp. 144-154.
9.
A. J. Goldberg and J. L. Hennessy, "Performance Debugging Shared Memory Multiprocessor Programs with MTOOL", Proc. of Supercomputing’91, Albuquerque, NM, Nov. 1822, 1991, pp. 481-490.
10.
S. L. Graham, P. B. Kessler and M. K. McKusick, "gprof: a Call Graph Execution Profiler", SIGPLAN ’82 Symposium on Compiler Construction, Boston, June 1982, pp. 120-126.
11.
J. K. Hollingsworth, R. B. Irvin and B. P. Miller, "The Integration of Application and System Based Metrics in A Parallel Program Performance Tool", Proc. of the 1991 ACM SIGPLAN Symposium on Principals and Practice of Parallel Programming,