Performance Study of Wireless Mesh Networks Routing Metrics S. Waharte, B. Ishibashi, R. Boutaba David R. Cheriton School of Computer Science University of Waterloo Waterloo, Ontario, Canada N2L 3Gl {spwahai-te,bkishiba,i-boutaba)@ cs.uwaterloo.ca D. Meddour France Telecom Research FT/RD/CORE/M21 Lab 2 avenue Pierre Marzin 22307 Lannion Cedex - France
[email protected]
Abstract Multihop wireless mesh networks are an attractive solution for providing last-mile connectivity. However, the shared nature of the transmission medium makes it challenging to fully exploit these networks. In an attempt to improve the radio resource utilization, several routing metrics have been spec@cally designed for wireless mesh networks. Howevel; although some evaluations have been conducted to assess the performance of these metrics in some contrived scenarios, no overall comparison has been performed. We therefore studied the performance of the most popular routing metrics currently used in wireless mesh networks: Hop Count, Blocking Metric, Expected Tranmission Count (ETX), Expected Transmission Time ( E m ) , ModiJed ETX (mETX), Nelwork Alloculion Veclor Counl (NAVC) and Metric of Interference and Channel-Switching (MIC). We showed under various simulation scenarios that although all the metrics except NAVC offer the same endto-end delay and packet loss ratio, differences can be distinguished in terms o f tramc load repartition. In particulal; the congestion-avoidance strategies of ETX, mETX, and MIC prevent the starvation offlows following longer paths and consequently provide a more uniform trafhc repartition.
1 Introduction In response to the increasing demand for ubiquitous low latency, high volume communication, the deployment of Wireless Mesh Networks (WMNs) has become an attractive alternative to wired solutions, 3G cellular systems, and WLANs. WMNs can offer high levels of service coverage, while requiring relatively inexpensive deployment costs.
978-1-4244-1968-5/08/$25.00 ©2008 IEEE
1100
Initial deployments [ I l l [12] have demonstrated WMNs' tremendous potential and market value. WMNs have been utilized to inexpensively share Internet connections in lowincome community networks [9], and for deploying coverage across uriiversily carnpuses (e.g. MIT, Uriiversily o l Arkansas). As a result, several companies including Nokia [lo], Microsoft [S], and Intel [5] are actively promoting full IP-based solutions for WMNs. Nonetheless, despite the technological progresses and the possibility to concurrently transfer data on multiple channels, transmission rates remain limited compared to the ones offered in wired networks. Consequently, adequate resource management and service provisioning mechanisms become necessary to meet consumers' increasing demand for QoS guarantees. Creating the necessary resource management framework starts with an effective routing protocol, and particularly an adapted routing metric. Recently, the number of proposals of routing metrics tailored for wireless mesh networks has flourished. Through different strategies, they try to evaluate the levels of interference and route the traffic flows around the most congested areas. But so far, none of them has been unanimously adopted. Several reasons can explain this situation. Level of complexity: At the opposite of some topological or traffic-related parameters that can be easily obtained, measuring the level of interference is a challenging task. First, the channel quality can be hard to assess as it changes geographically and evolves overtime. A sender and receiver can potentially suffer from different levels of interference, that can lead to a poor quality of communication (with a high packet loss) if the transmission rates are not properly adjusted. Second, the shared nature of the transmission medium makes it difficult to properly evaluate a link utilization as all the nodes in the same neighborhood configured
on the same frequency band can freely compete to access the transmission medium. Therefore, unless the exact information on the traffic characteristics for all the nodes can be maintained and assuming a perfect data scheduling, only a rough approximation of the actual network status can be obtained. Moreover, the exchange of control messages is usually required to propagate link quality measurements. The cost involved in these operations can overshadow the actual improvement obtained by avoiding lossy or congested links. Lack of comparisons: to the best of our knowledge, no complete evaluation of the existing contributions in this area has been performed. Each proposed metric has been evaluated in some limited scenarios, with specific parameters, in comparison with only a small subset of the existing routing metrics. Lack of understanding: the existing evaluations of the different routing metrics for wireless mesh networks have only been conducted for some very contrived scenarios. Insights on the metrics efficiency in different situations have rarely been provided. In these circumstances, it is difficult to extrapolate on the performance of a particular metric if different network settings are considered. Therefore, by assessing the relative performance of the most commonly used routing metrics for wireless mesh networks, we intend to fill in the gap that exists in the understanding of the performance of the WMN routing metrics. The metrics considered are Hop Count, Blocking Metric, ETX, mETX, ETT, NAVC and MIC. We focus particularly on evaluating parameters such as end-to-end delay, packet loss and path length for various simulations, with different network topologies and traffic characteristics. Based on the results obtained, we will therefore be able to empower network designers to make informed decisions in the choice of a routing metric. The remainder of this paper is organized as follows. In Section 2, we define a set of criteria against which the chosen metrics will be compared. We then describe more precisely the implementation of the routing metrics in Section 3. The results of the evaluations are presented in Section 4. Finally, we conclude the paper in Section 5.
2 Route Selection in Wireless Mesh Networks Routing in WMNs extends network connectivity to end users through multi-hop relays. Packets can be routed via one or multiple paths, possibly using several different channels. Depending on the application requirements, a routing protocol can focus on optimizing one or more routing metrics. Path length, end-to-end delay or packet loss represent some parameters whose importance vary depending on the level of quality requested by an application. As mentioned previously, interference also represents an important factor to account for. Indeed, in wireless communications, severe performance degradation can result from interference of concurrent data transmissions. The shared
1101
transmission medium constrains all nodes in the interference range of a sender or receiver to inactivity until completion of the ongoing communication. In their seminal work [3], Gupta and Kumar have shown that in a wireless network with n identical nodes, the achievable per node throughput with random node placement and commuis O(l/d-) nication pattern. Under the assumption of an optimal node placement and communication pattern, this throughput becomes O ( l / f i ) . Interference can occur: a within a single flow (intra-flow interference): a com-
munication between two nodes on one path can block the upstream and downstream nodes that are at interference range. a between multiple flows from one or multiple sources
(inter-flow interference). This phenomenon is referred to as route coupling effect. Therefore, when a new flow is to be sent across the network, it is important to realize that the actual expected performance can not simply be estimated without considering the flows already established and without considering the impact of adding this new flow on the existing ones. In order to give a clear overview of the focus of the routing metrics considered and before to delve into the details of their design, we first define a set of criteria against which we compare these routing metrics. This list, although not exhaustive, encompasses a set of factors that we consider have the greatest impact in the performance of a wireless mesh network. Different parameters can enter into the computation of a routing metric. Among them, the ones that can be considered as the most characteristic of wireless networks are the followings: a Path Length: The number of hops between a source and
the destination is an important and the most commonly used comparison criterion as a longer path means more self-interference (interference among links along the same path) and consequently a potentially greater endto-end delay. A flow transmitted along a long path also affects a greater number of links located geographically close to this path. a Bandwidth: In a network, it is not uncommon to have
links that support different data rates. This can be the result of technical limitations or in the case of wireless networks, environmental noise and signal strength. This difference in capacity has an effect not only on the link considered but also on the capacity of geographically close links. Indeed, the use of a lowercapacity link not only increases the transmission delay of the flow crossing the link considered, but reduces the achievable rate of neighboring transmissions by increasing their interference level. As current hardware
allows rate adaptation depending on the quality of the transmission medium, obtaining and maintaining this information can significantly improve the network performance. a Interference: Due to the shared nature of the transmis-
sion medium, nodes transmitting on the same channel can interfere with each other if they are located in the same geographical area. Integrating interference in the design of the routing metric can therefore help combatting network congestion and increasing the overall network performance. a Packet Loss: Channel quality can be assessed by esti-
mating the number of retransmissions necessary for a transmission to be successfully performed. We will also distinguish the level of complexity of the routing metrics based on some implementation parameters such as: a per-node/per-link metric: a per-link metric can po-
tentially allow to maintain fine-grained information of each link, whereas a per-node metric assumes by default that all the links attached to a node have the same cost. On the downside, a per-link metric might be costly to maintain (e.g. extra control messages). a knowledge: a metric can be computed based on differ-
ent information: packet loss, number of nodes, number of neighbors, traffic characteristics, etc. a interference: different strategies with different level of
complexity might be implemented to account for the interference.
3 Routing Metrics Description In this section, we present some routing metrics that are currently used in WMNs. They were either specifically tailored for WMNs or previously developed for other types of networks (e.g. ad hoc networks) but adopted in WMNs due to their similarities with WMNs. We are considering the following metrics: Hop Count, Blocking Metric, Expected Transmission Count (ETX), Expected Transmission Time (ETT), Modified Expected Number of Transmissions (mETX), Network Allocation Vector Count (NAVC) and Metric of Interference and Channel-Switching (MIC).
3.1
Hop Count
Hop count is the most commonly used metric in wireless multihop networks. The path selected is the one minimizing the number of links between a given source and destination node. It became very popular in ad hoc networks due to its easiness of computation as it only considers the route length as differentiation criterion. However, on the downside, this
1102
routing metric fails to account for the specifics of wireless environments (links may have different transmission rates, loss ratios, etc.) and it does not consider the congestion level resulting from the shared use of the transmission medium.
3.2
Blocking Metric
A simple improvement over hop count has been presented in [13] in order to account for the interference along a certain path. In this work, the interference level referred to as Blocking Value, is defined as the number of neighbors a node is interfering with. Each node is therefore weighted according to this Blocking Value. The Blocking Metric of a path is then defined as the sum of all the blocking values along the path. The paths with minimum cost will consequently be used to carry the traffic flows. This technique presents the advantage of being simple, without any additional overhead than to maintain some information on the number of neighbors. However, this metric still does not integrate any characteristic concerning the traffic flows or link capacity and only superficially addresses the issue of interference. Little improvement over hop count is therefore to be expected.
3.3
Expected Transmission Count (ETX)
Expected Transmission Count is defined as the number of transmissions required to successfully deliver a packet over a wireless link [I]. The ETX of a path is then defined as the sum of the ETX of each link along the path. Let p f and p, be the packet loss probability in the forward and reverse directions. The probability p of an unsuccessful transmission is:
Therefore, the expected number of transmissions to successfully deliver a packet in 1 hop can then be expressed as: 00
1 C k p k ( l - p ) * ~ ' = l_p k= l The delivery ratios are measured using 134-byte probe packets. One probe packet is sent every 7 second (set to 1 sec in the experiments). The packet loss ratio is computed by counting the number of probe packets received over a predetermined period of time (10 seconds). ETX favors paths with higher throughput and lower number of hops as longer paths have lower throughput due to increased self-interference. However, this metric does not consider differences in transmission rates. It does not allow to completely capture the interference on the transmission medium as the sender of a probe packet can defer its transmission if it senses the channel busy. And as the transmission rate of the probe packets is typically low, it does not give a good indication on how busy a link really is. It also does not give any information on the effective link share.
ETX
=
3.4
2. If 0.25 < NAVC square of NAVC;
Expected Transmission Time (ETT)
ETT is an improvement over ETX as it includes the bandwidth in its computation [2]. Let S be the packet size and B the bandwidth of the link considered, then ETT is computed as follows:
S B Similar to ETX, the expected transmission time of a path is computed as the sum of the links' ETT along the path. The authors later improved over ETT by proposing Weighted Cumulative ETT (WCETT) [2]. This metric was designed to favor channel-diverse paths. For a path p, WCETT is defined as follows: ETT
= ETX-
where /3 is a tunable parameter less than 1 and X, represents the number of times channel j is used along path p. Nonetheless, this metric still suffers from the same limitations as ETXIETT by not estimating the effective link share and does not completely capture inter-flow interference.
3.5
Modified Expected Number of Transmissions (mETX)
[6] proposed an enhancement over ETX based on the observation that ETX does not account for the channel variability and only considers the average channel behaviour. The authors therefore defined mETX as follows:
mETX
=
1 exp(pc + -0;) 2
(1)
where pc and a; represent the average and the variability of the error probability. The main challenge in the implementation of this metric is to properly model and quantify the variability of the transmission channel.
3.6
Network (NAVC)
Allocation
Vector
Count
NAVC [7] essentially accounts for the interflow interference by averaging the values of the Network Allocation Vector experienced by a node along a link for a given observation period. According to the value obtained, a level of congestion is attributed to the node. During the route discovery process, two parameters, heavy-node-number and navsum, are maintained. Upon reception of a ROUTE REQUEST packet, a node has therefore three options depending on the value of the measured NAVC. 1. If NAVC > 0.65: increase heavy-node-number by 1 and add to navsum the square of NAVC;
1103
< 0.65:
increase navsum by the
3. If NAVC < 0.25: do nothing. The cost of a path consists then of the sum of the
heavy-node-number of each node along the path and the sum of the nav-sum. Paths are therefore given priority first depending on the heavynode-number and then on the nav-sum.
3.7
Metric of Interference and ChannelSwitching (MIC)
[14] has been designed to improve over WCETT by capturing more information on the effective link share. For a network composed of N nodes and a path p, MIC averages the time to transmit on a particular link over the minimum time to transmit over all the existing links. Similarly to WCETT, MIC adds a term to account for channel diversity called Channel Switching Cost (CSC).
MIC(p) =
1
C
IRU1+
C
CSS
node i t p
min(ETT)represents the smallest ETT in the network and IRUl represents the interference-aware resource usage defined as:
csc, =
wl
w2
if CH(prev(i))# C H ( i ) if CH(prev(i))= C H ( i )
Nl is the number of nodes link 1 is interfering with, ETTl is the expected transmission time on link 1, C H ( i )is the channel assignment of node i and prev(i) represents the node before node i along path p. IRUl can therefore be interpreted as the total channel time consumed by link 1. CSC is a weight allocated to a link as a function of the channel used by the link preceding the link considered on a particular path. If both links use the same channel, a greater weight is assigned to the link. This metric presents some major drawbacks in terms of implementations. First the overhead required to maintain up-to-date information of the ETT for each link can significantly affect the network performance depending on the traffic loads. Second, this metric assumes that all the links located in the collision domain of a particular link contribute to the same level of interference, which is oblivious of the differences of traffic loads at each node.
4 Performance Evaluations 4.1
Implementation Details
We compare the performance of the routing metrics through simulations implemented in NS2 [4]. The simulations have been set up with different network topologies randomly generated in a 2000mx2000m area. The transmission range is 250m whilst the interference range (carrier-sense range) is 550m. UDP is used at the transport layer and all flows are sent at a constant bit rate, with a packet size of 512 bytes or 1512 bytes. The source and destination of each flow are randomly chosen in order to avoid the appearance of a single bottleneck. We only performed simulations assuming a single channel environment. This decision was motivated by the fact that we wanted to perform a fair comparison of the performance of the metrics, which is difficult to achieve between single and multi-channel metrics. Besides, it is worth noting that even though some metrics have not been initially designed to handle channel diversity, the addition of a cost factor similarly to what has been done for ETT or MIC (described below) can straightforwardly resolve this issue. For each configuration, we evaluated the end-to-end delay, the path length and the packet loss. As all links have the same nominal capacity and as the packet size is fixed through each simulation scenario, ETX and ETT necessarily lead to the same results. We therefore only refer at ETX in the remainder of the papers (although the same results apply for ETT). The packet loss ratio is determined via the periodic transmissions of probing packets (sent every second in the simulations). The routing tables are recomputed periodically. To make the implementation oblivious of the specifics of a particular routing protocol, we assume the existence of a central entity responsible to compute and keep the routers updated with the optimal routing tables at any given time.
4.2
Simulation Results
4.2.1 Impact of the Network Size
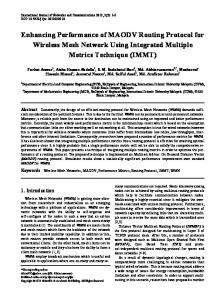
First, we evaluated the impact of the network size on the performance of each routing metric. We increased the number of nodes from 10 to 100 nodes with 5 traffic flows of 20 pktlsec. The results obtained consist of an average over all the flows. Figure 1, Figure 2 and Figure 3 show the average end-to-end delay, the average number of hops and the average loss probability for the number of nodes considered. We observe that NAVC overall performs poorly in terms of delay and packet loss compared to the other metr i c ~implemented. To incorporate the value of the network allocation vector in the metric computation could theoretically provide some useful information on the effective link share at each node. However, the thresholds used in the computation of the values of heavy-nodenumber and nav-sum
1104
are solely based on simulations and analysis not described by the authors. Moreover the difference in link capacities is not accounted for, neither are traffic characteristics. As the network size increases, the performance degrades significantly to lead to a situation in which only flows for which the source and destination are within direct reach of each other can successfully be transferred. This explains why the number of hops is significantly better in this case for NAVC than for the other metrics. If we ignore NAVC, we can observe that the rest of the metrics perform relatively the same in terms of end-to-end delay and packet loss. The most significant difference appear in terms of path length. Routing implemented with Hop Count or Blocking Metric offers path length in average 10 to 15% shorter than with ETX, mETX or MIC. If we have a closer look at the per-flow performance, we can actually observe a fairer traffic load repartition in the case of ETX, mETX and MIC whereas Blocking and Hop Count can lead to the starvation of some flows to the benefit of others. This result is not surprising as ETX, mETX and MIC favor less congested paths whereas Hop Count and Blocking Metric favor shortest but potentially more congested paths. This first scenario demonstrates that if we are not concerned with fair traffic repartition, Hop Count and Blocking Metric appear as the best solutions as: 11they offer the same performance in terms of end-to-end delay and packet loss as ETX, mETX or MIC; 21 they are simpler to implement and do not engender any overhead as it is required for ETX, mETX or MIC for the estimation of the channel condition. However if fairness is an issue, ETX, mETX and MIC offer a better load repartition.
4.2.2 Impact of the Traffic Load
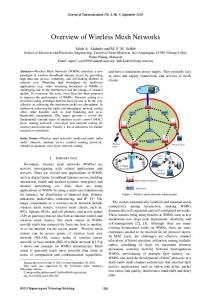
In the second set of simulation, we studied how the traffic load can impact the network performance in diverse scenarios by progressively increasing the number of flows between 5 and 30 for a network composed of 50 nodes uniformly scattered over a 2000mx2000m area. As in the previous case, NAVC performs very poorly compared to the other routing metrics. In terms of end-to-end delay, Hop Count still performs the best followed by Blocking, ETX, MIC and mETX. When looking at the packet loss, all the metrics except NAVC performs relatively the same. This leads to the conclusion that when the traffic load increases, the interference-avoidance strategy of ETX, mETX or MIC do not lead to a better performance although they try to avoid the most congested path (which is in particular reflected by the choice of longer paths hence a higher average number of hops). However, similarly to the previous case, ETX, mETX and MIC allow a fairer traffic repartition. We ran similar experiments while increasing the size of the topologies. We considered networks with 100 and 150 nodes and analyzed the resulting network performance. As
Figure 1. End-to-end Delay with increasing number of nodes
Figure 4. End-to-end Delay with increasing number of flows
Figure 2. Number of hops with increasing number of nodes
Figure 5. Number of hops with increasing number of flows
the path length increases, with a similar number of flows, the probability of collision increases. Therefore, flows on shorter paths have a greater chance to be successfully transmitted. Hop Count and Blocking Metric still perform the best in terms of packet loss whereas ETX, mETX and MIC, although trying to avoid congested areas, lead to a poor network utilization by electing longer paths and therefore contributing even more to the interference level. We also analyzed the impact of the packet size on the network performance. We ran the same sets of simulations with packets of 1512 bytes. With only 5 flows, given the network characteristics considered, the network gets immediately congested. The packet loss probability is in the order of 70% for 5 traffic flows and goes over 80% with 30 flows. Moreover, if a packet has to be retransmitted due to a collision, a greater packet size will incur some extra time for transmission and consequently an increased end-to-end delay. When the number of flows increases, similarly to the previous observation, the flows between the closest sourcedestination pairs (1 hop away) are favored and starved the other traffic flows. This is a direct consequence of the way the MAC protocol has been designed. As the number of collision increases, the backoff time (mandatory waiting time before to attempt another transmission) exponentially increases as well.
1105
Figure 3. Packet loss with increasing number of nodes
Figure 6. Packet loss with increasing number of flows
For the packets that succeed in going through, given the packet size, retransmitting a packet due to a collision will take 3 more times compared to the previous experiments.
5 Conclusion With the rise of user expectation of anywhere connectivity and quality of service guarantees, new wireless technologies are sought after for their versatility, ease of deployment, and low cost. Wireless mesh networks present a promising solution by extending network coverage based on mixture of wireless technologies through multi-hop communications. WMNs exhibit several prominent characteristics that make them stand apart from traditional wired or wireless networks, and hence call for new resource management techniques. Routing in multi-hop wireless networks is a challenging research issue, as paths self-interfere and interfere with concurrent transmissions. The medium quality can also be responsible for packet loss and trigger retransmissions that consequently impact the network performance. To address the above issue, it is important to implement a routing protocol that integrates these parameters in the path computation. However, depending on the network configuration, the cost of maintaining this information may not be
justified and a simple metric such as Hop Count performs similarly well or even better that more sophisticated metrics such as mETX or MIC. In this paper, we studied the performance of six different routing metrics, while varying the network size, the number of flows and the packet sizes. Although one might think at first that metrics such as ETX or MIC that try to account for the interference generated by concurrent transmissions should perform better that a simple metric such as Hop Count, it appears that all the metrics except NAVC performs similarly in terms of end-to-end delay and packet loss. Several reasons can explain this phenomenon. First, shortest paths although more prone to cross congested areas, suffer less from self-interference and interfere with a smaller amount of nodes/links. Second, the unfairness of IEEE802.11 is a well-known issue whose direct consequence is to favor shortest paths. Therefore, flows that are sent over longer paths are more susceptible to suffer from starvation. On the other hand, a closer look at the per-flow performance shows that ETX and MIC achieve a better traffic repartition than Hop Count and Blocking Metric by forwarding the traffic flows to less congested areas. Therefore, depending on what is the concern, simplicity of implementation or fairness, the choice of the routing metric might differ. As future works, we will investigate the impact of the choice of a routing protocol on the metric performance. Our implementations have alleviated this issue to focus on the study of the routing itself but this is certainly a concern in practical implementations.
References [I] D. De Couto, D. Aguayo, J. Bicket, and R. Morris. A high-throughout path metric for multi-hop wireless routing. In Proceedings of the 9th Annual Znterna-
tional Conference on Mobile Computing and Networking (MobiCom),2003. [2] R. Draves, J. Padhye, and B. Zill. Comparison of routing metrics for static multi-hop wireless networks. In Proceedings of the 2004 conference on Applica-
tions, technologies, architectures, and protocols for computer communications (SZGCOMM),August 2004.
[3] P. Gupta and P.R. Kumar. The capacity of wireless networks. ZEEE Transactions on Information Theory, 46(2):388404, March 2000. [4] http://www.isi.edu/nsnam/ns/. The network simulator - ns2. [5] Intel. http://www.intel.com. [6] C.E. Koskal and H. Balakrishnan. Quality-aware routing metrics for time-varying wireless mesh networks.
1106
ZEEE Journal on Selected Areas in Communications, 24(11):1984-1994, November 2006. [7] L. Ma, Q. Zhang, Y. Xiong, and W. Zhu. Interference aware metric for dense multi-hop wireless networks. In
Proceedings of the ZEEE International Conference on Communications (ZCC),2005. [8] Microsoft. http://www.research.microsoft.com/. [9] Equal Access Community Internet NetEquality. http://www.netequality.org/. [lo] Nokia. http://www.iec.org/events/2002/natlwireless~ov/featurec tfLbeyer.pdf. [ I l l K. Rayner. Mesh wireless networking. Communications Engineer, 1(5):4447,Oct.-Nov. 2003. [12] B. Schrick and M.J. Riezenman. Wireless broadband in a box,. ZEEE Spectrum, 39(6):3843, June 2002. [13] H.-Y. Wei, S. Ganguly, R. Izmailov, and Z. Haas. Interference-aware ieee 802.16 wimax mesh networks. In Proceedings of the ZEEE Vehicular Technology Conference (VTC), 2004. [14] Y. Yang, J. Wang, and R. Kravets. Designing routing metrics for mesh networks. In Proceedings of the 1st
ZEEE Workshop on Wireless Mesh Networks (WiMesh), 2005.