1
Physically-consistent Parameterization in the Modeling of Solar Photovoltaic Devices Georgi Hristov Yordanov and Ole-Morten Midtgård, Member, IEEE
Abstract--This research tests the standard one-diode model of a crystalline-Si photovoltaic cell, focusing on the physical accuracy. In particular, the (apparent) shunt resistance and the diode ideality factor are studied. Current-voltage characteristics of illuminated crystalline-Si photovoltaic modules are analyzed, and some limits of applicability of the standard model are given. Typical values of the ideality factor for crystalline-Si devices are derived from own experimental data as well as from recently published literature. It is shown that the contribution of the apparent shunt resistance is only significant for cell voltages below about 0.45 V, and depends on irradiance. This result is consistent with earlier research. Some reference books on Photovoltaics give a wrong shape of the electrical characteristic based on a non-physical interpretation of the shunt resistance. This paper may be particularly useful for power electronics engineers designing inverters and maximum-power-point tracking algorithms. Index Terms-P-n junctions, Photovoltaic Semiconductor device modeling, Shunt resistance
cells,
however, the corresponding mathematical formulations (there are many) can describe a whole wealth of I-V curve types. The lack of sufficient physical understanding of the model parameters may lead to wrong assumptions (as there are always aspirations for simplification) that may affect the design of the balance-of-system components, such as MPP trackers, in a negative way. Irradiance-dependent (apparent) shunt resistance, series-resistance effects, and cell ideality factors greater then 1 deserve special attention. Descriptions of subtleties related to these parameters, typical values, and some basic properties common to all I-V curves are missed in (otherwise extensive) handbooks on PV science and engineering [1], [2]. The purpose of this paper is to provide a factual scientific basis for understanding and proper modeling of non-shaded current-voltage characteristics of PV devices, focusing on monocrystalline- and polycrystalline-Si technologies. II. BACKGROUND
I. MOTIVATION
P
OWER electronics engineers designing inverters and maximum-power-point tracking (MPPT) algorithms for solar photovoltaic (PV) systems include in the design process extensive computer-aided simulations. Models of the photovoltaic sub-system and of the balance-of-system components (the power converter plus the MPP tracker) are implemented and studied using software tools like e.g. PSpice. Lumped-circuit models of PV devices have been established in the past half a century, and their applications abound in the literature. These models are quite simple in the case of crystalline-Si devices which still dominate the PV market. An individual solar cell can be represented by a current source, a diode, and two resistances. The model of a crystalline-Si PV module is similar, but has multiple diodes in series (or a single diode with an upscaled ideality factor), plus a few by-pass diodes. However, the parameterization of the above models is not straight-forward, if a correct representation of the physical reality is aimed at. Indeed, the current-voltage characteristic (I-V curve) of a non-shaded PV device may look very simple; The authors acknowledge financial support by the Norwegian Research Council, Elkem Solar AS and the Municipality of Kristiansand. G. H. Yordanov is with the Department of Engineering Sciences, University of Agder, 4879 Grimstad, Norway (e-mail:
[email protected]). He is also with the Department of Electrical Power Engineering, NTNU, 7491 Trondheim, Norway. O.-M. Midtgård is with the Department of Engineering Sciences, University of Agder, 4879 Grimstad, Norway (e-mail:
[email protected]).
IL
D1
RS
D2 RP
I
+ V _
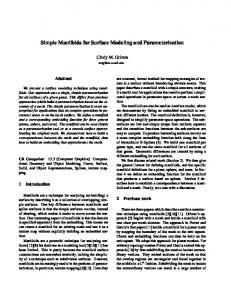
Fig. 1. An often used lumped-circuit model of a crystalline-Si PV cell. Crystalline-Si PV cells are sometimes modeled with a twodiode lumped circuit (see Fig. 1) [3]-[7]. The corresponding mathematical formulations can differ depending on whether certain fixed values are ascribed to the diode ideality factors, or these are left as free parameters. The 1st diode is commonly attributed to Shockley-Read-Hall recombination in the quasineutral regions of the cell as well as at surfaces, whereas the 2nd diode typically represents recombination in the spacecharge region [3]. From theoretical considerations, the values n1=1 and n2=2 are often assumed for the ideality factors of the diodes. Junction recombination has been shown to be negligible in the case of crystalline-Si cells [8], so a one-diode model is sufficient [1]. The ideality factor is allowed to differ from unity [1], [9]; however another textbook silently assumes it equal to 1 regardless of the type of PV technology used [2]. Injection-level dependency of either bulk or surface
2
recombination was shown to result in ideality factors much higher than 1 for practically all polycrystalline-Si cells [8], as well as for some monocrystalline-Si cells [10] (but only for parts of the I-V curve). Values between 1.00 and 1.46 were recently obtained by Kim and Choi [11] for different commercial PV modules. The ideality factor, together with the series resistance RS, affects the slope of the I-V curve between MPP and open circuit, and is therefore important for MPPT and inverter design and operation. Fig. 2 shows ideality factor results obtained in an earlier work [12] for PV modules made by Q-Cells from two different types of polycrystalline-Si feedstock. Surprisingly, the module based on feedstock produced from a metallurgical route shows a more ‘ideal’ behavior than the one based on classic polycrystalline-Si. Standard screen-printed cell technology has been used in both modules.
TABLE I PRELIMINARY RESULTS FOR IDEALITY FACTOR AND SERIES RESISTANCE FOR 8 WAFER-BASED SI PV MODULES TESTED AT THE UNIVERSITY OF AGDER Module Type, Cell Size, Number of Cells Aged mono-Si, 12.5×12.5 cm2, 36 cells Back-contact mono-Si, 12.5×12.5 cm2, 32 cells Mono-Si, 15.6×15.6 cm2, 72 cells Poly-Si, 15.6×15.6 cm2, 72 cells Poly-Si 2, 15.6×15.6 cm2, 60 cells Poly-Si 2, 15.6×15.6 cm2, 60 cells HIT, ~50 cm2 (Honeycomb), 240 cells Aged poly-Si, 10×10 cm2, 36 cells
n 1.108(50) 1.295(25) 1.239(21) 1.386(25) 1.207(27) 1.180(23) 1.401(25) 1.326(81)
RS [Ω] 0.350(30) 0.160(10) 0.360(11) 0.470(15) 0.301(12) 0.325(11) 0.428(15) 0.360(84)
III. METHODS The standard one-diode cell model (Fig. 1 without the 2nd diode, D2) can be easily adapted to modules, assuming that each module consists of NS series-connected cells that are nearly identical in terms of their parameters [12]. The corresponding equation for the module’s I-V curve then reads
I(V ) = I L − I P − I D = IL −
Fig. 2. Evolution of the ideality factor of two polycrystallineSi PV modules in the course of a sunny day [12]. The values are extracted from I-V curves recorded at irradiances above 400 W/m2. A more recent PV test station at the University of Agder includes several different types of wafer-based Si modules, two of these aged. Table I lists preliminary results for each module’s ideality factor and series resistance obtained by the method described in [12]. Standard deviations appear in brackets. Looking at the ideality factors alone, one cannot distinguish between the different materials and technologies. All ideality factors are definitely larger than 1. Note that the values of the resistances include some 20-30 m of 6-mm2 solar cables linking each module to its electronic load. The shunt resistance RP in Fig. 1 is another idealization which is in focus in this study. It has been shown that a deviation from the principle of superposition takes place at cell voltages below about 0.4 V which affects most crystalline-Si cells [13], [14]. Its manifestation in the I-V curve is irradiance-dependent, and is very similar to a shunting of the p-n junction (affecting the slope near short circuit as well as at intermediate cell voltages). Accounting for this dependency has been shown to improve the modeling accuracy [15].
⎛ V + IRS ⎞ V + IRS − I01 exp ⎜ ⎟ RP ⎝ n1 N SVT ⎠
(1)
where IL is the photogenerated current, IP is the shunt current flowing through the module’s shunt resistance RP; ID is the diode current; I01 and n1 are the reverse saturation current and the ideality factor of the diode, respectively; and VT=kT/q is the thermal voltage which is proportional to the absolute cell temperature T at the p-n junction. Note that (1) skips a negligible term in ID, namely –I01, which is typically of order well below 10–6 A [11], [12]. IL is proportional to irradiance (with only a weak temperature dependency), and is assumed constant with voltage [1]. For the modules studied in this paper, NS=60.
Fig. 3. Exponential fit of an RS-corrected I-V curve of a polycrystalline-Si PV module. The higher-voltage part of the curve is fitted. The higher-current part of the plot is given. An outdoor test installation described in [16] is used to obtain illuminated, non-shaded I-V curves of 2 polycrystalline-Si PV modules. The value of module’s
3
apparent parallel resistance, RP, is obtained by applying a linear fit of the lower-voltage part of the I-V curve. The value of the module series resistance, RS, is extracted from each I-V curve using a method presented in earlier works [12], [17]. Series-resistance corrected I-V curves are created by plotting the current I over V+IRS. The higher-voltage part of such a curve is very accurately fitted (in Matlab) with an exponential function of V+IRS accounting only for the first and the third term in (1) (see Fig. 3). The difference IP between the fitted current and the measured current should therefore correspond to the current through the shunt resistance as modeled by the 2nd term in (1). IP is plotted over V+IRS in order to check if it truly has an Ohmic nature as assumed in the widely used standard model.
superposition principle [13] outlined in Section II, and by-pass diodes activation due to slight photocurrent mismatch between the cells comprising the module, as shown in [17]. This behavior of the apparent shunt current is seen at all irradiance levels relevant for photovoltaic power generation.
IV. RESULTS AND CONCLUSION Fig. 4. gives the irradiance dependence of the apparent shunt resistance of one of the modules studied for lower irradiance values. At very low irradiances, the value increases dramatically. This is consistent with the findings in [13] and [15] discussed in Section II. Fig. 5. The difference IP between the fitted current, IFIT, and the measured current, I, plotted over the RS-corrected voltage.
Fig. 4. Apparent shunt resistance RP over irradiance for a polycrystalline-Si PV module. Fig. 5 shows the difference IP between the fitted current, IFIT (corresponding to IL–ID), and the measured current I. The standard model predicts a straight line crossing the origin of the coordinate system, assuming an Ohmic nature of RP. Such a behavior is approximated by only part of the curve (corresponding to cell voltages below 0.33 V). From this region, an approximate value of 0.25 kΩ can be inferred for the apparent shunt resistance RP. By-pass diode interference is seen near short circuit, whereas IP drops quickly to negligible values at higher voltages. In the latter part of the plot, some noise in the I-V curve is also visible. A similar behavior of IP is seen for the other I-V data sets. It is thus confirmed that the slope of the I-V curve at lower and intermediate voltages does not result from Ohmic shunting of the p-n junctions alone; it is dominated by other effects. Possible candidates are a deviation from the
It is therefore now shown that RP can be completely excluded from the cell model for voltages above roughly 0.45 V. This exact voltage-level may differ for different cell temperatures and different crystalline-Si technologies, but this is not further analyzed in the present study. Textbook descriptions on RP-effects are partially misleading in that they give a wrong I-V curve shape at higher voltages since they do not consider the voltage-dependency of RP (e.g. [1], [2]). This particularly affects the MPP region. The wrong assumption of a relatively low, constant RP can in addition lead to an underestimation of the maximum power of the modeled PV device. The region between the MPP and open circuit may be modeled without any parallel resistance. However, the slope of the I-V curve between the knee and short circuit must be properly accounted for, if a physically realistic simulation is needed. This can possibly be achieved by using a voltagedependent resistance RP(V) in the circuit simulation software. V. REFERENCES [1] [2] [3] [4] [5] [6]
J. L. Gray, “The physics of the solar cell”, in Handbook of photovoltaic science and engineering, A. Lique and S. Hegedus, Eds., Chichester: John Wiley & Sons Ltd., 2003, pp. 61-112. S. A. Kalogirou, Solar Energy Engineering, Burlington: Elsevier, 2009, p. 477. J. Appelbaum, A. Chait, and D. Thompson, “Parameter estimation and screening of solar cells”, Prog. Photovolt. Res. & Apps. vol. 1 pp. 93106, Feb. 1993. H. Müllejans, J. Hyvärinen, J. Karila, and E. D. Dunlop, “Reliability of the routine 2-diode model fitting of PV modules”, Proc. 19th European Photovoltaic Solar Energy Conf., 2004, pp. 2459-2462. J. Hyvärinen and J. Karila, “New analysis method for crystalline silicon cells”, Proc. 3rd World Conf. on Photovoltaic Energy Conversion, 2003, vol. 2, pp. 1521-1524. S. Coors and M. Böhm, “Validation and comparison of curve correction procedures for silicon solar cells”, Proc. 14th European Photovoltaic Solar Energy Conf., 1997, vol. 1, pp. 220-223.
4 [7]
[8]
[9] [10]
[11] [12] [13] [14] [15] [16]
[17]
J.-P. Charles, G. Bordure, A. Khoury, and P. Mialhe, “Consistency of the double exponential model with the physical mechanisms of conduction for a solar cell under illumination”, J. Phys. D: Appl. Phys., vol. 18, pp. 2261-2268, Nov. 1985. D. Macdonald and A. Cuevas, “Reduced fill factors in multicrystalline silicon solar cells due to injection-level dependent bulk recombination lifetime”, Prog. Photovolt. Res. & Apps., vol. 8, pp. 363-375, Jul./Aug. 2000. Photovoltaic Devices, Part 5: Determination of the Equivalent Cell Temperature (ECT) of Photovoltaic (PV) Devices by the Open-circuit Voltage Method, IEC, International Standard 904-5, 1st Ed., 1993. A. G. Aberle, S. J. Robinson, A. Wang, J. Zhao, S. R. Wenham, and M. A. Green, “High-efficiency silicon solar cells: Fill factor limitations and non-ideal diode behaviour due to voltage-dependent rear surface recombination”, Prog. Photovolt. Res. & Apps., vol. 1, pp. 133-143, Feb. 1993. W. Kim and W. Choi, “A novel parameter extraction method for the one-diode solar cell model”, Solar Energy, vol. 84, pp. 1008-1019, June 2010. G. H. Yordanov, O.-M. Midtgård, and T. O. Sætre, “Two-diode model revisited: Parameters extraction from semi-log plots of I-V data”, Proc. 25th European Photovoltaic Solar Energy Conf., pp. 4156 – 4163, 2010. S. J. Robinson, A. G. Aberle, and M. A. Green, “Departures from the principle of superposition in silicon solar cells”, J. Appl. Phys., vol. 76, pp. 7920-7930, Dec. 1994. P. P. Altermatt, “Silicon solar cells”, in Optoelectronic devices, J. Piprek, Ed., 2005, DOI: 10.1007/0-387-27256-9_11, pp. 313-341. A. Mermoud and T. Lejeune, “Performance Assessment of a Simulation Model for PV Modules of Any Available Technology”, Proc. 25th European Photovoltaic Solar Energy Conf., pp. 4786 – 4791, 2010. G. H. Yordanov, O.-M. Midtgård, T. O. Sætre, J. O. Odden, T. Buseth, A. G. Imenes, C. L. Nge, and L. Norum, “Compensated SoG-Si from a metallurgical route: High latitude outdoor performance”, Proc. 25th European Photovoltaic Solar Energy Conf., pp. 4289-4293, 2010. G. H. Yordanov, O.-M. Midtgård, and T. O. Sætre, “Extracting parameters from semi-log plots of polycrystalline silicon PV modules outdoor I-V data: Double-exponential model revisited”, in Proc. 35th IEEE Photovoltaic Specialists Conf., pp.2756-2761, 2010.
VI. BIOGRAPHIES Georgi Hristov Yordanov was born in Ruse, Bulgaria, on August 24, 1974. He graduated from the University of Sofia, Bulgaria, in 1999, and is now a PhD student at the Norwegian University of Science and Technology (NTNU). Yordanov has been a research fellow at the University of Agder, Norway, since 2008. His employment history includes the Bulgarian Academy of Sciences. His special fields of interest include photovoltaics and electric vehicles. Ole-Morten Midtgård (M’2004) was born in Tromsø, Norway, on March 20, 1967. He graduated from the Norwegian Institute of Technology in 1992, and obtained a PhD in Electrical Power Engineering from the Norwegian University of Science and Technology (NTNU) in 1997. Midtgård has been a professor at the University of Agder, Norway, since 2004. His previous work experience includes 6 years with ABB in Norway. His research interests include end use of photovoltaic technology and electromagnetic modeling.