May 1, 2011 - The risk of emergencies is one of the risks that any business ...... Facebook page was regarded by respondents as a very effective use of social ...
Planning, building and insuring: Adaptation of built environment to climate change induced increased intensity of natural hazards Final Report David King, John Ginger, Stewart Williams, Alison Cottrell, Yetta Gurtner, Cam Leitch, David Henderson, Nandana Jayasinghe, Peter Kim, Kate Booth, Carl Ewin, Kenneth Innes, Keith Jacobs, Marianne Jago-Bassingthwaighte and Luke Jackson
� Planning, building and insuring: Adaptation of built environment to climate change induced increased intensity of natural hazards James Cook University
AUTHORS: David King, James Cook University John Ginger, James Cook University Stewart Williams, University of Tasmania Alison Cottrell, James Cook University Yetta Gurtner, James Cook University Cam Leitch, James Cook University David Henderson, James Cook University Nandana Jayasinghe, James Cook University Peter Kim, James Cook University Kate Booth, University of Tasmania Carl Ewin, James Cook University Kenneth Innes, James Cook University Keith Jacobs, University of Tasmania Marianne Jago-Bassingthwaighte, James Cook University Luke Jackson, James Cook University
� �
Published by the National Climate Change Adaptation Research Facility 2013 ISBN: 978-1-921609-75-6 NCCARF Publication 05/13 Australian copyright law applies. For permission to reproduce any part of this document, please approach the authors. Please cite this report as: King, D, Ginger, J, Williams, S, Cottrell, A, Gurtner, Y, Leitch, C, Henderson, D, Jayasinghe, N, Kim, P, Booth, K, Ewin, C, Innes, K, Jacobs, K, Jago-Bassingthwaighte, M & Jackson, L 2013, Planning, building and insuring: Adaptation of built environment to climate change induced increased intensity of natural hazards, National Climate Change Adaptation Research Facility, Gold Coast, 361 pp. Acknowledgement This work was carried out with financial support from the Australian Government (Department of Climate Change and Energy Efficiency) and the National Climate Change Adaptation Research Facility. The role of NCCARF is to lead the research community in a national interdisciplinary effort to generate the information needed by decision-makers in government, business and in vulnerable sectors and communities to manage the risk of climate change impacts. Disclaimer The views and opinions expressed in this publication are not necessarily the views of the Commonwealth, and the Commonwealth does not accept responsibility for any information or advice contained herein. Cover image: © Max Riethmuller
� �
Table of Contents 1.� EXECUTIVE SUMMARY ........................................................................................ 1� 2.� INTRODUCTION TO THE RESEARCH PROJECT ............................................... 3� 2.1� Objectives of the research ................................................................................ 4� 2.2� Development of the research design ................................................................ 6� 2.3� Methodology ..................................................................................................... 7� 3.� NATURAL HAZARDS, CLIMATE CHANGE AND DISASTER MANAGEMENT IN AUSTRALIA: A LITERATURE REVIEW ..................................................................... 10� 3.1� Natural Hazards and Climate Change ............................................................ 10� 3.2� Disaster Management in Australia .................................................................. 15� 4.� LAND USE PLANNING: METHODS ................................................................... 24� 4.1� Survey method: Planners, Hazards and Adaptation ....................................... 24� 5.� LAND USE PLANNING: CASE STUDIES ........................................................... 30� 5.1� Case Study (1): Storm Surge Adaptation: Community Perspectives in The Mission Beach Area ................................................................................................. 30� 5.2� Storm Surge Influence on the Mission Beach area ........................................ 55� 5.2� Case Study (2): Residents’ Perceptions about Adapting the Residential Built Environment to Riverine Flooding in Brisbane (January 2011)................................ 76� 5.3� Case Study (3): Planning Review of QLD Flood Commission of Inquiry Report Recommendations ................................................................................................. 100� 6.� BUILDING CODES ............................................................................................. 147� 6.1� Climate Change and the Built Environment – Housing to Resist Wind Loading 147� 6.2� Methodology ................................................................................................. 168� 6.3� A Case Study Approach ............................................................................... 181� 6.4� Conclusions .................................................................................................. 195� 7.� INSURING: BUSHFIRES IN RELATION TO BUILDING AND PROPERTY INSURANCE IN TASMANIA...................................................................................... 199� 7.1� Literature Review.......................................................................................... 199� 7.2� Case Study: Bushfires in relation to Building and Property Insurance in Tasmania ............................................................................................................... 215� 8.� INTEGRATION AND DISCUSSION ................................................................... 235� 8.1� Discussion .................................................................................................... 235� 8.2� Recommendations........................................................................................ 244� 9.� REFERENCES .................................................................................................... 248� 10.� APPENDICES ..................................................................................................... 270� 10.1� Project Workshop: NCCARF Climate Change Adaptation Research Grants Program - Adaptation of Built Environment to Climate Change Induced Increased Intensity of Natural Hazards .................................................................................. 270� 10.2� Planning Case Study 3 - Planner Survey Questionnaire: The impact of natural hazards on land use planning ................................................................................ 296� 10.3� Planning Case Study 3: Planner Survey Questionnaire - The impact of natural hazards on land use planning - Answers to Open Ended Question. ..................... 308� 10.4� Planning: Machans Beach Case Study. ...................................................... 313� 10.5� Building - Windstorms damage to houses in Australia ................................. 353� 10.6� Insuring: Case Study, Insurer Survey ........................................................... 357� 10.7� List of Acronyms ........................................................................................... 358� 10.8� Glossary ....................................................................................................... 360�
Planning,�building�and�insuring���i� �
List of Figures Figure 3.1.1 The Risk Triangle .............................................................................................. 15 Figure 5.1.1 A sea wall built at Machans Beach, Cairns - a protective strategy ................... 34 Figure 5.1.2 Elevating coastal infrastructure, an accommodative strategy ........................... 35 Figure 5.1.3 North Mission Beach, Queensland ................................................................... 39 Figure 5.1.4 Wongaling Beach, Queensland ........................................................................ 40 Figure 5.1.5 South Mission Beach, Queensland ................................................................... 41 Figure 5.1.6 Tully Heads - devastated by the Cyclone Yasi storm surge ............................. 46 Figure 5.1.7 Natural Risk & Hazards Overlay – Storm Surge (Wongaling Beach) ............... 50 Figure 5.1.8 Natural Risk & Hazards Overlay – Storm surge (South Mission Beach) .......... 51 Figure 5.1.9 Age Profile of Research Participants at Mission Beach ................................... 54 Figure 5.1.10 Length of Residence of Research Participants at Mission Beach .................. 55 Figure 5.1.11 Number of household occupants/research participants Mission Beach ......... 55 Figure 5.2.1 Flood peaks since 1824. ................................................................................... 78 Figure 5.2.2 Extent of Inundation Caused by the 2011 Flood Event ................................... 80 Figure 5.2.3 Milton and West End in relation to the Brisbane River ..................................... 84 Figure 5.3.1 Sourced as “Grantham house being relocated to higher ground .................... 132 Figure 5.3.2 The same house now in place at the new location ......................................... 132 Figure 5.3.3 House at Tully Heads Destroyed in Storm Surge from Cyclone Yasi ............. 133 Figure 5.3.4 The Grantham Relocation Project Entrance Immediately Adjacent to the Edge of the Existing Grantham ........................................................................................... 134 Figure 5.3.5 Funding of Buy Back ....................................................................................... 137 Figure 5.3.6 Funding ........................................................................................................... 137 Figure 5.3.7 Council Responsibility ..................................................................................... 138 Figure 5.3.8 Buy back zoning ............................................................................................. 138 Figure 5.3.9 No Buy Back schemes .................................................................................... 139 Figure 5.3.10 Rebuilding post Disaster ............................................................................... 139 Figure 6.1.1 Wind Regions of Australia .............................................................................. 149 Figure 6.1.2 Design Gust wind speed vs Average recurrence interval – AS/NZS1170.2 .. 167 Figure 6.2.1 Reference curves for heuristic ranking process by expert group engaged through workshop activity ................................................................................................... 171 Figure 6.2.2 Attributes of housing ....................................................................................... 175 Figure 6.2.3 Probability distributions - wind load W and component resistance R ............ 180 Figure 6.3.1 Typical Pre 1980s High set house .................................................................. 182 Figure 6.3.2 Completed Masonry Block house – Post 1980s ............................................. 182 Figure 6.3.3 Elements in an idealized timber framed house ............................................... 183 Figure 6.3.4 Possible damage propagation paths for pre 1980s high-set house model ..... 185 Figure 6.3.5 Schematic diagram of a Post 1980s Masonry Block House ........................... 186 Figure 6.3.6 Post 1980s Masonry Block house under construction .................................... 187 Figure 6.3.7 Battens and trusses in masonry block house ................................................. 188 Figure 6.3.8 Truss to wall connection ................................................................................. 188 Figure 6.3.9 Batten to truss connection .............................................................................. 189 Figure 6.3.10 Roof cladding to batten connections ............................................................. 189 Figure 6.3.11 Vulnerability curve of pre 1980s houses for increasing wind speeds with and without internal pressure .............................................................................................. 190 Figure 6.3.12 Vulnerability curve of post-1980s contemporary houses for increasing wind speeds with and without internal pressure ................................................................. 191 ii����������Planning,�building�and�insuring� �
Figure 6.3.13 Vulnerability curves for pre-1980s and post 1980s houses with increasing return period ........................................................................................................................ 192 Figure 6.3.14 Estimated damage from wind loads to houses with different structural adaptation measures ........................................................................................................... 193 Figure 6.3.15 Typical design wind speed versus return period ........................................... 194 Figure 7.1.1 Bushfire seasons across Australia .................................................................. 200 Figure 7.1.2 Climate zones of Australia according to BCA.................................................. 202 Figure 7.1.3 Layout for building in a bushfire prone area .................................................... 209 Figure 8.1.1 Sectors of the Built Environment and Levels of Governance .......................... 236 List of Tables Table 2.1.1 Case Study Approaches and Scales .................................................................... 8 Table 2.1.2 Adaptation Options ............................................................................................... 9 Table 3.1.1 Typology of Australia’s Natural Hazards ............................................................ 10 Table 5.2.1 Brisbane Land Use Planning Triggered by Flood Events ................................... 81 Table 5.3.1 Flood related disaster planning legislation and policy in Australia ................... 101 Table 5.3.2 Planners’ Survey: Flood Studies and Floodplain Management ........................ 108 Table 5.3.3 Use of Q100 ..................................................................................................... 110 Table 5.3.4 Effectiveness of Q100 ...................................................................................... 110 Table 5.3.5 SPA and State Planning Policies...................................................................... 113 Table 5.3.6 Planning Provisions .......................................................................................... 117 Table 5.3.7 Property Impacts .............................................................................................. 119 Table 5.3.8 Land Uses, Infrastructure and Levees.............................................................. 124 Table 5.3.9 Evacuation, Flash Flood and Housing Issues .................................................. 127 Table 5.3.10 Responses of Planners to Buy Back Issues. .................................................. 135 Table 5.3.11 Consensus Issues .......................................................................................... 140 Table 6.1.1 Bureau of Meteorology Cyclone Categories ..................................................... 150 Table 6.1.2 Annual Probability of Exceedance for Wind Strength Design........................... 153 Table 6.1.3 Flood Action Combination Factors ................................................................... 156 Table 6.1.4 Bushfire Attack Levels ...................................................................................... 158 Table 6.2.1 Categorization of residential building stock derived from expert workshop consultation ......................................................................................................................... 171 Table 6.2.2 House categories in cyclone regions of North Queensland.............................. 176 Table 6.2.3 Generalised examples of housing construction types ...................................... 177 Table 7.1.1 Most costly types of natural disaster 1967-1999 by state and territory ............ 201 Table 7.1.2 Bushfire fatalities per state 1900-2008 ............................................................. 203 Table 7.1.3 Most significant Australian bushfires since 1900 .............................................. 203
Planning,�building�and�insuring���iii� �
ABSTRACT This project examines the likely impacts on the built environment of increased intensities in weather-related natural hazard events, in order to identify the possibilities of using the regulatory mechanisms of building construction, housing and planning in climate change adaptation. The research findings are restricted to these three aspects of the built environment, and further concentrated on adaptation responses that may be required in mitigation of the impacts of three types of hazards; tropical cyclones, floods and bushfires. Adaptation of the built environment to climate change is predicated on scenarios, especially those collated by the Intergovernmental Panel on Climate Change, that suggest increases in the impacts of natural hazards as a consequence of global warming. This project took a case study approach to understanding the adaptation of the built environment to anticipated increased challenges of natural hazards in the climate change context. Where the market operates on short-term gains, such as where development continues in high risk location, mechanisms are needed to ensure that new property developments and infrastructure are constructed in a risk appropriate manner consistent with local hazards. Three research groups collaborated to examine a range of responses in planning, building, and insurance practice and legislation that may be required as adaptation to climate change induced natural hazards.
iv����������Planning,�building�and�insuring� �
1. EXECUTIVE SUMMARY The complexity and social and economic importance of the built environment requires focussed governance to develop adaptation and hazard mitigation for community resilience to climate change and to predicted extreme events. Where issues of adaptation and hazard mitigation impact public safety, they are best tackled through legislation, codes and policy. Planning Planning research focussed on a scenario of greater numbers and intensities of floods as a consequence of climate change, such that the research plan was strongly influenced by the flood events of 2011. Recommendations of the Queensland Floods Commission of Inquiry (2012) that relate to land use planning responses to increased flooding were analysed. Many recommendations of the Inquiry propose sensible improvements that will mitigate the impact of natural hazards, but research highlighted responses that may be difficult to implement or that may be contested. There was strong support from planners in four key areas of Inquiry recommendations: whole of catchment flood mapping; climate change adaptation as a component of hazard mitigation; creation of zones of limited or constrained development; and planning for flash flooding. There is no consensus among planners on the desirability of some recommendations; especially on land swaps, retreat, levees, and defined flood levels. The Queensland State planning Policy ‘Mitigating the Adverse Impacts of Flood, Bushfire and Landslide’ has not been effective. Hazard mitigation and adaptation through land use and development planning must be incorporated into primary planning legislation. Building The resilience of houses to natural hazards such as windstorms, floods and bushfires can be improved by revising regulations (BCA) and design standards. Revisions to design and construction standards have resulted in post-80s houses being more resilient to windstorms compared to pre-80s houses built in cyclonic regions of Australia. Structural upgrading is effective in reducing the vulnerability of non-engineered pre-80s houses. Structural upgrading and the provision of building envelope protection against windborne debris (preventing the formation of a dominant opening that generates large internal pressure) are two strategies that will also reduce the vulnerability of houses, including post-80s houses built in non-cyclonic regions. This is an adaptation strategy that would also be effective for any shift in cyclone boundaries or increases in wind loads that may result from climate change.
Planning,�building�and�insuring�����������1� �
Education to improve the house-building process (regulation, design, construction, certification and maintenance) aimed at all parties (designer, builder, certifier, and owner) will enhance community resilience. Insuring Having insurance is not always a priority, or even an option, for all. In addition to significant rates of non-insurance and underinsurance, there is expectation of declining insurance availability and affordability in a changing climate. This will especially impact low-income earners. Insurance has little role at present in encouraging climate change adaptation measures, including risk mitigation. The role for insurance here is currently understood in terms of recovery not preparedness, and there is limited interest in using insurance to initiate innovation in climate change adaptation despite some engagement by insurers with the issues. The capacity of insurance to have a key role in climate change adaptation and associated risk mitigation is constrained by limitations in governance. Tensions over the roles and responsibilities for managing risks exist between the community and individuals, and between the public and private sectors, with inconsistencies amongst agencies and different levels of government exacerbated by a lack of leadership. Recommendations for policy, good practice and legislative development have been placed at the end of this report. Structure of this Monograph Following the introduction to the research project, its three main components of planning (chapters 3-5), building (chapter 6) and insuring (chapter 7) are each presented as separate entities in this report. Readers will most likely be more interested in one or other area, hence the decision to maintain each study’s integrity. In relation to each of planning, building and insurance there is a literature review, followed by a methodology of the research, and then the case study or case studies, and finally a conclusion. Following these research findings is an integration and discussion chapter (chapter 8) that brings together findings from each of the research studies. The discussion leads into the recommendations that may form the basis for policy papers. These are the primary conclusion of the monograph. All references from all chapters have been collated into a single reference list. There then follows an appendix which contains additional case study materials and details of the stakeholder workshop.
2����������Planning,�building�and�insuring� �
2. INTRODUCTION TO THE RESEARCH PROJECT This project examines the likely impacts on the built environment of increased intensities in weather-related natural hazard events, in order to identify the possibilities of using the regulatory mechanisms of building construction, housing and planning in climate change adaptation. The research findings are restricted to these three aspects of the built environment, and further concentrated on adaptation responses that may be required in mitigation of the impacts of three types of hazards; tropical cyclones, floods and bushfires. Adaptation of the built environment to climate change is predicated on scenarios, especially those collated by the Intergovernmental Panel on Climate Change (IPCC 2012), that suggest increases in the impacts of natural hazards as a consequence of global warming. Specifically the predictions are that there will be an increase in the severity and frequency of flood and bushfire events. A less certain scenario concerns tropical cyclones, suggesting that there may even be fewer overall, but that there may be an increase in the intensity of severe cyclones. Storm surge impact will probably increase in any case, even if cyclones are less frequent, simply as a consequence of sea level rise. Global warming (IPCC 2012) may also extend the cyclone hazard areas outside the existing cyclone vulnerability zones. Each of the three research groups provides a literature review as an introduction to the case studies in which the climate change literature is discussed, particularly emphasising the hazards and scenarios of climate change on which each group concentrated. Increased heat and heatwaves are also predicted to increase as global warming occurs. However, this research project did not address this hazard, because of time and resource limitations to a short term project of this kind, but we recognise that increased heat will present challenges to adaptation of people and their settlements. The project was developed from the National Climate Change Adaptation Research Plan for Emergency Management research priority 4.2.3. The Research Plan identified potential research projects that target assessment of the efficacy of collaborative practices that are already occurring, such as cooperative emergency management planning and whether regulation may be needed to encourage better long-term planning for the impacts of climate change. Where the market operates on short-term gains (for example, development is continuing in high risk locations such as flood prone land, low lying coastal and bushfire prone areas, because land and property sales provide revenue for local governments) mechanisms are needed to ensure that new property developments and infrastructure are constructed in a risk appropriate manner consistent with local hazards. This challenge was identified in the 2002 COAG review of natural disasters that stressed the problem of repeated infrastructure damage and losses. The review also put hazard mitigation responsibility on all levels and sectors of government and stakeholders. Three research groups with experience investigating the built environment and the impact of natural hazards collaborated to examine a range of responses in planning, building, and insurance practice and legislation that may be required as adaptation to climate change induced natural hazards. The three research groups are the Centre for Planning,�building�and�insuring�����������3� �
Disaster Studies, the Cyclone Testing Station, both of James Cook University, and Department of Geography and Environmental Studies together with the Housing and Community Research Unit at the University of Tasmania. The Centre for Disaster Studies researchers are strongly connected with the Centre for Tropical Urban and Regional Planning (both in the School of Earth and Environmental Sciences) which coordinates the teaching of accredited planning degrees, thereby requiring professional membership of the Planning Institute of Australia. Research in the centre has focussed on social impact of hazards, community resilience and increasingly the roles and responsibilities expected of planners. The Cyclone Testing Station grew out of the same research group as the Centre for Disaster Studies in the 1970s and comprises engineers who specialise in wind-loading. The station has a long reputation of research excellence in this specialist area and brought extensive knowledge to this project. Researchers at the University of Tasmania brought together skills in human geography and sociology with application in housing policy and planning research. They are variously involved in the teaching of planning degrees accredited through the Planning Institute of Australia, and conducting research in areas relevant to their membership in the Australian Housing and Urban Research Institute.
2.1 Objectives of the research The Objectives of the research project were to: (a) examine the likely impacts of increased intensities of weather-related natural hazards on the built environment ; (b) identify adaptations of key regulatory mechanisms (building codes, land-use planning and housing insurance) and industry best practice through building construction, housing and planning; (c) address the gap in knowledge through an all hazards approach to building design, land use planning and building stock, using case studies in each sector to facilitate a proactive approach that will link practice to policy; and (d) make recommendations for adaptations to meet changing hazard threats within the emergency management preparations and responses of diverse agencies and organisations responsible for the built environment. To address the research objectives the project performed the following tasks: (a) analysis of the impact of climate change models on the built environment, involving a review of the existing regulatory mechanisms (including building codes, land-use planning and housing insurance) and their effectiveness; (b) analysis of adaptive capacity to predicted changes that will impact the built environment, identifying areas of existing practice and the capacity of regulatory mechanisms to deal with future scenarios - identification of gaps between scenarios of change and existing practice have generated policy recommendations for future response; (c) the project identifies hazard planning processes and attitudes of land use planners and developers to both the known hazard zones and perceptions of 4����������Planning,�building�and�insuring� �
climate change impacts and uncertainty in general; (d) the CDS identified acceptable and feasible regulatory features within planning legislation that can enhance adaptation to future threats and uncertainties; (e) the project examined current best practice and regulatory mechanisms against the background analysis of scenarios for climate change induced increased intensities and occurrence of tropical cyclones, floods and bushfires (each of the three participating research organisations took responsibility for specific areas of land use planning, building codes and household insurance); (f) a categorisation of houses into specific types based on their location, age, construction methods and materials, dimensions and envelope (i.e. window and door sizes) in order to assess their vulnerability to windstorms (and by extension to potential for increasing damage due to higher wind speeds resulting from climate change); (g) the Cyclone Testing Station (CTS) presented the engineering methods based on reliability techniques applied to critical structural elements and the predicted wind loads; (h) the CTS full scale house test data was utilised to produce models that predict damage with increasing wind speed - these outcomes are used to recommend decisions on the adaptation strategies to be used for a mix of house types in given locations, for a predicted wind climate; (i) the CTS studied the vulnerability of two case study house types to wind hazard by defining the structural form of each house type - data on house structural elements and connection type and strength and critical components and connections that are associated with failure were assessed; (j) the CTS further assessed the strength distribution of critical components for the building population along with the wind loads on components and their variability for increasing wind speeds - the CTS model predictions are verified using available house damage data; (k) the results from the above analysis used on a mix of houses in a particular region (i.e. selected postcodes within a township in the TCCIP) estimates the extent and type of damage for specified events (i.e. spatial and temporal variation of wind speed) - such an analysis takes account of the track of the storm event and progressive damage to the housing stock with respect to the track; (l) the University of Tasmania (UTAS) component looked at insurance as an under-utilised regulatory mechanism in relation to housing - this included reviewing the relevant disaster mitigation tools and identifying new opportunities for their use, while also examining key drivers and barriers to their uptake in policy and practice by the public and private sectors; (m) a literature review identified and evaluated key regulatory mechanisms for disaster mitigation in housing provision; (n) interviews were conducted with key informants from government departments, housing, state emergency services, the property and insurance councils, and Planning,�building�and�insuring�����������5� �
the construction and insurance industries, and examine specific case studies were examined in relation to the different hazard types and events; (o) the project identifies the most effective statutory, market and policy instruments (including insurance amongst other mechanisms), configured for the successful strategic implementation of natural hazard mitigation for housing and climate change adaptation, with emphasis on the drivers and barriers to their uptake in policy and practice - this included holding a seminar/workshop for key stakeholders on current practice; (p) the findings of the research have been presented through reports and seminars and specifically a plone site that contained all materials and was available to the stakeholder reference group consisting of government personnel and agency staff, thereby facilitating networks between researchers and practitioners; (q) a workshop brought together all project stakeholders involved with the three components of the research, so that specific findings and recommendations were communicated. The crossover and connections between these sectors enhanced understanding of adaptive capacities and policy and regulatory directions. (Stakeholders included representatives from Emergency Management Queensland, the Bureau of Meteorology, Housing Tasmania, Tasmania Fire Service, Townsville City Council, GeoScience Australia, Australian Building Standards Board and NCCARF). A stakeholder reference group was convened at the beginning of the project. An initial larger group of interested parties was reduced through work commitments to a smaller core group.
2.2 Development of the research design One component of the original application, and of the schedule of tasks derived from it, has been modified in task (o) above. The original research plan was to develop best practice guides in each of the areas of the project. This was agreed to be an appropriate outcome at the time of writing the application document in 2009. On reaching the conclusion of the activity the researchers are agreed that we have moved beyond best or good practice. The events of 2011 transformed the disaster context, especially in Queensland, and correspondingly influenced the direction of the research project and its conclusion. In the planning area, the Queensland Reconstruction Authority has produced a series of toolkits aimed at floodplain management for local government, as well as a series of floodplain maps with associated guidelines. In the cyclone/surge area the QRA worked with the CTS, a research partner to this report, to produce guidelines for housing reconstruction in the storm surge devastated communities of Tully and Hull Heads. The 2011 wet season has already generated a number of well-funded practice guides, covering some of the issues that were anticipated to come out of this research. More significantly however, the events of 2011 that contributed to our research findings has led to an overall conclusion that best or good practice is not an adequate approach in the area of public safety. Best practice is voluntary. We conclude that legislative and policy changes are the most appropriate way forward. Thus we have concluded with a
6����������Planning,�building�and�insuring� �
series of targeted policy recommendations that can be framed as policy papers rather than best practice guides.
2.3 Methodology This project took a case study approach to understanding the adaptation of the built environment to anticipated increased challenges of natural hazards in the climate change context. A ‘case study’ can refer to the unit of analysis which is how it is used in the individual case studies that constitute various sections of this report, or it can be considered a research method. For the project overall, ‘case study’ refers to the methods used to consider particular phenomena in their actual context (Stake 1995, Yin 2002). Case studies can use a variety of approaches - positivist, interpretive, or critical, depending upon the underlying philosophical assumptions of the researchers (Stake 1995, Walsham 1993, Yin 2002). For this project, the research methods varied. For the case study on building codes, a variety of quantitative measures predominate. For the planning case studies, a variety of methods were used: literature reviews, document analysis, in-depth interviews, semi-structured surveys, and a structured online survey. The methods for the insurance case study were primarily literature reviews, document analysis as above and in-depth interviews. Details are provided within each case study. The overall view of the case studies is demonstrated in the following table 2.1.1. The building codes study focussed on tropical regions, the land use planning studies focussed on the tropics and the subtropics, and the insurance study focussed on temperate regions. Nevertheless, each study has relevance in the other climatic zones. The order of presentation of the case studies is on the basis of scale. Land use planning is first, on the basis of its large scale, building codes are considered next because they apply at a mid-scale, and insurance is considered last only on the basis of its application at the household level. These studies contribute to a broad understanding of the complexities that exist both within and between land use planning, building codes and insurance as they play out variously and offer opportunities as well conflicts at all scales.
Planning,�building�and�insuring�����������7� �
Table 2.1.1: Case Study Approaches and Scales Case Study Approach Wind Event Cyclone High Wind Events /Storms
Tropical Case Study – CTS Codes Standards Regulations Specifications Damage implications Building stock Losses
Water Event
Sub-Tropical
Extend hazard implication across all regions
Case Study – CDS Land use planning Risk zoning Development planning Design Infrastructure Perceptions/views
Storm Surge Inundation Flood
Fire Event Bushfire Fire Storm Extreme Fire Weather
Temperate
Extend hazard implication across all regions
Case Study – UTAS Insurance Policy Drivers/barriers Land use planning Building stock
In addition to being related through the different levels of scale, the three major case studies – planning, building, insuring – are linked through their contributions to discussion (Metz et al 2000) of adaptation options – autonomous, protect, accommodate and retreat. Table 2.1.2 below is adapted from multiple sources. It lists the range of responses that fall within each of the four adaptation options.
8����������Planning,�building�and�insuring� �
Table 2.1.2: Adaptation Options AUTONOMOUS Do nothing
PROTECT Defensive barriers
Spontaneous
Hard structural options
Reactive
Soft structural options
ACCOMMODATE Emergency planning Ͳ Early warning Ͳ Evacuation systems Hazard insurance
Modification of land use and agricultural practice
Automatic
Modification of building styles and codes
Natural
Strict regulation of hazard zones Improved drainage Community education Public participation Insurance
Passive Responsive Apathetic
RETREAT Increasing or establishing setback zones Relocating threatened structures Phased-out or no development in susceptible areas Managed realignment (constraints and leases) Creating upland buffers Withdraw Abandon Property buy-back Prohibition of development Migration Insurance withdrawal
(Source: Metz et al. 2000, p.432) This notion of adaptation options originated with strategies/recommendations regarding coastal shoreline management in the context of adaptation to climate change, particularly with respect to predicted, accelerated sea level rises. When discussing policy options for coastal communities in the eastern USA, Titus (1991) identified protection and managed retreat, deciding that the costs were high, but not unacceptable. Gilbert and Vellinga (1991) outlined adaptive responses as being protect, accommodate and retreat (PAR), and elaborated on PAR implications for each of the following: Environmental implications; Economic implications; Social and Cultural implications; Legal and Institutional implications. As priorities for adaptation they identified: Science/Monitoring; Information; Planning Education; and Community Participation. In this research study we add the importance of legislation, codes and policies to strengthen adaptation strategies where voluntary uptake is lacking or weak.
Planning,�building�and�insuring�����������9� �
3. NATURAL HAZARDS, CLIMATE CHANGE AND DISASTER MANAGEMENT IN AUSTRALIA: A LITERATURE REVIEW 3.1 Natural Hazards and Climate Change Consistent with Australia’s extremely diverse geography, the continent is exposed and susceptible to a considerable range of geological and hydro-meteorological hazards. When such phenomena in the earth’s physical systems threaten loss of life or injury, property damage, social and economic disruption or environmental degradation, they are considered to be “natural hazards” (ISDR 2008). As recent climate change projections suggest increasing vulnerability of Australia’s coastal settlements and infrastructure, natural environments, primary industry and health systems to such natural hazards, the development of effective adaptation strategies recommends a better understanding of the broader context and issues.
3.1.1 Natural Hazards in Australia Despite the variety and historical preponderance of “naturally” derived hazards in Australia, the focus of attention is dominated by common, rapid-onset, high profile, events (e.g. floods, cyclones, bushfires and thunderstorms). While formal and restrictive classifications of Australia’s natural hazards have been developed to support specific policies and agendas (COAG 2004, Middleman 2007, GA 2010), many hazard events reflect complex, sequential or combined origins. Although frequently ascribed to a singular cause, hazards such as bushfire, drought and heat wave, often reveal the interaction of several factors including climate, biology, and anthropogenic pressures. To develop a thorough understanding of Australia’s natural hazards and associated risks, it is also prudent to consider latent conditions that may represent future threats (see Table 3.1.1) Table 3.1.1: Typology of Australia’s Natural Hazards Geological - Earthquake - Landslide/mudslide/rock fall - Avalanche
Hydro – meteorological - Flood - Tsunami - Cyclones - Severe weather (includes intense low pressure systems, tornadoes, storm wind gusts, dust storms, hail storms, thunderstorms, lightning) - Drought - Extreme heat - Frost - Blizzard - Extreme cold
10����������Planning,�building�and�insuring� �
Complex/latent hazards - Bushfire - Storm/tidal surge - Disease - Plague - Epidemic - Coastal/soil erosion - Meteorite strike - Volcanic Eruption
Typically, hazards are characterised by location, intensity, frequency, magnitude/scale and probability (ISDR 2008). The distribution of natural hazards in Australia varies both spatially and temporally (Middleman 2007). While some natural hazards such as severe storms have the potential to occur anywhere and at any time, spatial distribution is commonly influenced by region and topography. For example, tropical cyclones generally occur in the well-defined northern, tropical regions of Australia, while storm surges are confined to coastal regions. Topography can also influence the geographical size and spatial dispersion of a hazard. The temporal distribution of natural hazards is also influenced by a variety of factors such as frequency of occurrence, speed of onset, event duration, and seasonal weather conditions (Middleman 2007). Historical records and data can help establish precedence, susceptibility and likelihood of many common natural hazards such as floods and bushfire. However, irregular and unexpected hazards (e.g. earthquakes) can be catastrophic. Awareness and the timing element associated with a hazard event can have a direct influence on the level of community warning, preparedness and response capacity. While mitigation and adaptation strategies are frequently developed for recognised, probable events, the future spatial and temporal distribution of some natural hazards may also be affected by land use change, and climate change. The impacts associated with hazards can vary significantly. While many natural hazards are integral to sustaining ecosystem health and vitality, and have positive social benefits, direct and indirect losses include (EMA 2004b): -
loss of life; physical suffering; emotional and psychological suffering; damage to residential, commercial and industrial property; reduced productivity; degraded environment; loss of species and habitats; damaged power, transport and telecommunication infrastructure; weakened economy; loss of livelihood; destabilized community coherence (including isolation, marginalisation and displacement); destabilised political situations; and reduced quality of life.
A natural hazard is considered a disaster when it represents “a serious disruption to community life which threatens or causes death or injury in that community and/or damage to property which is beyond the day-to-day capacity of the prescribed statutory authorities and which requires special mobilisation and organisation of resources other than those normally available to those authorities.’ (EMA 2011) In general, the larger the area affected by a hazard event, the greater the number of people or communities that are likely to experience loss or disruption. However, small, localised events such as tornados and lightning strikes can also result in significant damage, loss of life and injuries. While the impacts associated with natural hazards can change substantially from year to year, the identification and measurement of cost is largely determined by Planning,�building�and�insuring�����������11� �
the defining parameters such as: direct, tangible economic costs; number of deaths; injuries; number of people affected; homes lost; and/or environmental costs. Table 3.1.2 highlights a common measure of hazard impact, recorded deaths by type of natural hazard from 1788 – 2003. Table 3.1.2. Summary of deaths in natural hazards in Australia: 1788 – 2003 Hazard
First Recorded Death
Number of Deaths
% Total Deaths
Earthquake
1902
16
0.3
Landslide
1842
95
1.6
Bushfire
1850
696
11.4
Thunderstorm
1824
774
12.7
Tornado
1861
52
.9
Cyclone
1839
2163
35.5
Flood
1790
2292
37.6
Tsunami
0
0.0
Total
6088
100.0
(Source: Blong 2005: 6) Although the effects of natural hazards such as drought (long term duration, slow onset) and heat waves (abnormally high temperature variants) are well recognised in Australia, the highly circumstantial nature of these events generally preclude them from direct enumeration in hazard statistics. Consistent with economic figures from the Bureau of Infrastructure, Transport and Regional Economics (see Table 3.1.3) the Insurance Council of Australia estimates annual insured costs from natural hazards to be approximately $1 billion dollars (Crompton and McAneney 2008).
12����������Planning,�building�and�insuring� �
Table 3.1.3: Average annual cost of natural disasters by state and territory 1967 – 2005 (millions of dollars)** State/ Territory
Floods Severe Storms
Cyclones Earthquakes Bushfires Total $
NSW
172.3
217.1
0.6
145.7
23.9
559.6
VIC
40.2
23.8
0.0
0.0
36.7
100.6
QLD
124.5
46.7
99.3
0.0
0.7
271.2
SA
19.3
16.7
0.0
0.0
13.0
49.0
WA
4.7
13.0
43.3
3.1
4.6
68.7
TAS
6.9
1.2
0.0
0.0
11.5
19.5
NT
9.1
0.4
138.5
0.3
0.0
148.3
ACT
0.0
0.5
0.0
0.0
9.7
10.2
AUST.
376.9
325.2*
281.6
149.1
100.1
1232.9
% Total
30.9
26.7
23.1
12.2
8.2
100.00
* Includes costs associated with a storm involving several eastern states ($216.7 million) which has not been allocated to any individual state data in the table (Source: BITRE 2008) ** Indicative of direct insured costs only - does not account for indirect intangible losses
With multiple lines of evidence showing that the Earth's climate system is continuing to warm (Department of Climate Change 2011) the frequency and incidence of such natural hazards are expected to change. Increasing land temperatures, warming oceans and melting snow and ice are anticipated to change rainfall patterns, global sea levels, ocean currents and ocean acidification. Such warming is also anticipated to alter the intensity and frequency of extreme events such as storms, bushfires, droughts and floods. The projected impacts of climate change on Australia’s natural and built environment make it one of the greatest social, economic and environmental challenges of our time.
3.1.2 Climate Change Data presented by the CSIRO and Bureau of Meteorology (2010) has already observed variation to climate conditions in Australia since the 1950’s, including an annual increase in average temperatures of 0.9 degrees Celsius. Regional variations demonstrate increasing frequency of hot days and nights with declining frequency of cold days and nights. Rainfall has generally declined across most of eastern and south-western Australia, in contrast to a wetter summer in regions of north-western Australia. Extreme daily rainfall intensity and frequency has similarly increased in this area and parts of central Australia and New South Wales. Australian coastal monitoring sites suggest that sea level has risen by around 10cm from 1920 – 2000. Consistent with IPCC climate change projections (2012 – refer to table 3.1.4) CSIRO has projected average Australia temperatures to rise by 0.6 to 1.5 ºC by 2030 and by 1 Planning,�building�and�insuring�����������13� �
to 5 ºC by 2070 (CSIRO and Bureau of Meteorology 2010). IPCC anticipates that wind events will increase in intensity, but there will be a decrease or no change to the number of events. Fire, heat and drought events are anticipated to increase with increases in daily temperatures. Increased high precipitation events suggest increased frequency, intensity, spatial extent, and duration of riverine flooding events. The anticipated sea level rise will contribute to more extreme sea levels in coastal hazardous events such as cyclones and storms (IPCC 2007). Table 3.1.4: Projected changes in Australia’s weather and climate extremes Climatic extreme
Projected change
Confidence in the change projected*
Number of hot days and nights
Virtual certainty
Number of cold nights
Virtual certainty
Number of warm spells and heat waves
Very likely
Number of heavy precipitation events
Very likely
Extent of drought affected areas
Likely
Intense tropical cyclone activity
Likely
Frequency of extreme high sea levels
Likely
*Confidence terms are derived directly from the IPCC (Source: IPCC cited in PMSEIC 2007: 14)
At the regional level, tropical north-western Australia is projected to experience a higher level of warming with more intense days of heavy rainfall in winter and spring (annual changes of -10 to +5 per cent) . Tropical cyclone days are projected to increase in the north-east, but decrease in the north-west, with the strongest cyclones becoming more intense. As days of heavy rainfall are also projected to intensify over summer and autumn in sub-tropical zones, the number of days with large hail is projected to increase along the east coast from Fraser Island to Tasmania Southern Australia (temperate zone) may receive up to 10 percent less rainfall with the frequency and intensity of droughts and extreme fire weather projected to increase (CSIRO and Bureau of Meteorology 2010).
3.1.3 Uncertainty Despite such projections, there is still considerable uncertainty regarding which phenomena will change and to what extent, and the precise spatial and temporal variability of impacts. While there has been increasing development of data sets and complex, technical modelling systems which are anticipated to improve the accuracy of climate change projections, limitations in available data, knowledge and understanding remain. All of which make it more essential for emergency managers and planners to operate on the basis of precautionary principles. This is essential, because of the increasing and significant cost of hazards in terms of environmental degradation, social and economic impacts. While impacts of natural hazards may be mitigated, the risk cannot be completely eliminated, it can only be reduced. Natural hazards cannot be averted, but their consequences can be avoided, managed or mitigated through
14����������Planning,�building�and�insuring� �
appropriate adaptation strategies and reducing the potential impact in areas which are most vulnerable. Given the potential vulnerability of Australia’s population, industries and infrastructure to projected climate change, it is important that appropriate actions are taken by government, businesses, communities and individuals to ensure effective adaptation is possible in a changing environment. Adaptation and proactive planning is the core business of integrated disaster management.
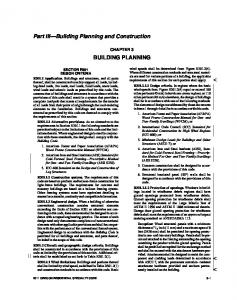
3.2 Disaster Management in Australia 3.2.1 Risk Key factors in people’s perception of risk from a hazard includes the nature of the hazard itself, the level of exposure to the hazard, and their vulnerability to that hazard (Crichton 1999). This risk ‘triangle’ which is illustrated in figure 3.1.1 has become a dominant discourse in emergency and disaster management in Australia. The focus has been on risk as a loss, the extent of which is to be determined. According to Crichton (1999) risk is a subjective assessment of the hazard, vulnerability and exposure. Where the hazard is the frequency and severity of the event likely to result in loss; vulnerability is the extent to which the person or property could be affected by the event; and exposure is based on exposure to the risk and the value exposed to that risk. This view of risk is clearly embedded in the domain of the insurance industry, and costs to government and individuals.
` Figure 3.1.1. The Risk Triangle (Source: Crichton 1999) The focus in emergency management then is on averting loss, while members of the public may be involved in trading off losses against lifestyle and other choices.
3.2.2 PPRR (Prevention, Preparedness, Response and Recovery) Another dominant paradigm in emergency management in Australia is ‘PPRR’ which is widely referred to by practitioners, scientists and academics involved in emergency management. PPRR outlines the broader elements and activities involved actively managing the impacts of natural disasters and refer to:
Planning,�building�and�insuring�����������15� �
Prevention Measures to eliminate or reduce the likelihood or consequences of an event. This also includes reducing the severity or intensity of an event so that it does not become an emergency; Preparation Measures to ensure that communities and organisations are capable of coping with the effects of emergencies; Response Measures taken in anticipation of, during and immediately after, emergencies to ensure the adverse consequences are minimised; and Recovery The coordinated process of supporting disaster affected persons in the reconstruction of the physical infrastructure and restoration of emotional, social, economic, and physical well-being. The risk assessment process can be successfully employed in all facets of emergency management, across PPRR. The main focus of this framework, however, is the strategic assessment of long-term natural hazard risk in Australia, and the use of adaptation and mitigation measures to reduce this risk. This assessment is coordinated through the Council of Australian Governments, and has implications for all three levels of government in Australia.
3.2.3 COAG - Council of Australian Governments Government policy determines the future development of Australia and the wellbeing of people living within Australia’s borders. Therefore, policy plays a fundamental role in influencing the impact of natural disasters, particularly in areas such as land use planning, construction standards and emergency management. Creating closer links between policy, research and practice is central to reducing the impact of natural disasters (Middleman 2007). Under Australia’s constitutional arrangements, all levels of government in Australia have roles, responsibilities and capabilities relevant to the development and maintenance of safer, sustainable communities. The governance arrangements which have developed over time include roles and responsibilities for business and industry, private and volunteer agencies (NGOs), and the general community. Commonwealth and state and territory governments have established organizational arrangements and lines of reporting to undertake risk prevention/mitigation activities and to effectively prepare for, respond to, and recover from, emergencies and disasters. These include laws, funding mechanisms and organizational arrangements. Local governments also have specific emergency management responsibilities, often directly legislated by state and territory governments, in contributing to a range of measures to manage risks to their communities and the environment and in coordinating community resources and capabilities in responding to emergencies and disasters. - vary according to state laws, practices and agreements 16����������Planning,�building�and�insuring� �
An effective national framework for emergency management, therefore, requires a high level of collaboration and coordination within and across all levels of government and with non-government stakeholders. Collaborative and coordinated whole of government management of risks to the Australian community is affected by arrangements to ensure that: x
key policy decisions in risk prevention and mitigation and priorities in preparedness for, response to and recovery from disasters and major emergencies are established at the highest levels of government;
x
such decisions are informed by proper and timely professional and technical advice;
x
effective coordination between and within agencies is achieved; and
x
the decisions and consequential actions are effectively communicated to the public.
3.2.4 Commonwealth Government The role of the Commonwealth Government in natural disaster management is to provide national leadership in collaborative action across all levels of government in disaster research, information management and mitigation policy and practice:, to reduce the risks and costs of disasters to the nation; to mobilise resources when State and Territory disaster response resources are insufficient; and to provide national support for disaster relief and community recovery. In particular, the Commonwealth Government has a major role in: x
coordinating national strategic emergency management policy, in collaboration with the State and Territory Governments and Local Government
x
undertaking natural disaster research of national significance
x
identifying national priorities for natural disaster mitigation, in collaboration with other levels of government
x
providing support for disaster risk assessment and mitigation measures, in conjunction with the States, Territories and Local Government
x
providing operational support for disaster response to the States and Territories where their individual resources are insufficient
x
providing a national disaster relief and recovery framework and resources on a cost-sharing basis with the other levels of government, and
x
providing vital information services such as meteorological, hydrological, geophysical and other geo-data services that support warnings and disaster management.
Planning,�building�and�insuring�����������17� �
The Commonwealth also has a continuing role in: x
providing national leadership on mitigation strategies and assessment
x
providing financial assistance to States, Territories and Local Government for cost-effective, priority disaster risk management
x
providing financial assistance to States, Territories and local Government to assist them in meeting their disaster mitigation responsibilities
x
leading to an overall reduction in damage and costs, thereby benefiting all Australians and all levels of government.
3.2.5 State and Territory Governments State and Territory Governments are involved by: x
developing, implementing and ensuring compliance with comprehensive disaster mitigation policies and strategies in all relevant areas of government activity, including land use planning, infrastructure provision, and building standards compliance
x
strengthening partnerships with and encouraging and supporting Local Governments, and remote and Indigenous communities, to undertake disaster risk assessments and mitigation measures
x
ensuring provision of appropriate disaster awareness and education programmes and warning systems
x
ensuring that the community and emergency management agencies are prepared for and able to respond to natural disasters and other emergencies
x
maintaining adequate levels of well-equipped and trained career and volunteer disaster response personnel
x
ensuring appropriate disaster relief and recovery measures are available, and
x
ensuring that post-disaster assessment and analysis is undertaken.
Agencies, organisations and the community operate) are in place, and they maintain the government and statutory agencies that provide emergency services to the community (e.g. police, fire, ambulance, emergency, health and medical services). Details of the specific emergency management arrangements for each state or territory are available through their respective emergency management agencies. Under cooperative arrangements with the states and territories, the Commonwealth Government provides: x
support to the states and territories in developing their capacity for dealing with emergencies and disasters across all hazards
18����������Planning,�building�and�insuring� �
x
national coordination functions
x
assistance to states or territories when requested
x
financial assistance in the form of cost sharing arrangements for response and recovery expenditure.
3.2.6 Local Governments Local governments play an important role in emergency management because of their strong relationship with their local community networks and knowledge of locally available resources. Where Local Government powers exist, Local Governments also have responsibilities, in partnership with States and Territories, to contribute to the safety and well being of their communities which means they have an important role participating in local natural disaster management. In most circumstances, the principal roles and responsibilities of Local Governments are: x
ensuring all requisite local disaster planning and preparedness measures are undertaken
x
ensuring an adequate local disaster response capability is in place, including local volunteer resources
x
undertaking cost-effective measures to mitigate the effects of natural disasters on local communities, including routinely conducting disaster risk assessments
x
systematically taking proper account of risk assessments in land use planning to reduce hazard risk
x
undertaking public education and awareness, and ensuring appropriate local disaster warnings are provided
x
ensuring appropriate local resources and arrangements are in place to provide disaster relief and recovery services to communities
x
representing community interests in disaster management to other levels of government and contributing to decision-making processes, and
x
participating in post-disaster assessment and analysis.
A number of States and Territories have areas that are outside local government boundaries. For example, in SA, Local Government has had no responsibilities for funding and supporting volunteers since the introduction of the emergency services levy. In NT, Local Governments do not have land use planning powers. In NT and WA, the majority of Indigenous communities have a modified form of local government, with no income from rates. In these communities, significantly greater levels of responsibility for decision making and funding, relating to community safety and welfare, is accorded to the State, Territory and Commonwealth Governments, through various agencies.
Planning,�building�and�insuring�����������19� �
The Arrangements are reviewed every three years, or more frequently for major changes. These partnerships aim to minimise vulnerability to hazards; protect life, property, and the environment; minimise adverse social impacts during emergencies; and facilitate recovery, rehabilitation and reconstruction.
3.2.7 An Integrated Approach Australia has adopted a comprehensive and integrated approach to the management of emergencies and disasters. This approach is: x
comprehensive, encompassing all hazards and recognising that dealing with the risks to community safety requires a range of activities to prevent, prepare for, respond to and recover from any emergency; and
x
integrated, ensuring the involvement of governments, all relevant organisations and agencies, private sector and the community (multiple stakeholders).
The roles of various external agencies by state are indicated in Table 3.1.5 (below). Table 3.1.5: State and Territory Emergency Management State/Territory
Relevant Legislation
Key Agencies
Victoria
Emergency Management Act 1986
Office of the Emergency Services Commissioner DSE (Department of Sustainability and Environment) VIC SES (Victoria State Emergency Services) CFA (Country Fire Authority)
New South Wales
State Emergency and Rescue Management Act 1989 No 165
Queensland
Disaster Management Act 2003
Western Australia South Australia
Emergency Management Act 2005 Emergency Management Act 2004
Emergency Management NSW SES (State Emergency Services) NSW Rural Fire Service NSW Fire Brigades Department of Community Safety Emergency Services Queensland State Disaster Management Group SES (State Emergency Services) VMR (Volunteer Marine Rescue) RFS (Rural Fire Service) Fire and Emergency Services Authority (FESA)
Tasmania
Emergency management Act 2006
Australian Capital Territory
Emergencies Act 2004
Northern Territory
Fire and Emergency Act 2010 Disaster Act 2008
SA Fire and Emergency Services Commission SES (State Emergency Services) CFS (Country Fire Service) SES (State Emergency Services) Tasmania Fire Service A.C.T. Emergency Services Agency A.C.T. SES (State Emergency Service) A.C.T. Rural Fire Service Northern Territory Fire and Rescue Service Northern Territory Emergency Services
Source: http://www.ga.gov.au/hazards/emergency-management/jurisdictional-emergencymanagement-links.html
20����������Planning,�building�and�insuring� �
3.2.8 Roles of Individuals, Businesses and Other Parties Dealing with emergencies is not simply a matter for governments. Individuals, families and the community as a whole play a role in determining how well communities are safeguarded from emergencies and the degree of resilience of communities. The roles and responsibilities of key non-government stakeholders are summarised below. Families and Individuals Households have principal responsibility for safeguarding their property and assets against risks from natural and technological hazards through risk identification, choice of residence, mitigation measures and adequate property and contents insurance where insurance for the risks they face is available and reasonably affordable. The collective actions, or inaction, of individuals and families can have a major influence on the severity of an emergency’s impact. In significant emergencies, emergency management career personnel and volunteers do not, and never will have, the capacity to simply ‘solve’ the emergency threat for every individual at risk. Nor do governments and charitable agencies have the ability or responsibility to fully offset the financial losses incurred by families and individuals in the course of an emergency. It is the role and responsibility of families and individuals to attain the highest degree of physical and financial self-reliance, before, during and after an emergency. In particular they should: x be fully aware of the risk of hazards to the home and regular activities x arrange where available for adequate home and contents insurance to cover likely risks in their area x make plans and preparations for dealing with an emergency situation x minimise hazard risk factors in and around the home environs, and x find out what local plans are in place in the event of an emergency. Communities Local communities can take a wide range of actions to become more disaster ready and, in particular, should: x promote high levels of awareness of hazard risks in their community and the collective preparations and actions that should be taken in the event of an emergency x provide active support for government and community efforts to minimise the possible consequences of emergencies, such as hazard risk reduction measures, and x provide a culture of support and recognition for volunteers.
3.2.9 The insurance industry The insurance industry is a strong advocate of risk mapping and mitigation, and stands to gain much in reduced commercial loss exposure from increased mitigation. Additionally, insurance firms are major commercial beneficiaries of the emergency response efforts of emergency workers (for example, in minimising bush-fire and storm Planning,�building�and�insuring�����������21� �
damage). In turn, insurance cover offered by the industry is an integral part of an emergency-affected community’s relief and recovery. The insurance industry can play a vitally important role in: x assisting emergency management agencies with the necessary research and investment for improved hazard identification, risk assessment and mitigation efforts, and x in all communities, but particularly where mitigation efforts have taken place, providing access to insurance against emergencies, including flood and cyclone, at affordable premiums commensurate with risk levels.
3.2.10 Infrastructure providers Owners and operators of essential infrastructure or ‘lifelines’ that are vital to community functioning, such as telecommunications systems, electricity generation and distribution networks, water and gas pipelines and reticulation networks, sewerage systems, and airports, bridges, tunnels and roads systems, have responsibility for risk identification, mitigation measures and planning to ensure continuity and quality of services, including priorities for the restoration of services.
3.2.11 Businesses and primary producers The risk of emergencies is one of the risks that any business enterprise should take into account in business planning. With regard to risk reduction, strategies should include: x emergency risk assessment and disaster resilience measures x use of any physical or logistical measures to protect or remove assets and stock from the effects of the hazard x development and implementation of other plans and strategies to reduce risk and mitigate impacts, and x insurance cover for assets, stock, business interruption and loss of income where available.
3.2.12 The design, building and construction industries The resilience of the built environment to hazards is a vital factor in promoting human safety, reducing damage costs and allowing business continuity when emergencies occur. Developers, architects, engineers and the construction industry have vital roles to play in achieving improved emergency resilience. x Developers have a social responsibility to ensure that their projects do not compromise the long-term safety of those that will live and work in their developments, or increase hazard risks for others in society. x The architecture and engineering professions have roles in educating their members in hazard impacts on structures, through tertiary courses and continuing professional education and promoting best practice and innovation. x The building and construction industry has a role in promoting hazard awareness in the industry and a culture of compliance with building codes and standards.
22����������Planning,�building�and�insuring� �
3.2.13 The planning profession Land use planning which takes into account hazard risks has been identified as potentially providing the single most important mitigation measure in preventing future emergency losses in areas of new development. The professions involved with urban planning and design have important roles and responsibilities. These include implementing appropriate planning practices which take into account emergency risk reduction measures.
3.2.14 Plan, Build and Insure As the projected impacts of climate change present new risks for most sectors of business, across all levels of government, and in communities, adaptation planning and implementation can enable Australia to reduce negative impact and harness any beneficial opportunities of future natural hazards. Although adaptation presents new policy challenges, improved knowledge and understanding can assist appropriate decision making and the development and implementation of effective adaptation strategies for the built environment.
Planning,�building�and�insuring�����������23� �
4. LAND USE PLANNING: METHODS This series of case studies on land use planning used documents and surveys to examine the perceptions of residents about risk from natural hazards, and their responses to that risk. This study also examines the influence of land use planning on land settlement patterns. In addition, it reviews the findings of the Queensland Flood Commission of Inquiry (March 2012), and responses of planners to those findings. This section begins with a study of residents at Mission Beach in Far North Queensland who have been directly affected by storm surge, and their adaptive strategies should a major event occur. The second study focuses on the preferred adaptive strategies for residents of the Brisbane, Queensland, suburbs of Milton and West End who were directly affected by the 2011 floods. The final study is a review of the findings of the Queensland Flood Commission of Inquiry in conjunction with a survey of planners’ views of the findings, especially in relation to the use of planning legislation in the context of adaptation to flooding. All these studies contribute to the understanding of the broader complexity of land use planning issues, within the context of current and proposed planning policy and legislation.
4.1
Survey method: Planners, Hazards and Adaptation
The Integrated Planning Act (1997) (IPA) did not contain overt hazard planning provisions. A consideration of natural hazards was added in 2003 through the development of a State Planning Policy, number 1/03 (SPP 1/03). This state planning policy was a first cut at dealing with the issue of natural hazard mitigation through planning legislation. Between 1997 and 2003 local government councils had developed, or were still developing in 2003, new planning schemes under the IPA. The state planning policy required hazard mapping and overlays to be produced and incorporated into the planning scheme. It is important to note that this process began after many planning schemes had already been finalised. In 2009 the IPA was replaced by the Sustainable Planning Act (2009) and the drafting of new planning schemes began under the new act. The state planning policy (SPP 1/03) is due to expire in 2013. An SPP 1/03 review process commenced in 2010 with the aim of strengthening, tightening and improving its guidelines for natural hazard mitigation. Many planners and especially emergency managers considered SPP 1/03 to have been a weak and flawed document. Planning researchers in the Centre for Disaster Studies made a submission in response to the Planning Institute of Australia’s call for comments and submissions. This was done in late 2010 and incorporated issues that were to be researched with planners during the early part of 2011. The project’s research plan set out to interview planners in order to gauge attitudes towards planning for natural hazard mitigation within a scenario of increasing frequency and intensity of natural hazards. It was intended that this research should take place primarily within Queensland with emphasis on floods, cyclones and associated storm surge. The disasters of 2011, especially in Queensland, inevitably altered the timing and emphases of the research plan. Instead of discussing the potential for change in planning practice and legislation within a scenario of increased natural hazards,
24����������Planning,�building�and�insuring� �
planning professionals were confronted with a series of severe floods and cyclones, the Commission of Inquiry and a direct challenge to planning practice. The disastrous wet season of 2010-11 saw a cyclone and extensive inland flooding in North and Central Queensland already occurring before the end of 2010. Floods then built and extended through most of Queensland during January 2011, and continued to impact some locations until April 2011. The Central Highlands, Central Queensland and Southern Queensland were especially impacted by floods. River floods were the primary hazard, but flooding of the Brisbane River was linked to potentially mismanaged flood water release from Wivenhoe Dam. Severe flash floods also occurred especially in Toowoomba and the Lockyer Valley. A total of 31 people died in all of these floods with most losing their lives in Toowoomba and the Lockyer Valley. These events and the loss of life generated significant distress and controversy within the community and led to the establishment of the Commission of Inquiry. Two cyclones also crossed the North Queensland coast at the end of January and the beginning of February 2011. Category two Cyclone Anthony crossed between the Burdekin and Mackay, while category four Tropical Cyclone Yasi crossed the coast in the Tully and Cardwell areas. These events impacted the whole coast from Cairns to the Burdekin. Severe storm surges occurred in several places but flooding inland was not as great as had been anticipated. Extensive damage occurred in towns and settlements from Babinda in the North to Ingham in the South. Cairns and Townsville experienced Yasi as a category one and category two cyclone respectively. In Townsville, vegetation damage was severe. As a consequence of these events, and the convening of the Commission of Inquiry, it was neither possible, nor prudent, to interview planners during 2011. Many planners, emergency managers, engineers and hydrologists, as well as scientists, insurers, and members of the public were called before the inquiry. The first report of the inquiry concentrated on emergency management procedures. The final report, and second part of the inquiry, was dominated by planning and engineering issues, including the timing of release of flood waters from the dam. Controversy around this latter issue delayed the release of the report from January until March 2012. Once the final Flood Inquiry Commission Report was released in March 2012, an analysis of its recommendations, and the arguments that informed its recommendations, were used in this research to generate groups of statements about implications for planning. These statements and questions concern the following sets of issues: 1. The use of Q100 and other measures of flood exceeded as probabilities; 2. Floods studies and floodplain management; 3. Planning provisions; 4. The Sustainable Planning Act and State Planning Policies; 5. Property impacts and compensation issues; 6. Land use, infrastructure and flood protection infrastructure; Planning,�building�and�insuring�����������25� �
7. Evacuation, stormwater, habitable rooms and flash flood issues; 8. Buybacks and land swaps; 9. Respondents’ areas of work; 10. Open-ended statements. Nearly all questions were presented as a statement, with the request that the respondent indicate his or her level of agreement on a Likert scale. The scale covered the categories of; strongly disagree, disagree, ambivalent, agree, strongly agree, and not applicable or no knowledge. It was intended, and it is assumed, that respondents who were not concerned one way or the other about a statement would opt for “ambivalent” rather than “not applicable”. The results showed that this was how planners responded. An insignificantly small number of responses opted for “not applicable”. The Queensland flood report survey was primarily made available through the Planning Institute of Australia e-news mail-out to PIA members during April and early May 2012. The online survey was further advertised through networks and contacts in specific cities in Queensland. Printed versions of the survey and stamped addressed envelopes were delivered to planners in Cairns, Townsville and Mackay. The survey results indicate that the vast majority of respondents were from North, Far North and Central Queensland, and that most worked for local governments. The results of the survey have to be interpreted as indicators rather than being representative of the planning profession. However, the Flood Commission of Inquiry report recommendations themselves are dominated by southern Queensland planners who presented evidence to the Commission of Inquiry. Brisbane, Ipswich and Gold Coast are particularly strongly represented amongst the submissions. Because of the late release of the Flood Commission of Inquiry report the survey was only made available for three weeks. This followed the drafting and piloting of the survey form and University ethics approval. Most respondents completed the survey online. As guaranteed in the survey explanation, no ISP addresses were collected or stored. Original questionnaires, online and paper, have been securely stored. There were 47 respondents, of whom 40% wrote (in some cases extensive) additional comments. These are recorded as a single table, but sentences and phrases from these comments have been inserted into sections that are concerned with their content. Several comments were slightly modified to ensure that the respondent could not be identified. Otherwise the only alterations made to the open ended comments were corrections of typing and spelling errors (Survey Monkey delivers very small fonts where it is difficult to spot minor errors). Several comments were concerned with the questionnaire survey itself. These are reproduced and discussed below. The survey introductory paragraph explained the background of the Flood inquiry as the basis of the survey as follows: ‘Researchers at the Centre for Tropical Urban and Regional Planning at James Cook University are investigating the impacts of natural hazards on the urban and regional land-use planning practices and legislation. This is part of a larger research project 26����������Planning,�building�and�insuring� �
that is funded by the National Climate Change Adaptation Research Facility that is investigating changes that may be required in terms of planning, building codes and insurance in the built environment. This survey is based on many of the recommendations that have been made in the Queensland Flood Commission of Inquiry final report, which emphasises issues of land use planning. The report and this survey make particular reference to the Sustainable Planning Act 2009, and the state planning policy SPP1.03 on mitigating the impacts of natural hazards. We are seeking your reaction as a planner, to aspects of the changes that may be required in practice or in legislation, in order to reduce flood risk in various parts of Queensland. This survey is not specifically concerned with the location in which you practice, but we acknowledge that local knowledge and experience may guide your answers. For this reason that we are only requesting that you indicate the broad region within Queensland in which you work. This survey is not intended, in any way, to be an evaluation of the commission's report. We had planned to carry out a similar survey of planners’ attitudes to hazard mitigation during the early part of 2011. However, the disasters of that period and the subsequent inquiry necessitated a delay until the inquiry had been completed. Consequently this survey is developed from the findings and recommendations of the inquiry.’ We have adapted certain of the inquiry recommendations, and aspects of their explanation, into a number of statements for which we seek your opinion. Most statements are followed by an opinion scale. The survey statements and questions are reproduced as an appendix.’ As the introductory paragraph explains, the statements that have been developed in the questionnaire were derived directly from the recommendations of the Flood Commission of Inquiry report. Some statements followed the recommendations more closely than others. Several statements in the questionnaire are derived from the implications of the recommendations. They also reflect opinions and statements made by emergency managers and planners in other forums, as well as our experience of working with planners and emergency managers for the past 20 years. Because respondents made comments on the questions it is fair to list their criticisms and to add some explanation of the construction of the statements to which they were requested to give an opinion. One respondent made the comment that “I did not think your first question was clear and therefore did not answer.” Only this person did not answer this question, which was a more complex question than all of the others. This was not identified as a problem in the initial review of questions. The responses concur with the comments made in the Commission of Inquiry report that many councils have moved away from a rigid reliance on the Q100 level as the primary flood level definition. Three respondents noted the complexity caused by the diversity of local governments in Queensland and suggested that more expanded responses would have been useful. As the original aim had been to survey a large number of planners within a very limited time period, the decision was to keep the survey short and to avoid open ended questions in each section. As it was, only a minority of respondents answered the single open ended question. Planning,�building�and�insuring�����������27� �
“Some of these questions are difficult to give a definite answer as I work mainly on remote Indigenous schemes.” “A lot of the questions really depend on the situation.” “Many of the questions asked in the first few sections, did not allow for expanded responses. It would be very appropriate to back this survey up with interviews with local councils to get an understanding of how Q100, Q20, local flood reports are used.” The comments on diversity are relevant noting that the Inquiry terms of reference stipulate that the inquiry address ‘all aspects of land use planning through local and regional planning to minimise infrastructure and property impacts from floods.’ Further, ‘in undertaking its inquiries, the Commission is required to: take into account the regional and geographic differences across affected communities’. (Queensland Flood Commission of Inquiry Final Report, p. 624). However, submissions from the areas affected in South East Queensland dominated. Recommendations that are intended for disaster, and especially flood, mitigation are made for all areas of the state without due attention paid to the diversity of local governments. It was for this reason that respondents outside the south east were particularly targeted. Interviews with local councils have also been carried out. Two of the respondents commented on perceived bias in the survey. Some of the recommendations of the Inquiry do seem to be biased. The survey reflects these biases in order to prompt a response from practising planners. A few of the statements also reflect strong opinions of emergency managers and climate change scientists on what planners ought to be doing. Question/statement 4.4 is directly derived from recommendation 4.6, which is probably influenced by submissions from outside the planning profession. It specifically represents the views of many emergency managers, who do not necessarily have the knowledge of the development process. They nevertheless have contributed extensively to the Inquiry report and have strong opinions about development on flood plains (these may or may not be realistic). One of the problems with hazard mitigation has been an absence of planners in the hazard planning process. Ultimately there was a strong involvement of people from outside the profession attempting to drive change in planning practice. “I found this survey somewhat biased. It appears that some questions have been written by persons without sufficient knowledge of the entire development process...such as question 4.4.” and; “At one point during 2011 2/3rds of Queensland was flood affected. Is the author of this survey suggesting that 2/3rds of the existing development in Queensland is inappropriate?” A final comment from a respondent summarised all of these issues of complexity, diversity and a lack of opportunity to expand on limitations: “This is an interesting topic and the research is needed. Hopefully a lot more research is done to refine the results than will be presented by this survey. It is a little disappointing that a university research project has loaded several of the questions in 28����������Planning,�building�and�insuring� �
such a way that it is difficult to answer in the format provided - many of the questions generate provisos in planners' minds when they come to answer them e.g. the answer is not as clear cut as clicking one button or another as it depends on the circumstances. Many of the questions would have been much better understood by the survey creators if there had been a box like this one at the bottom of each page to enable the surveyee to provide the professional clarification needed to explain the answers. I am feeling a little uncomfortable about several of my answers because I have not had this opportunity. As a former JCU student, I would have hoped that a better process had been developed.” We hope that survey respondents and members of the planning profession will participate actively in the hazard mitigation changes that may flow from the 2011 disasters and the subsequent Inquiry. In particular we hope that planners will stress the complexity and diversity of issues, and avoid the adoption of the South East Queensland response as a template for all jurisdictions.
Planning,�building�and�insuring�����������29� �
5. LAND USE PLANNING: CASE STUDIES 5.1 Case Study (1): Storm Surge Adaptation: Community Perspectives in The Mission Beach Area During the early development of many Australian coastal regions, a lack of planning and development restrictions, combined with a clear disregard for coastal hazards, has resulted in a significant numbers of people and infrastructure at risk from hazards such as storm surge inundation. With the onset of climate change, experts anticipate a change in the intensity of mid-latitudinal storms and tropical cyclones as well as a continuation in mean sea level rise (AGDCC 2009). These climatic factors, coupled with the ever present development pressures associated with coastal population growth, will only increase levels of vulnerability and risk in storm surge prone areas. In response to this projected increase in risk and vulnerability, this case study investigated the effectiveness of coastal hazard adaptation in reducing risk by minimising community vulnerability and maximising resilience within storm surge prone areas. The coastal hazard adaptation process incorporates three interrelated options: retreat, protect and accommodate. Each of these options incorporates its own distinct adaptive strategies. The degree to which at-risk coastal communities adopt these hazard adaptation strategies will depend primarily on levels of community and government support. The concept of coastal hazard adaption to storm surge is considered in the context of affected communities within the Mission Beach area, investigating community and government support for hazard adaptation. Understanding the acceptability of hazard adaptation will help close knowledge gaps in current literature and help determine the plausibility of future adaptation occurring in the Mission Beach area. Storm surge is a phenomenon experienced throughout many coastal communities regularly affected by mid latitudinal storms and tropical cyclones. The research methodology developed in this case study is applicable to all storm surge prone localities.
5.1.1 Coastal hazard adaptation In response to climate change projections (IPCC, 2012), the Australian government has implemented mitigation strategies focused on decreasing the global anthropogenic influence on climate change (carbon emissions). Mitigation strategies such as carbon sinks may be effective at decreasing the future extent of climatic change, but unfortunately do little to cope with current issues already occurring as a result of a changing climate (Department of Climate Change, 2011). In contrast, the concept of adaptation deals with reducing or preventing these issues by minimising risk exposure and increasing community resilience (Smit et al., 1999; IPCC, 2012; Nelson, Lamboll & Arendse, 2008; Tol, Klein & Nicholls, 2008). Although clear differences between mitigation and adaptation have been identified throughout the literature (IPCC, 2012; Pittock & Jones, 2000), there are others (Ayers & Huq 2008) who address them as one, stating that the two concepts share a common goal of decreasing the adverse affects of climate change within coastal zones. For the purpose of this case study with
30����������Planning,�building�and�insuring� �
its focus on coastal hazard adaptation, the two will be considered as separate concepts. Pittock and Jones (2000) describe adaptation as a change to processes, practices and structures within vulnerable localities aimed at decreasing future adverse affects of climate change. Smit et al. (1999) expand on this description, stating that a successful analysis of adaptation needs to specify three interrelated factors – “adapt to what”, “who or what adapts” and “how does adaptation occur”. The question of “adapt to what” has of course been answered, being an increase in the magnitude of storm surge events, based on current climate projections. In the context of this study, those involved with the adaptation process are the Mission Beach residents and the Cassowary Coast Regional Council. Also relevant are the policies, regulations and restrictions that govern sustainable development within the region. Pittock and Jones (2000) describe two forms of adaptation: “autonomous” and “planned”. Autonomous adaptation is what unmanaged naive human systems (communities) would do by themselves, based on their experience with recent coastal hazards (reactive adaptation). Planned adaptation on the other hand is based on an awareness of anticipated climate change, and involves conscious human intervention within a coastal zone to protect or enhance its ‘desirable’ aspects.
5.1.2 Land Use Planning and Zoning Although successful hazard adaptation will involve on-the-ground initiatives, state and local government will have a critical role in increasing community resilience and minimising risk levels through land use planning and zoning regulations (Department of Climate Change, 2009). According to Burby (1998), by managing land use and planning to enhance coastal sustainability, we can reduce the numbers of people vulnerable to hazards. Combining hazard adaptation and local land use planning and zoning regulations is not a new concept. Hazard experts have long expressed its relevance in preventing development in disaster prone areas (Godschalk, Kaiser & Berke, 1998). Regardless of this, development has occurred where it should not have, contributing to a growing acceptance of reformed land use planning as a key adaptive strategy. In the past it was often the case that many local governments, of their own accord, gave little attention to coastal hazards until major events occurred. Federal and state governments acknowledge the importance of proactive planning to reduce community risk, but in the past have been reluctant to force local governments to implement strict land use planning and zoning regulations within hazard prone areas. Reforming land use planning can provide an opportunity for local governments to reassess land suitability by analysing levels of vulnerability and risk, taking into account climate change. This will provide insight for policy makers, potential future investors and current residents alike. Incorporating climate change projections, while considering their uncertainty, could provide decision makers with a precautionary approach to land use planning and rezoning within coastal communities (Walsh et al., 2004). While land use planning provides guidance for coastal development, regulatory zoning is needed to set statutory guidelines for the private sector in regards to where development will be allowed and how that development should be undertaken (Godschalk; Kaiser & Berke, 1998).
Planning,�building�and�insuring�����������31� �
New state planning policies will dictate reforms to land used planning and zoning regulations that reflect the importance of coastal hazards, climate change, and the coastal hazard adaption process. The Queensland Coastal Plan (2011) was drafted in accordance with amendments to the previous SPP (The State Coastal Management Plan, 2002) and the Coastal Protection and Management Act 1995. Within that statutory document is an increased focus on coastal hazard zones, based on a static increase in mean sea level and changes to the intensity of mid latitudinal storms and tropical cyclones (see Queensland Coastal Plan, s2.1 – Defining Coastal Hazard Areas). Land use planning and zoning will be imperative to the hazard adaptation process by reducing development in hazard prone areas.
5.1.3 Physical Coastal Hazard Adaptation While land use planning plays an essential adaptive role in governing future development within vulnerable coastal communities, it must be combined with an onthe-ground, localized approach to address the people, infrastructure and coastlines already at risk (Adger et al., 2003; Nelson, Lamboll & Arendse, 2008; Klein et al., 2001). Stemming from past planning weaknesses, coastlines throughout Far North Queensland are burdened with vulnerable infrastructure. The consequences of such were shown in 2011 with Tropical Cyclone Yasi partially destroying communities throughout the Tully/Hull Heads, Cardwell and Mission Beach areas. These extreme events express a need for insight and action into coastal hazard adaptation to minimise the extent of future events. To ensure an effective and feasible approach to adaptation, assessments are needed across national, and more importantly, regional and local scales. According to the CSIRO (2011), regional or local assessments will help identify at-risk areas, as well as the most feasible adaptive approaches to minimising risk and increasing levels of resilience. When scoping on-the-ground hazard adaptation, the Department of Climate Change (2011) describes four basic approaches or options, these being; do nothing (autonomous adaptation), protect coastal infrastructure from storm surges, retreat infrastructure away from storm surge prone areas, and alter coastal infrastructure to accommodate storm surge (Burton et al., 2002; Smit et al., 1999; Folke et al., 2002). It is important to note that these options incur individual costs, with some costing more than others, and in determining the feasibility of each option governments will most likely assess the importance or significance of vulnerable infrastructure (CSIRO, 2011). In some circumstances, a combination of these options may create a feasible and effective way of reducing risk and building resilience to storm surge adaptation. These options will now be discussed.
5.1.4 Do Nothing The ‘do nothing’ approach to adaptation involves exactly that. At minimal monetary cost to local governments and community residents, doing nothing allows for a reactive approach to adaptation and risk management (Walsh et al. 2004). Often referred to as ‘autonomous’ adaptation, doing nothing involves a complete disregard for precautionary approaches to building community resilience and minimising risk. Adaptive initiatives may eventually be implemented by governments, but will usually be reactive works, occurring post-disaster (Tol, Fankhauser & Smith, 1998). Burton et al. (2002) explain how the ecological, social, and economic costs associated with reactive,
32����������Planning,�building�and�insuring� �
autonomous adaptation are substantially high, and are largely avoidable through planned, proactive adaptation.
5.1.5 Retreat Planned or managed retreat involves a decision, primarily by state and local governments, to withdraw, relocate or abandon infrastructure and development within coastal hazard zones (Department of Climate Change, 2011). Planned retreat is the most extreme and controversial of all adaptive options, usually causing conflict between governments, property owners and developers, though there are few cases within Australia where the option has actually been employed. Retreat is usually considered in circumstances where medium to high level infrastructure (including private housing) is at risk from coastal hazards like surges, or previous extreme events have caused significant damage (Adejuwon et al., 2001). Planned retreat can occur on a range of scales, involving increased set back provisions, relocation of structures within properties, rezoning of land and, depending on government funding, property buy back schemes. Governments may also attempt to restrict post-hazard redevelopment (El Raey et al., 1999), though this often fails as redevelopment usually occurs before statutory regulations are enforced. The Byron Shire Council has had a planned retreat strategy in place since 1988, but strong community disagreement, especially from those affected by erosion, has impeded the effectiveness of the strategy (Johnston, 2009; Burmester, 2009). Drabek (1986), states that people move to coastal zones for the aesthetic value and coastal lifestyle, which over time, can generate a strong ‘sense of place’ or belonging. This strong ‘sense of place’ will no doubt create a social barrier for the implementation of planned retreat strategies (Pittock & Jones, 2000). Abel et al. (2011), describe how in theory, planned retreat will provide the most effective approach to risk management in hazard prone areas, although the option will incur high costs, especially with regards to the relocation or buy back of vulnerable infrastructure.
5.1.6 Protect The protection of vulnerable coastal infrastructure generally involves the implementation of structures or strategies aimed at maintaining coastal assets or infrastructure in their current location (Burton et al., 2002; Department of Climate Change, 2011). The construction of sea walls, storm surge barriers, groynes and other physical defences are all classified as protective works, including beach renourishment with externally sourced sediments (usually from areas with excess sand accretion). Extensive re-vegetation of dune and foreshore areas can also be classified as protective works as the presence of extensive vegetation can reduce wave forces and erosion associated with a significant surge event. Protective works are usually built in locations and to standards based on historic events, giving them an average decadal life, as these standards will inevitably be exceeded over time with the onset of climate change (Klein & Nicholls, 1999). Protective works, especially sea walls, storm surge barriers and groynes are generally extremely expensive and incur high costs to both build and maintain. Because of this, protection is generally a feasible long-term option for areas that are highly developed with a history of protection, as well as coastal locations that contain critical infrastructure like hospitals and utilities (power, water, sewerage). Adejuwon et al. (2001) describe how community residents will often Planning,�building�and�insuring�����������33� �
endorse protective adaptation when their personal property is at risk, although the use of these defensive structures can also lead to a false sense of security, promoting ongoing development in vulnerable areas. Figure 5.1.1 provides us with an example of a protective adaptation strategy, a sea wall constructed at Machans Beach, Cairns, Far North Queensland.
Figure 5.1.1 - A sea wall built at Machans Beach, Cairns - a protective strategy Image: David King, 2005
5.1.7 Accommodate Pittock & Jones (2000) describe accommodation as a cost effective, transitional approach to hazard adaptation for areas containing vulnerable coastal infrastructure. Accommodating storm surge involves the alteration of infrastructure to allow surge water to pass through a community with minimal obstruction, thus reducing the extent of damage to coastal infrastructure. Accommodation will allow for the continued utilisation of vulnerable coastal areas whilst minimising the impact of a major storm surge (Federal Environment Agency, 2009). Accommodative measures can include but are not limited to; elevating coastal infrastructure (Figure 5.1.2), improved home and contents insurance, increased community education, increasing new house slab heights, increasing community drainage infrastructure, and changes to emergency management practices (Department of Climate Change, 2011). This approach will promote a high level of public participation with future adaptation attempts, creating a sense of involvement throughout storm surge prone communities. To allow for accommodation to occur, land use planning and zoning, as well as building codes must identify and regulate these strategies. Choosing to accommodate the impacts of climate change will never be a permanent solution. It does, however, promote risk assessment and management while allowing for the continual utilisation of vulnerable coastal zones (CSIRO, 2011). 34����������Planning,�building�and�insuring� �
Figure 5.1.2 - Elevating coastal infrastructure, an accommodative strategy Image: Centre for Disaster Studies, 2011
5.1.8 Adaptive Capacity Smit et al., (1999) describe adaptive capacity as the ability of a socio-economic system (community) or environment to adapt to the adverse affects of climate change. According to Burton et al. (2002) successful adaptive planning requires a comprehensive understanding of the adaptive capacity of a community and the factors that influence this. Efforts should be made to maximise the adaptive capacity of vulnerable coastal communities because this will ultimately determine future levels of community adaptation. Pearce (2003), states that the inquiry into the adaptive capacity of a community (system) involves answering questions such as: Is adaptation to climate change possible? Is protection, repair, or relocation of the system feasible? Can the systems resilience be increased? Taking these questions into consideration, the IPCC (2001) and The Pew Centre on Global Climate Change (2009) provide the following table 5.1.1 of factors that may influence the adaptive capacity of a socioeconomic system.
Planning,�building�and�insuring�����������35� �
Table 5.1.1: Key factors for determining a system’s adaptive capacity Factors
Examples
Economic resources
Wealth of individuals and localities.
Technology
Localized climate and impact modelling to predict climate change and variability
Information/awareness
Species, sector, and geographic-based climate research
Skills/human resources
Training and skill development in sectors and populations
Natural resources
Abundant levels of varied and resilient natural resources that can recover from climate change impacts
Infrastructure
Systems that provide sufficient protection and enable efficient response
Institutional support/governance
Governmental and non-governmental policies and resources to support climate change adaptation measures locally and nationally
(Source: Klein et al. (2007) IPCC as used in Pew Center (2009) Climate Change 101)
5.1.9 Capacity Building In order for communities to increase their resilience and minimise their vulnerability, they must work towards increasing their overall adaptive capacity (Folke, Colding, & Berkes, 2002; Burton et al., 2002). This is achieved through a process known as capacity building. Capacity building aims to incrementally enhance the determining factors of a system’s adaptive capacity, as outlined in Table 5.1.1, thus increasing the system’s ability to adapt, and become increasingly resilient (Smit & Wandel, 2006). According to Nicholls et al. (2003) maintaining and enhancing community resilience and adaptive capacity are critically important policy and management goals. Doing so enhances attempts at future disaster prevention and preparedness, recovery and climate change adaptation. According to Klein et al. (2003), the higher the adaptive capacity of a system, the greater the likelihood of non-statutory strategies being adopted by local governments and individual households. Holmes (1996) explains how the process of capacity building is not simple, but involves periods of growth followed by periods of consolidation, refocus and redirection. The most important steps in enhancing the adaptive capacity of vulnerable coastal communities occur locally, although guidance and funding is often needed from state or federal governments (Burton et al., 2002). It is important to involve stakeholders 36����������Planning,�building�and�insuring� �
(property owners) in capacity building initiatives as they play an integral role in reducing their personal risk and vulnerability. Information sharing is usually an effective tool for increasing the general public’s awareness about climate change issues and possible adaptation strategies. Ribot et al. (1996) found that individuals may be reluctant to be involved in the hazard adaptation process, though this usually changes after experiencing an extreme event. Grothmann & Patt (2005) concur, and go on to state that creating enthusiasm amongst stakeholders usually requires some form of incentive provided by local or state governments. It should be noted that although this assists with participation, it may create false expectations amongst property owners that governments will always provide assistance if they choose to remain in at-risk areas (Department of Climate Change, 2009).
5.1.10 Maladaptation Maladaptation is defined as an adaptive response to coastal hazards like storm surge inundation that results in a negative or previously hidden consequence. The IPCC Third Assessment Report (2001) defines maladaptation as ‘an adaptation that does not succeed in reducing vulnerability but increases it instead’. A 2010 editorial from the journal of Global Environmental Change identifies some examples of maladaptation, including: x
x x
Disproportionately burdening the most vulnerable – adaptation actions that, in meeting the needs of one sector or group, increase the vulnerability of those most at risk. High opportunity costs – adaptation actions that incur high economic, social or environmental costs compared to cheaper alternatives. Reduce Incentive to adapt – adaptation actions that reduce community incentives to adapt. For example, encouraging unnecessary dependence on others or penalising early actions.
Precautions should be taken to minimise the potential for maladaptation so that community vulnerability and risk are not unnecessarily increased (Smit & Wandel, 2006). A cost benefit analysis should be conducted on all adaptive responses, taking into account the social and economic factors within each community. National and international examples of hazard adaptation strategies should provide policy makers with the insight needed to minimise the potential for maladaptation.
5.1.11 Barriers to Adaptation While coastal hazard adaptation policy and practice is still a relatively new focus for communities and governments throughout vulnerable areas, there is a growing awareness that current approaches to coastal zone management/hazard management may actually create barriers for future adaptation (Department of Climate Change, 2011; Smit & Wandel, 2006). Analysis of available literature on hazard adaptation and coastal zone management suggests that there are major barriers for future adaptation within current coastal management systems. These include but are not limited to: x
Current Planning and design specifications and methodologies are based on historical climatic models which assume a static sea level (Smit et al., 1999). According to Adger et al. (2005) planning and design requirements must adopt Planning,�building�and�insuring�����������37� �
x
x
x
x
concepts of climate change and variability regardless of uncertainties as a precautionary approach. This is necessary for the reduction of risk and vulnerability. There is little knowledge regarding social vulnerability, cost-benefit analysis of adaptation options and their social acceptability (Ribot et al., 1996; Cutter, Boruff & Shirley, 2003). Amongst coastal communities there can be expectations that government or insurance industries will support those who live within coastal hazard zones. Governments need to support at-risk residents in a way that encourages implementation of effective adaptation tools including relocation (Smit et al., 1999). Insurance policies and premiums can be used as a market-based incentive for minimising development in hazard prone areas (Linnerooth-Bayer & Mechler, 2006). Some sections of current regulatory planning instruments encourage, meaning they do not discourage, development within at-risk areas (Department of Climate Change, 2009; Tol, Klein & Nicholls, 2008). There has been a reduction in the technical abilities of institutions involved in coastal zone management and adaptation (Burton et al., 2002). While larger councils with higher populations (increased rates contribution) may be well equipped, those that are smaller like the Cassowary Coast Regional Council cannot bear technical and financial burdens associated with proper coastal hazard risk assessment. According to Walsh et al. (2004) ill-equipped councils also lack the resources to scope out and implement feasible adaptation strategies.
Mission Beach provides a case study of how some of these factors influence adaptation.
5.1.12 Study Area and Research Methodology The following section navigates through the various data and information collection methods as well as the associated analysis techniques that were used to answer the tentative research questions. Predominately qualitative research was conducted with literature research, household surveys and interviews/discussions being the main sources of key information and data. The use of multiple sources and methods of data collection is referred to as methodological triangulation and allows for successful, in depth, data collection from a variety of different sources (Madill; Jordan & Shirley, 2000). Also discussed within this section is the reasoning behind the chosen study location and the research limitations encountered that may have affected the accuracy and scale of the research.
5.1.13 Study area To facilitate the research questions regarding hazard adaptation as a primary means of reducing risk and vulnerability, an appropriate study location was essential. Tropical Cyclones Larry in 2006 and Yasi in 2011 have provided not only a study area dotted with small coastal communities affected by storm surge inundation, as well as a research imperative. These communities included Hinchinbrook, Cardwell, Tully Heads, Hull Heads, Bingil Bay and the Mission Beach area (North Mission, South Mission, and Wongaling Beach). All of the above communities lie in the jurisdiction of the Cassowary Coast Regional Council (CCRC), providing the author with a basis for 38����������Planning,�building�and�insuring� �
research into local government perspectives towards hazard adaptation. The location of so many affected coastal areas throughout the Cassowary Coast region provided a large array of potential study locations. With ethical restrictions/considerations in mind and the need to dispatch surveys in an area that sustained at least mild storm surge damage, the Mission Beach area was chosen as an appropriate study location. North Mission, South Mission and Wongaling Beach are shown in the following figures 5.1.3, 5.1.4 and 5.1.5.
Figure 5.1.3 North Mission Beach, Queensland Image: Google Satellite Imagery, 2011
Planning,�building�and�insuring�����������39� �
Figure 5.1.4 Wongaling Beach, Queensland Image: Google Satellite Imagery, 2011
40����������Planning,�building�and�insuring� �
Figure 5.1.5 South Mission Beach, Queensland Image: Google Satellite Imagery, 2011
Planning,�building�and�insuring�����������41� �
5.1.14 Community Surveys Survey design The overall survey layout was both strategic and user friendly. The survey was broken into 3 sections: Part A – Background (Q1 – Q9); Part B – Community Attitudes (Q10 – Q13); and Part C – Community Adaptation (Q14 – Q36). Questions 1 and 2 were used to determine how long participants had been living at their beachfront home. Questions 3 and 4 asked whether respondents were adversely affected as a consequence of recent surges and also to what extent. The next series of questions (Q5 – Q9) concentrated on respondents’ background knowledge, including their reason/s for moving to the Mission Beach area and their understanding of storm surge science prior to experiencing Tropical Cyclones Larry and Yasi. These questions were included to allow the researcher to establish why people were drawn to the coastal zone, as well as their levels of knowledge regarding coastal hazards and the dangers they pose. Part B (Community Attitudes) contained four questions aimed at documenting the changes in opinions and attitudes of respondents regarding their coastal lifestyles and the risks associated with living on the coastline. Question 10 determined whether recent surges had altered their opinions on their coastal lifestyles, and in what way. Question 11 allowed respondents to review their decision to live on the coast while question 12 and 13 were used to again gauge opinions about the potential for future storm surge events. Part C (Community Adaptation) was designed to introduce the process and gauge opinions of hazard adaptation as a strategic tool for minimizing risk and vulnerability. An objective of this section was to present various strategies associated with adaptation involving both households individually, as well as local government (CCRC). These strategies were presented to participants as Likert scale questions (Q16 - Q18) covering the three adaptive options: retreat, protect or accommodate. Respondents were asked to comment on each adaptive strategy, with responses being used to document perspectives and attitudes towards each. Questions 18 to 28 solidified respondents’ views on the strategies, while introducing the reality of climate change and asking respondents to document their concern for the global phenomenon. Extreme care was taken when designing Part C of the survey as responses for these particular questions contributed significantly to answering the main research objectives for this project. Questions 29 to 32 were demography-based, and used in association with questions 1 and 2 to help the researcher create a demographic profile of each of the respondents. Participant Recruitment Participant recruitment throughout Mission Beach was purposeful, and limited to private residences with absolute beach frontage or those directly landward of esplanades. This particular method of selection was necessary as surges experienced during tropical cyclones Larry and Yasi were limited to seaward oriented properties. After assessing the residential and commercial attributes of the Mission Beach area it became evident that there were limited permanently occupied dwellings among the 42����������Planning,�building�and�insuring� �
beach front properties. These findings justified a blanket method of selection, meaning every dwelling, excluding commercial buildings and holiday houses, was approached for participation. Survey Preparation Survey packages distributed to willing participants included three sections: the residential survey, a James Cook University research information sheet and a counselling support card. The counselling card provided respondents with both telephone and internet counselling services in case they became upset or distressed while completing the survey. The counselling card was necessary as the project is classified as a category 3 research project by the James Cook University Ethics Committee. Category 3 projects can potentially cause distress to participants due to the sensitivity of the research topic. Consent to participate in the survey was automatically given by respondents upon accepting the survey pack. No other consent was necessary as no personal information was recorded. Coding Questions included within the distributed survey, aimed at documenting individual attitudes and perceptions, and incorporated answers that were of a qualitative nature. Although providing very effective insight for the researcher, it was evident that statistical analysis of participant responses was needed for a higher level of legitimacy and a greater input to the research. To ensure completed surveys revealed information that would support statistical analysis while allowing respondents to express their opinions on a qualitative level, survey questions were designed so responses could be expressed in order to accommodate both qualitative and quantitative analysis methods. This multi-strand method of analysis was considered during the survey design process as it facilitates validity amongst the collected data by allowing qualitative responses to be cross referenced against quantitative statistical data, often referred to as triangulation (Madill, Jordan & Shirley, 2000). To facilitate quantitative statistical analysis, survey responses where coded with numerical values. Each numerical value represents a particular individual response for each survey question. Questions requiring a dichotomous response (e.g. yes or no; male or female) were designated as code 1 or 2 respectively. For some difficult to answer questions that would normally yield dichotomous responses, a third “unsure” or “don’t know” option was included, and these responses coded with a numerical value of 3. Five point Likert scales were included throughout the survey to assess respondents’ perceptions of climate change and storm surge, and hazard adaptation as a tool for minimising community risk and vulnerability. The Likert scales were based on respondent perceptions of importance (e.g. 1 = very important 2 = important 3 = unsure 4 = not very important 5 = not at all important). There was one question regarding participants concerns (1 = not concerned 2 = slightly concerned 3 = no strong opinion 4 = relatively concerned 5 = extremely concerned) and another two regarding participants’ feeling towards particular statements (e.g. 1 = strongly disagree 2 = somewhat disagree 3 = no strong opinion 4 = somewhat agree 5 = strongly agree). Question 31 required the participants to record their age based on seven predetermined age cohorts ranging from 18 years old to 81+ years. Each age cohort received a code from 1 to 7 respectively. Planning,�building�and�insuring�����������43� �
Data Analysis Once the community surveys had been dispatched and collected, raw data was analysed using the statistical software package SPSS. The use of this software was needed to provide the raw data analysis necessary to better understand the community opinions and perceptions regarding coastal hazards and the coastal hazard adaptation process. Using the coded responses, each question was graphed and/or tabulated for ease of reference. Case Study Literature review The literature review provided the researcher with an opportunity to collect and interpret current information and viewpoints involving coastal hazards and the utilisation of adaptive strategies to minimise the impact of these hazards on coastal communities. The literature review provided the foundations for the research in identifying a definite need for further participatory investigation involving individual communities and governments with the processes involved in community adaptation. After enforcing the significance of the research the review focused on the different elements of community adaptation, discussing its feasibility and effectiveness as a means of minimising levels of risk and vulnerability. The review simply provided a snapshot of the current literature surrounding the topic. The literature review also provided the theoretical understanding necessary to produce both the community surveys as well as guide the researcher through discussions with the Cassowary Coast Regional Council regarding regional storm surge adaptation. Informal interviews While conducting field research in the Mission Beach area it was evident there were clear differentiations between respondents’ ages, educational level and more importantly their willingness to participate. Although the majority of potential participants approached in the area were willing to complete the surveys, there were some with health and time implications unable to participate. More often than not, residents unwilling to complete a survey were happy to be interviewed for 10 to 15 minutes in which the researcher transcribed survey questions to participants verbally. Informal interviews created an opportunity for the researcher to ask additional questions not included on the survey, including information regarding the development history of the Mission Beach area. The responses to the interviews were recorded and although the responses could not be included in the data analysis, they contributed qualitatively to the research. Of the five interviewed, two were able to contribute knowledge about the development history of the area as these respondents were amongst the first to buy and build within the Mission Beach area. Local government discussions In addition to the community surveys, a key aim of the research was to investigate local government opinions and perspectives towards adaptation as a pro-active approach to minimising storm surge risk within its jurisdiction. All three communities in the study area are governed by the Cassowary Coast Regional Council with their Local Government Area (LGA) extending north to Innisfail and south to Cardwell and Hinchinbrook. Attempts to contact the Council were undertaken with care, and with an 44����������Planning,�building�and�insuring� �
understanding of Council’s potential sensitivity to the research. Introductory e-mails were sent to Cassowary Coast Planning Representatives who politely declined any discussions with the researcher. Information given through these e-mails was of an ambiguous nature. Through academic staff at James Cook University potential key informants were contacted within the Cassowary Coast Council who were able to contribute positively to the research. Through e-mail and telephone correspondence the researcher was able to collect information that contributed to answering specific project aims. Useful information gathered through these discussions with Council were as follows: x x x
Information contributing to the mapping of the Mission Beach area’s development history and major weaknesses in early planning regimes. Current land use planning and development regulations, focusing on their effectiveness to influence current development within coastal hazard zones. How and when coastal hazard adaptation will be incorporated into the Cassowary Coast Regional Council’s land use planning and zoning regulations.
Through these important discussions with Council the researcher was able to utilize both the knowledge and experience of Cassowary Coast planning staff as well as the Senior Planning Director, responsible for coordinating the region’s new planning scheme, expected to be completed in late 2012. Research limitations The destructive power and sheer size of Tropical Cyclone Yasi left many coastal communities devastated throughout the Cassowary Coast region. Of these communities, Hinchinbrook, Cardwell, Tully Heads and Hull Heads were significantly affected by storm surge, with many families left without housing or belongings. This level of devastation not only provided motivation for further research into storm surge adaptation, but also a major research limitation. Study area selection was a vital part of this project as it was imperative to conduct research in an area that had recently been impacted by a storm surge. Ideally, the study area would have encompassed the Mission Beach area as well as the Tully Heads and Hull Heads communities, although ethical considerations had to be taken into account, restricting site selection. Due to the level of emotional trauma experienced by residents throughout the Tully/Hull Heads communities, the researcher was advised to restrict the study location to the Mission Beach area as it had only sustained moderate storm surge damage. The likelihood of qualitative research in the area causing further emotional trauma was therefore significantly reduced, leading to the successful approval for research by the James Cook University Ethics Committee. Although the three communities within the Mission Beach area provided the researcher with an appropriate study location, the inclusion of the Tully/Hull Heads communities would have allowed the researcher to gauge the opinions and attitudes of residents severely affected by storm surge. The destructive power of the storm surge caused by Tropical Cyclone Yasi can be seen below in Figure 5.1.6.
Planning,�building�and�insuring�����������45� �
Figure 5.1.6 Tully Heads - devastated by the Cyclone Yasi storm surge Image: David King, 2011 While conducting field research, in particular distributing and collecting community surveys, multiple limitations were encountered. Household selection within the three coastal communities was restricted as it was only properties that had absolute beach frontage or esplanade frontage that were targeted for the research. Of these properties, approximately 62% were either vacant or being rented as holiday accommodation, making them automatically unsuitable for recruitment. For this reason, a blanket method of recruitment was adopted with every suitable beachfront property invited to participate. The presence of high-rise or private apartments further restricted survey distribution as many are gated and were inaccessible to the researcher at the time of distribution. Private property signs and dangerous dog signs, though few, were also respected by the researcher. Questions 2 and 3 of the survey provide a limitation of sorts. The questions ask respondents to identify whether or not they were adversely affected by storm surge before asking them to identify how they were affected. The survey provided a predetermined list of potential impacts experienced as a result of storm surge such as inundation, evacuation and household contents damage. While answering these questions, respondents had the opportunity to over-state the surge damage they sustained during cyclone Larry/Yasi. Research limitations are inevitable when trying to obtain information regarding a controversial, sensitive issue like storm surge damage, especially from a government body like the Cassowary Coast Regional Council (CCRC). The Cassowary Coast region experienced extensive damage during Tropical Cyclone Yasi. As a result (as noted above), planning officers at the CCRC initially declined involvement with the research project due to the sensitive and controversial nature of the topic. Fortunately James Cook University links with Cassowary Coast Planning staff allowed the 46����������Planning,�building�and�insuring� �
researcher to obtain the necessary information needed to continue with the project. CCRC is currently drafting a revised planning scheme following the amalgamation of the Cardwell and Johnstone Shire offices. Further details regarding what the Council’s hazard adaption strategy will include would have been beneficial to the research.
5.1.15 Results Mission Beach settlement, planning & development history This section of the report explores the planning and development history of the Mission Beach area. Investigating the planning and development history of the area is an appropriate step in identifying prior weaknesses in historical planning regimes responsible for allowing the development of vulnerable coastal localities. Due to the somewhat cloudy documentation regarding the history of the area, the majority of information is based on informal interviews with community residents and discussions with Cassowary Coast Regional Council planning representatives. Historic literary sources are cited where available. The European settlement history of the Mission Beach area dates back to the early 20th century. Banana plantations provided an economic basis for settlers as well as employment for Aboriginal labourers throughout the Tully River region. Opium addiction and ongoing conflict with European settlers eventually led to the development of the first piece of infrastructure in the area, an Aboriginal mission. It was this mission that would eventually give the area its name. In March of 1918, a category 4-5 cyclone crossed the Mission Beach coastline, destroying the mission. The mission was never re-established, instead land was ‘allocated’ and farmed for timber and livestock production. Relevant minutes of Johnstone Shire Council meetings document the establishment of the El Arish to Bingil Bay road as the first major influence on the development of Mission Beach (James Cook University, 2004) Major stakeholders including Peter Wheatley eventually realized the potential for financial gain and subdivided their land. This included beachfront acreage and spurred the population growth within the Tully region in the 1940’s/1950’s. Paul Sabadina, a local builder and subsequently one of the first to buy and build in the Wongaling Beach area described the process as rather unrestricted because there were no planning or building regulations in place at that time. Subdivided blocks in the area sold fast as they were, on average, $100 to $150 dollars cheaper than blocks of land in Tully. Subdivision continued throughout the three communities, increasing the availability of affordable beach frontage which further fuelled population growth in the area. According to Nott et al. (2009) the sand and pumice ridge found throughout the South Mission and Wongaling Beach areas was formed during surges created by the 1918 cyclone responsible for the destruction of the Aboriginal mission. This sandy pumice ridge has supported beachfront infrastructure since the early 1950’s, and today still supports extensive housing. The fact that development took place on a geological structure created by storm surge from a previous cyclone is an indication of the lack of regard for coastal hazards during the areas early development. Economic growth during the 1950’s and 1960’s saw the continued expansion of the three communities in the Mission Beach area. Throughout the 1970’s, former premier Joh Bjelke-Petersen’s thirst for economic growth and prosperity continued to Planning,�building�and�insuring�����������47� �
encourage the region’s development. The pro-development Bjelke-Petersen government worked closely with property developers widely responsible for the development of resorts, hotels and residential allotments in the Mission Beach area. Research into the development history of the area uncovered a past clearly lacking the coastal planning and development restraints necessary for managing risk and vulnerability in storm surge prone areas. Like many other coastal communities, the area underwent an early urban transformation with little to no consideration for the implications of development within coastal hazard zones. Appropriate building conditions, such as design codes, dwelling height regulations, and set back specifications were non-existent during the area’s early development. In addition, informal discussions with Mission Beach residents and displaced Tully/Hull Heads residents uncovered a lack of informed risk for property purchasers. Informed risk is extremely important as it allows potential stakeholders to consider their personal risk before buying coastal property. McGranahan, Balk & Anderson (2007) explain how these historic shortcomings, or legacy issues, allowed structurally inappropriate development to occur in storm surge prone areas. Prior to the council amalgamation in March 2008, Mission beach shared its jurisdictions between two shire councils: the Cardwell Shire included the South Mission and Wongaling Beach communities while North Mission was governed by the Johnstone Shire office. Both councils implemented planning schemes in 2005 with the implementation of the Queensland Integrated Planning Act 1997. Although both schemes took into account coastal hazards, particularly the Cardwell shire, there were still clear knowledge gaps regarding climate change and its projected impact within coastal zones. Local government roles and perspectives As the local governing body for the Mission Beach area, the Cassowary Coast Regional Council has the responsibility of influencing current and future development throughout the region, including its vulnerable coastlines. Through current land use planning and zoning regulations found within the Council’s governing laws and by-laws, development throughout the region’s coastal zones and low lying areas is assessed based on its location with respect to height above sea level. The Cassowary Coast Regional Council (CCRC) is the product of an amalgamation of the Cardwell Shire and Johnstone Shire in March 2008. Currently, the CCRC is using the Cardwell Shire planning scheme to assess development within the region, including building projects within coastal hazard zones and low-lying areas. The Cardwell Shire planning scheme will be in effect until the region’s new planning scheme is implemented, with completion expected in late 2012. Through key informants within the Cassowary Coast planning office, it was confirmed that until the new planning scheme is implemented, any development located in areas at risk to coastal hazards, in particular storm surge, are assessed under the current Cardwell Shire planning scheme. Within the scheme, coastal development is self assessable or code assessable under the Natural Risk & Hazards Overlay found in Part 8, Section 8.3 – Overlay Codes. The section of code applicable to development within Storm Surge prone areas is shown in Table 5.1.2. 48����������Planning,�building�and�insuring� �
Table 5.1.2: Natural Risks and Hazards Overlay Code – Storm Surge Overlay Applicability and Level of Assessment
Specific Outcome
Probable Solution (for self assessable development the ‘probable’ solution is the ‘acceptable’ solution)
Trigger 1 - Storm Surge
Assessable development for a material change of use of premises, reconfiguring a lot and carrying out building work on land or a portion of the land proposed to be developed is less than 3.5 metres AHD as identified on map 16-18 inclusive is Self Assessable in accordance with the provisions of this Code.
The location and floor levels of proposed developments are not to compromise the safety of people and property as a result of vulnerability to storm surge.
a) no building work other than for a Class 10 building/structure is to occur on land below RL 3.5 metres
b) minimum finished floor height of residential buildings is to be 300 millimetres above RL 3.5 metres or for commercial or industrial buildings 150 millimetres RL 3.5 metres AHD.
(Source: Cardwell Shire Council Planning Scheme, 2011) As shown in the above section of code, no building work other than for a Class 10 building/structure is to occur on land below 3.5 metres. Classified by the Queensland Building Services Authority (QBSA), a Class 10 building is any building which is noninhabitable. This code is only applicable to proposed development situated less than 3.5 metres above Australian Height Datum (AHD). Coastal land situated less than 3.5 metres above AHD is considered to be at high risk to storm surge, automatically making it unsuitable for residential development. Despite the presence of these restrictions, development has occurred below 3.5 AHD. This could be due to previous lenient planning regulations. In addition, code requirements are quite lenient for coastal development that meets the prerequisite of being more than 3.5 metres above AHD. The code contains no more than two requirements in which residential buildings must have a finished floor height of 300 millimetres above Relative Level (mean sea level) and for commercial buildings, 150 millimetres. In addition to the development codes, the Cardwell Shire office created Storm Surge Overlay Maps for both the South Mission and Wongaling Beach areas figures 5.1.7 and 5.1.8. Currently no storm surge overlay maps exist for the North Mission area due to gaps in the Johnstone Shire Council’s planning scheme. Planning,�building�and�insuring�����������49� �
Figure 5.1.7 Natural Risk & Hazards Overlay – Storm Surge (Wongaling Beach) (Source: Cardwell Shire Council Planning Scheme, 2011)
50����������Planning,�building�and�insuring� �
Figure 5.1.8 Natural Risk & Hazards Overlay – Storm surge (South Mission Beach) (Source: Cardwell Shire Council Planning Scheme, 2011)
5.1.16 Adaptation in Future Land Use Planning A key aim of this research was to investigate the inclusion of hazard adaptation within the new Cassowary Coast planning scheme. In order to address this, it is important to know if, when and how adaptation will be incorporated within the region’s planning instruments. As discussed earlier, the CCRC is currently drafting a revised planning scheme following the amalgamation of the Cardwell and Johnstone Shire offices. In April 2011, the Queensland Government released the much-anticipated state coastal planning policy, known as the Queensland Coastal Plan (QCP). The QCP represents Planning,�building�and�insuring�����������51� �
the culmination of a three-year statutory review process of the former Coastal Management Plan (Queensland Coastal plan 2012). State Planning Policies (SPPs) influence the policy outcomes and requirements of Local Government Planning schemes, with the QCP showing a particular focus on sustainable coastal development, especially in coastal hazard zones and low lying areas. To determine the applicability of the Queensland Coastal Plan to the new CCRC planning scheme, the policy’s guidelines were consulted. Within these guidelines, Part B – Application of the policy (State planning policy guidelines), outlines the state policy’s relevance to the future CCRC planning scheme. Section B.2 provides that: B.2 The SPP has effect when a local planning instrument is made or amended, when development applications are assessed and when land is designated for community infrastructure. The policy would also be used to influence State planning instruments. The SPP therefore continues to have effect even when a local planning instrument is made or amended, and will bind the planning scheme currently being drafted for the CCRC. In other words, the new planning scheme must include the provisions set out in the QCP, including those regarding development in coastal hazard zones and low lying areas. With a high consideration for climate change and its effects on coastal communities, the QCP recognizes the need for adaptation to be incorporated into future coastal planning regimes in order to minimise the influence of future extreme events Part C-1. Land-use Planning (QCP) introduces the concept of coastal hazard adaptation. The state’s land-use planning policies regarding coastal hazard adaptation as they appear in the Queensland Coastal Plan, 2011 (part C) are set out below: Policies 1.6 Local planning instruments are to incorporate a coastal hazard adaptation strategy (adaptation strategy) for urban localities that are projected to be within a high coastal hazard area between the commencement of the SPP and the year 2100. The adaptation strategy is based on an assessment of the mitigation options that will mitigate the hazard, including retreat, avoidance, and defence, and a cost-benefit analysis to determine the most cost effective work or actions, taking into account longterm social, financial and environmental factors. 1.7
The adaptation strategy is to describe the:
a) mitigation works or actions to be undertaken to mitigate the coastal hazard b) cost of undertaking the works or actions c) funding scheme or arrangement that will be established to pay for the works or actions to be completed d) timeline for the commencement and completion of the mitigation works or actions. 1.8 The adaptation strategy is to be incorporated into a local planning instrument for the relevant high coastal hazard area.
52����������Planning,�building�and�insuring� �
In association with the coastal hazard adaptation strategy mentioned in the above sections of the Queensland Coastal Plan, the Department of Environment and Resource Management (DERM) has been tasked with generating coastal hazard maps for all coastal zones throughout Queensland. The hazard maps will be used to identify coastal areas predicted to be at high risk of permanent inundation from climate change induced sea level rise, and temporary inundation from future storm surge events. The maps will assume a projected sea level rise of 0.8 metres and a 10% increase in the intensity of tropical storms and cyclones. Future climatic projections are incorporated into the hazard mapping, as overlay maps must include areas of land predicted to be in a coastal hazard zone between 2011 and 2100. Discussions with Cassowary Coast Regional Council planning representatives confirmed the incorporation of coastal hazard adaptation into the expected planning scheme; although they were unable to comment on the particulars of the adaptation strategy. Cassowary Coast Regional Council are currently awaiting the completion of the hazard mapping for their jurisdiction. Community Survey Results Adger et al. (2003) note that for proactive capacity building and adaptation to occur there needs to be strong support from those at risk. As a result, 50 surveys were distributed amongst three communities within the Mission Beach area, with a view to better understanding residents’ opinions and attitudes towards their vulnerability to storm surge, and the idea of community adaptation as a tool for minimizing future risk. These locations were North Mission Beach, Wongaling Beach and South Mission Beach. Survey response rates The response rates for each of the three communities are indicated in Table 5.1.3. Fifty surveys were distributed, and of these, 43 were returned completed. Therefore, the overall return rate was 86%. The positive survey return rate can be attributed to the distribution method and interest in the topic. Hakim (1987) states that if the survey participants are notified by the researcher that surveys will be collected at an arranged time, they are more likely to complete the survey compared to survey distribution methods such as mail drops.
Table 5.1.3: Response Rates for the three communities of Mission Beach Community
Number Returned
Response Rate
North Mission Beach
13 / 15
86%
Wongaling Beach
19 / 20
95%
South Mission Beach
11 / 15
73%
Planning,�building�and�insuring�����������53� �
Demographic Characteristics of survey participants In order to gain an understanding of the demographic characteristics of those who participated in the survey, demographic questions were included within the survey. Questions 1, 29, 30, 31 and 32 related directly to participant age, gender and living arrangements. The results show that the responses collected were from residents with widely varying demographic characteristics. The results of the demographic analysis suggest that the majority of participants were between the ages of 31 and 60 (Figure 5.1.9) with the highest age cohort being 41-50. The majority of respondents were male (60%), making it skewed on the basis of gender, and had lived in the Mission Beach area for five or more years and either owned (58%) or mortgaged (35%) their beachfront property. The majority of households contained couples only (44%) with 21% of households having three occupants and 16% having four. Interviews and conversations undertaken during survey distribution and collection suggest that generally, senior couples consulted each other while completing the surveys, which to some degree mitigates the under-representation of women in the surveys. Figure 5.1.10 also shows the length of residence of participants, mostly longer term, and figure 5.1.11 the number of persons per household, a fairly typical mode of two.
Figure 5.1.9: Age Profile of Research Participants at Mission Beach
54����������Planning,�building�and�insuring� �
Figure 5.1.10 : Length of Residence of Research Participants at Mission Beach
Figure 5.1.11: Number of household occupants/research participants Mission Beach
5.1.17 Storm Surge Influence on the Mission Beach area When interpreting the perspectives of residents threatened by recent storm surge as well as their attitudes towards ‘coastal hazard adaptation’, it is important to document their recent experiences with the hazard. Questions 3 and 4 were included so respondents could first identify whether, in their opinion, they were adversely affected by recent storm surges, and secondly, to what degree. Question 4 allowed respondents to circle responses from a list provided in the survey showing various consequences of storm surge. The list included: inundation, evacuation, beach sand displacement, property erosion, insurance implications, structural damage, property devaluation and household contents damage. Forty three residents completed the survey, and of these, 77% stated they were adversely affected by recent surges while the remaining 23%, in Planning,�building�and�insuring�����������55� �
their opinion were not affected. As shown in Table 5.1.6 (below, p.52), of the 8 impacts listed, the most commonly experienced were inundation, evacuation, beach sand displacement and household contents damage. These findings are consistent with the expected impacts of storm surge on properties with absolute beach or esplanade frontage.
Community Background knowledge An important aim of the survey and an underlying goal of this research was to investigate residents’ levels of background knowledge regarding storm surge science and the risk involved with living on an unpredictable Queensland coastline. Questions 6, 8 and 9 were included in the survey to document residents’ knowledge regarding storm surge prior to building or purchasing their beachfront property. Question 7 related directly to respondents’ perceptions of storm surge as a significant threat to coastal communities while question 23 gave respondents a choice as to what they believed was a 1 in 100 event. Question 23 was included in the study because it is quite important to document knowledge regarding the ‘1 in 100’ year event classification which directly relates to current policies, regulations and guidelines that govern development and growth in coastal zones and low lying areas. It is unwise to assume that those living in coastal areas have a substantial knowledge base regarding hazards such as storm surge, or that they take this knowledge into account when choosing a residence. The community surveys identified clear knowledge gaps. Responses to Question 6 suggest that over one-third (37%) of respondents were not aware of the dangers associated with storm surge prior to living in the Mission Beach area. However, over half (54%) of respondents did not consider the implications of storm surge when building or buying their beachfront properties (Table 5.1.4). A total of ninety percent of respondents either agreed (59%) or strongly agreed (31%) that storm surge was a significant threat to their coastal lifestyles, showing a clear consideration post Tropical Cyclones Larry and Yasi for the coastal hazard. Despite this, from Question 9 it appears that 44% of respondents were unaware that storm surge, under the right conditions, can easily exceed high tide and king tide indicators. Table 5.1.4: Hazard perspective of respondents at Mission Beach (percentages) Q.3: Were adversely affected by storm surge
77
Q.6: Prior knowledge of coastal hazard threat in Mission Beach area
63
Q.8: Did you consider the implications of storm surge and coastal erosion prior to renting/buying your esplanade property?
46
Q.9: Understood storm surge could exceed high tide and king tide
56
Q.11: Given your time over would you still choose to live at your beachfront property
84
56����������Planning,�building�and�insuring� �
Table 5.1.1 then records the actual impacts of storm surge on residents and table 5.1.5 the consequent perception of storm surge threat.
Table 5.1.5: Storm surge impacts experienced by respondents at Mission Beach Impacts & Number of Households/Community
North Mission Beach
Wongaling Beach
South Mission Beach
Inundation
7
13
7
Evacuation
8
12
7
Beach Sand Displacement
4
15
8
Property Erosion
2
4
2
Structural Damage
3
5
4
Contents Damage
7
9
4
Insurance Implications
5
6
2
Property Devaluation
1
3
5
Note: 9 survey participants stated their properties were not adversely affected by storm surge.
Table 5.1.6: Perspectives of Storm Surge Threat at Mission Beach (N=43) (%)
Question 7: how do you feel about the following statement? “Storm surge events, produced during tropical storms and cyclones pose a significant threat to the livelihoods of coastal residents through property destruction, loss of income and potential loss of life.” Frequency
Percentage
Strongly Disagree
1
2%
Somewhat Disagree
1
3%
No Strong opinion
2
5%
Somewhat Agree
23
59%
Strongly Agree
12
31%
Planning,�building�and�insuring�����������57� �
What is most interesting is that despite the knowledge and perceptions about storm surge hazard, as shown by the responses to Question 11, 84% of respondents, if given their time over, would still choose to live in the Mission Beach area. This perception may be mediated by the predominant belief that tropical storms will occur only once in a hundred years, despite recent experiences. Perspectives on Coastal lifestyles and Climate Change As part of this study respondents were asked to give their opinions on climate change and its impact on the occurrence of coastal hazards. As a major influence on future coastal hazards, it is necessary to understand local reactions to the possibility that climate change may alter their future lifestyles. Gauging community reaction to the reality of climate change will help in determining the potential for individual households to adopt coastal hazard adaptation strategies. Question 23 shown in table 5.1.7 provided respondents with two options regarding the correct meaning for the 1 in 100 year storm classification in which 67% of respondents were incorrect. Only 33% chose the correct meaning, that there is a 1% chance of a cyclone of that magnitude (category 4-5) occurring every year.
Table 5.1.7: Knowledge Regarding 1 in 100 Year Events Question 23: Which of the following do you believe best represents what a 1 in 100 year storm event is? Response A: That a storm/cyclone of this magnitude will only occur once every 100 years. Response B: There is a 1% chance of a storm/cyclone of this magnitude occurring every year. Frequency
Percentage
Response A
29
67%
Response B
14
33%
Question 13 (Table 5.1.8) was included to determine how naive respondents were to the possibility of higher than normal return periods under the influence of climate change. Results indicate that 86% of respondents believe another major storm surge will occur within the next 10-20 years, suggesting a definite consideration for future events. Climate change is steadily becoming a major focus for coastal zone management through all tiers of government.
58����������Planning,�building�and�insuring� �
Table 5.1.8: Opinions on Future Surge Occurrence Question 13: Do you believe there will be another major storm surge event within the next 10 – 20 years? Frequency
Percentage
Yes
37
86%
No
6
14%
To further determine community concern regarding climate change, question 25 was included within the survey. Respondents were given a choice of 5 Likert scale responses ranging from ‘Not Concerned’ to ‘Extremely Concerned’. As shown in Table 5.1.9, 41% of respondents were not concerned about climate change in any way, 8% had no strong opinion on the subject and the remaining 48% of respondents ranged from being slightly concerned (20%) to relatively concerned (28%). Of the 43 people surveyed, only 1 respondent stated they were extremely concerned. Part C provided respondents with questions regarding the three aspects of coastal hazard adaptation as mentioned above. The questions are both Likert Scale and dichotomous (Yes or No). Due to the high number of Likert style questions, only those showing significant or important results are shown. The three types of adaptation processes (retreat, protect, accommodate) have been separated for ease of reference.
Table 5.1.9: Levels of Concern about Climate Change Question 25: To what degree are you concerned about climate change, especially living so close to a North Queensland coastline? Frequency
Percentage
Not Concerned
16
41%
Slightly concerned
8
20%
No Strong Opinion
3
8%
Relatively concerned
11
28%
Extremely Concerned
1
3%
Planning,�building�and�insuring�����������59� �
Retreat Due to the controversy surrounding the option of abandoning or relocating coastal infrastructure it is important to consult those who are likely to be directly involved. Question 16C asked residents to rank the importance of various retreat strategies. The results, shown in Table 5.1.10, suggest that 48% of respondents did not believe retreat to be an important strategy while 16% were unsure. This demonstrates that among respondents there is very little support for the concept. Regarding property buy-back schemes, 65% of respondents ranked the idea as unimportant with a remaining 5% being unsure as to what they believed. To measure levels of resilience and further confirm the above results, question 21 (Table 5.1.12) asked respondents to indicate whether they were likely to relocate in the future to minimize or negate their risk and vulnerability to coastal hazards like storm surge. High numbers of respondents (81%) stated they would not be vacating their properties. When comparing responses shown in Tables 5.1.11 and 12, it should be noted that although 36% ranked retreat as an important strategy, only 19% of respondents stated they would actually be vacating their premises. Although the Mission Beach area did not experience the degree of storm surge damage sustained by other coastal communities, residents were affected sufficiently to justify the researcher asking about possible adaptive strategies. Table 5.1.10: Perspectives on Property Buy Back Question 16 (C): Property Buy back Schemes as an adaptive strategy Frequency
Percentage
Very Important
4
10%
Important
9
20%
Uncertain
2
5%
Not Very Important
12
28%
Not at all Important
16
37%
Table 5.1.11: Perspectives on Retreating Development
Question 16 (C): Retreat Development from the coast as an adaptive strategy Frequency
Percentage
Very Important
7
16%
Important
9
20%
Uncertain
7
16%
Not Very Important
7
16%
Not at all Important
13
32%
60����������Planning,�building�and�insuring� �
Table 5.1.12: Respondents Likely to Relocate Question 21: In the near future are you likely to relocate in order to decrease or negate you or your family’s vulnerability to coastal hazards like storm surge? Frequency
Percentage
Yes
8
19%
No
35
81%
Protect Protective adaptation involves the construction of structures and implementation of practices designed to increase the resilience of coastal communities while decreasing the risk associated with coastal hazards. Both questions 17B and 22 were incorporated into the community survey to help determine residents’ attitudes towards protective practices as an appropriate hazard adaptation strategy. Results show a significant overall level of support for the construction and implementation of protective works within the Mission Beach area. As shown below in Table 5.1.13, 72% of respondents ranked storm surge barriers as an important adaptive strategy. Results were similar for the construction of sea-walls with 76% of respondents stating they believed the strategy to be quite important (Table 5.1.13). Walsh et al. (2004) highlight the importance of coastal vegetation plantation to create a protective buffer against the wave energy associated with storm surge. Table 5.1.14 and 15 displays survey respondent’s perspectives on the initiative with 74% stating they believe extensive revegetation to be an important adaptive strategy. Question 22, shown in Table 5.1.16 (below), asked whether respondents believe the construction of protective structures like storm surge barriers, sea walls and the plantation of extensive coastal vegetation would alter their enjoyment of their beach lifestyle. Results suggest a largely positive response with 63% of resident’s stating it would not affect their current lifestyles. Table 5.1.13: Perspectives on Storm Surge Barriers Question 17 (B): Storm Surge barriers as an adaptive strategy Frequency
Percentage
Very Important
23
53%
Important
8
19%
Uncertain
5
12%
Not Very Important
6
13%
Not at all Important
1
3%
Planning,�building�and�insuring�����������61� �
Table 5.1.14: Perspectives on Coastal Vegetation Plantation Question 16 (C): Extensive Vegetation Plantation as an adaptive strategy Frequency
Percentage
Very Important
15
34%
Important
17
40%
Uncertain
5
12%
Not Very Important
4
9%
Not at all Important
2
5%
Table 5.1.15: Perspectives on Sea Walls
Question 16 (C): Sea Walls as an adaptive strategy Frequency
Percentage
Very Important
25
58%
Important
8
18%
Uncertain
3
9%
Not Very Important
6
14%
Not at all Important
1
3%
Table 5.1.16: Perspectives on Structures altering Coastlines
Question 22: Do you believe the construction of infrastructure such as storm surge barriers, sea-walls, increased drainage and the plantation of extensive coastal vegetation will alter your enjoyment of your beach lifestyle? Frequency
Percentage
Yes
16
37%
No
27
63%
62����������Planning,�building�and�insuring� �
Accommodate Accommodating storm surge is perhaps the most cost effective and uncontroversial approach to coastal hazard adaptation. Although seen by many as only temporary, the strategy employs minor changes to current infrastructure and practices aimed at reducing the impact of major storm surge by accommodating or allowing for the flow of surge water as well as its quick dissipation. Accommodative strategies can be implemented and endorsed by local and state governments but more importantly, by the community itself. Question 16 provided respondents with an opportunity to rank the importance of accommodative strategies that could be implemented by both themselves and by local governments. The results show an overall level of support for the accommodative strategies listed in the community survey. Raising the height of beachfront households is an important adaptive strategy for 93% of respondents, as this would allow the flow of water created by storm surge to pass under houses. Currently, land use planning dictates the minimum finished floor height for coastal development. In response to question 16C regarding changes to the requirements for finished floor height (Tables 5.1.7 and 5.1.18), 84% of respondents believed the change to be quite important. Other accommodative strategies were endorsed by respondents with 62% supporting the idea of changing the household dynamic to include bedrooms and main living areas on the second floor. In addition 66% of residents support the idea of the local government implementing drainage works throughout communities to increase the rate at which flood water dissipates.
Table 5.1.17: Perspectives on Raising Household Height Question 16 (B): Raising household height using stilts as an adaptive strategy Frequency
Percentage
Very Important
26
60%
Important
14
33%
Uncertain
3
7%
Table 5.1.18: Perspectives on Higher New House Slabs Question 16 (C): Higher House Slabs as an adaptive strategy Frequency
Percentage
Very Important
20
47%
Important
16
37%
Uncertain
4
9%
Not Very Important
3
7%
Planning,�building�and�insuring�����������63� �
Other Key Survey Results The community survey was used to gauge the opinions of those who are likely to be most affected by storm surge with an increase in both the occurrence and intensity of Tropical Cyclones due to climate change. Survey questions covered a broad spectrum of topics as was shown previously. Table 5.1.19 presents other findings of interest to the issue of hazards and climate change.
Table 5.1.19: Other key findings from the survey at Mission Beach RESEARCH QUESTION
RESEARCH FINDINGS
Do residents believe the social benefit of living directly adjacent to the coast outweighs the negative effects of storm surge created by tropical storms and cyclones?
Yes, 81% of respondents believe the social benefit outweighs the dangers and financial cost associated with storm surge.
If local or state government approached residents with a reasonable property buy-back scheme would home owners be interested?
67% of respondents stated they would have no interest, with 19% stating they would be somewhat interested and 14% strongly interested
Do residents believe Climate Change will have a negative effect on their coastal lifestyles?
Results show mixed opinions amongst residents with 19% stating it will, 41% stating that it will not have an effect and the remaining 40% stating they do not know.
Will the financial standing of residents restrict their ability to implement adaptive strategies in the future?
Yes, 65% of respondents stated that their financial situation would restrict their personal approach to adaptation
Have recent storm surges made residents consider changing their insurance options?
55% of respondents stated they will not consider changing their home and contents insurance, while the remaining 45% stated they would consider the option.
64����������Planning,�building�and�insuring� �
5.1.18 Discussion Investigations into the development history of the Mission Beach area have uncovered a degree of disregard for coastal hazards during the early planning and development of the area. Like most developed coastal regions throughout Australia, this lack of consideration has left many people and a great deal of infrastructure at risk from storm surge inundation. During the early stages of development, there were no planning instruments responsible for governing the locality and extent of private housing. The overlying focus of governmental regimes was on Queensland’s economic growth and prosperity, with little thought placed on the implications involved in developing areas that may be vulnerable to storm surge. Areas like Mission Beach were inevitable hubs for development through a combination of aesthetic value and proximity to the townships of Tully and El Arish. Population pressures and the availability of affordable land saw a steady increase in development throughout the area. Over recent decades, the sea change phenomenon (Smith & Doherty, 2006) has contributed to the area’s sustained growth, exposing more people and infrastructure to coastal hazards. As stated by Green et al. (2010), the impacts or consequences of climate change will be predominately felt throughout the coastal zone, with public and private infrastructure at an increasingly high risk of inundation. Recent damage sustained at Mission Beach has further highlighted the risks involved with living in coastal zones and low-lying areas. Through an assessment of the current Cassowary Coast Shire Storm Surge Overlay Maps, shown in figure 5.1.7 and 5.1.8 (no map available for North Mission), many properties within the South Mission and Wongaling Beach communities are at risk of inundation from surges greater than 3.5 metres above Australian Height Datum (AHD). According to Pittock and Jones (2000) it is not uncommon for surges to exceed this 3.5 metre level. This assessment highlights weaknesses within the Cardwell Shire (now the Cassowary Coast Regional Council) Planning Scheme - Natural Risk & Hazards Overlay Code with current 3.5m development restrictions underestimating the potential for significant events. Survey results further suggest high levels of vulnerability with 77% of respondents stating they had sustained storm surge damage. Although the Department of Environment and Resource Management (DERM) has yet to complete its coastal hazard mapping for the FNQ region north of Ingham, there can be little doubt regarding the classification of the Mission Beach area as a medium-tohigh risk coastal hazard zone. Community Background Knowledge In order to obtain an informative profile of the residents throughout the Mission Beach area, particularly regarding their levels of background knowledge, investigative questions were included within the community survey. As Harper et al. (2008) have noted, it is essential for communities to understand the risks associated with living on the coast, especially in an area prone to tropical cyclones. Results suggest clear knowledge gaps throughout the three communities, particularly regarding their understanding of storm surge science prior to building or buying in the Mission beach area. In addition, 37% of respondents were unaware of the dangers associated with storm surge prior to experiencing Tropical Cyclone Yasi in 2012. This knowledge gap, combined with a disregard for personal vulnerability and informed risk, may explain why 54% of respondents did not consider the risks before building or buying their Planning,�building�and�insuring�����������65� �
beachfront homes. With regards to storm surge science, 44% of residents were unaware that under the right conditions, surges can easily exceed high tide indicators by as much as 5 metres (Klein & Nicholls, 1999), as demonstrated in Cardwell during Tropical Cyclone Yasi. These results highlight a definite need for increased education not only within the Mission Beach area but throughout all Australian coastal communities, especially those in cyclone prone areas. Public education initiatives should provide residents with information regarding the potential dangers of storm surge inundation as well as vulnerability maps and evacuation routes. An example of such educational media can be seen in Cairns Storm Surge Information. This particular guide was distributed to individual households throughout the Cairns area, providing readers with information regarding storm surge science, cyclones and evacuation. This guide was a proactive approach by the Cairns Regional Council to educate those who live in vulnerable coastal areas. Community & Climate Change As indicated by Walsh et al. (2004) and Emanuel (2005), global climate change may negatively alter the intensity and occurrence of mid-latitudinal storms and tropical cyclones, thus producing increasingly severe storm surge events. This, combined with a predicted increase in mean sea level will no doubt threaten the property and lives of those living within the area. Regardless of the scientific evidence and theory supporting climate change, Grothmann & Patt (2005) explain that there will always be an element within the community who remain sceptical about the phenomenon. Results show a significant number of respondents reject the significance of climate change, with 41% stating they were in no way concerned about climate change, regardless of their beachfront localities. Many sceptical respondents noted their opinions on the survey document, with one resident writing: “...You should not assume that climate change is actually happening, I have lived here my whole life and have noticed no change in the sea level or cyclone activity...” According to Pittock and Jones (2000), a lack of regard for the implications associated with climate change may lead to issues with capacity building and maladaptation. Aspects of coastal hazard adaptation that incorporate the public, including changes to private housing infrastructure, and the community consultation processes necessary for many adaptive strategies, may be hindered by those who oppose the idea of climate change. Residents who have no concern for the phenomenon and its associated implications are less likely to support coastal hazard adaptation. This may influence the overall adaptive capacity of the communities in the Mission Beach area. Community Support for Coastal Hazard Adaptation Although results show a level of cynicism towards climate change, support for coastal hazard adaptation may be aided by the concern for storm tide inundation, with 65% of respondents stating they believe the coastal hazard to be a significant threat to their livelihoods. In addition, 86% of respondents believe there will be other major storm surge events within the next 10-20 years. It can be stated that residents have, to some extent, considered the possible implications of future surges, including the possibility 66����������Planning,�building�and�insuring� �
that they may be significantly larger. As a result, 79% agree that coastal hazard adaptation will be necessary for minimising risk and vulnerability. Each adaptive option incorporates separate but interrelated processes and practices that share the common goal of reducing vulnerability and increasing resilience within coastal zones and low lying areas. The coastal hazard adaptation strategies included in this research project will directly affect those living in beachfront localities. Community perceptions and levels of public support will ultimately affect the degree to which future adaptation occurs. Each option (retreat, protect or accommodate) incorporates strategies or practices that vary in complexity and nature with each having their own associated barriers. Gauging community and government support will help determine the likelihood of such strategies being incorporated throughout Mission Beach. According to Drabek (1986) the more a community is exposed to coastal hazards, the greater its interest in coastal hazard management. Retreat According to Adejuwon et al. (2001) and Abel et al. (2011), planned retreat is undoubtedly the most effective option for minimising risk from storm surge inundation. This strategy has nevertheless proved controversial. Throughout Mission Beach nearly all seaward land that has potential to be developed already supports some permanent infrastructure. Consequently, the more plausible (and less controversial) strategies involved with planned retreat, such as increased development setbacks, and the rezoning of coastal land (exempt from development) are automatically inapplicable. For retreat to be included as an adaptive strategy it must incorporate the more extreme (and controversial) aspects of planned retreat such as development withdrawal, relocation or abandonment, and property buy-backs. The survey results gauge negative reaction to planned retreat at 48% of respondents, who ranked the strategy as unimportant (18% were uncertain). This lack of community support was further demonstrated when 67% of respondents stated they would not be interested in any property buy-back offers, even with reasonable financial incentive. In addition, 81% of respondents confirmed they would not be vacating their properties, indicating high levels of resilience. As stated by Folke et al. (2002), high levels of resilience are often encountered throughout coastal communities recently affected by intense coastal hazards. This high level of resilience may be explained by the strong levels of ‘sense of place’ within the three communities, with 81% of respondents believing the social benefit of living directly adjacent to the coast far outweighs the negative implications of coastal hazards that they experience. Community tolerance of the risk will be a major barrier to the inception of any policy of ‘planned retreat’ within Mission beach. Despite levels of tolerance to coastal hazard, the small percentage (19%) of people indicating intention to leave is similar to that found in an earlier Mackay study (Apan et al., 2010). Although small, such a rate of out-migration may lead to a long-term decline in population. The proportion of vacant housing identified throughout the area could also indicate that a degree of retreat has already begun. As mentioned previously, a high percentage of beachfront housing was used strictly for holiday accommodation. Community surveys were not distributed to these residences as their occupants were Planning,�building�and�insuring�����������67� �
neither homeowners nor permanent residents. Although the homeowners were unavailable, their opinions towards planned retreat as an adaptive option may have been different from those who actually lived in the area. These investment homeowners may be more accommodating towards planned retreat as they are not emotionally attached to their property or its location, especially if reasonable financial incentive is provided. The decision (usually made by local or state governments) to adopt extreme retreat policies, i.e. to withdraw, relocate or abandon vulnerable coastal infrastructure should only be considered by governments after all other options have been exhausted. In addition to its contentious nature, retreat at its most extreme has economic constraints because it incorporates the abandonment of useful infrastructure as well as the monetary compensation for those who will ultimately lose their properties. The Byron Shire Council’s planned retreat model has been in effect since 1988 and should be used as an example to deter the inception of any extreme retreat strategies within the Mission Beach area at this time. Byron Bay residents at risk of losing property and assets worth millions of dollars are showing no interest in complying with the policy and have gone to great lengths to ensure the protection of their assets (Burmester, 2009). According to Abel et al. (2011), the Byron Shire’s planned retreat strategy became steadily redundant due to a weakening of the New South Wales state policy on coastal development. At present, initiatives should therefore focus on the protective and accommodative aspects of coastal hazard adaptation throughout the Mission Beach area. Planned retreat should be revisited as an option when accommodative and protective works can no longer effectively mitigate the consequences of storm surge inundation, aggravated under the influence of a changing climate. Although the Mission Beach foreshore areas are predominately developed, current risk assessment and land use planning should be used to discourage any further development within vacant foreshore localities (Abel et al., 2011). Restricting further development today will no doubt minimise the costs involved with planned retreat, should it become a feasible option in the future. Protective Adaptation The results of the community survey clearly illustrate an overall level of support for the implementation of protective structures and practices throughout the South Mission, Wongaling and North Mission Beach foreshore areas. Burton et al. (2002), describe protective adaptation strategies as an effective way to maintain coastal assets or infrastructure in their current locations, and are generally implemented in areas that are currently or projected to be vulnerable to storm surge inundation. Protective structures such as sea walls, storm surge barriers and levee banks cannot usually be approved for development without a community consultation process (Pearce, 2003). The community consultation process can easily become complex, especially when there is little public support for a proposed development; although this did not seem to be the case throughout Mission Beach. Residents were generally supportive of protective strategies included in the survey, with 72% of respondents ranking storm surge barriers as an effective strategy. Similarly, 76% support the construction of sea walls to help reduce wave energy in the event of a major surge. Walsh et al. (2004) highlights the effectiveness of extensive coastal vegetation to buffer wave energy and reduce 68����������Planning,�building�and�insuring� �
associated erosion and sediment movement. Respondents tended to support this with 74% listing a re-vegetation strategy as an important addition to the coastal hazard adaptation process. The strong support for protective works would help streamline the public consultation process, if and when the Cassowary Coast Regional Council decides to implement any defensive infrastructure throughout the Mission Beach area. Like all adaptation strategies, there are barriers to its inclusion into the region’s coastal hazard adaptation framework. Klein & Nicholls (1999) describe protective works as being extremely expensive, both during their construction stage and through ongoing maintenance to ensure efficiency. As stated previously, this form of adaptation is generally implemented in localities with a history of conservation, or areas that contain infrastructure critical to the operation or safety of a community, such as utilities or hospitals. The low population density throughout the Cassowary Coast region may create a financial barrier for such an option. Accommodative Adaptation Accommodating storm surge provides the most cost effective form of hazard adaptation. The U.S. EPA (2009) describes accommodation as works coordinated by both the government and the community allowing for the continued utilisation of infrastructure within vulnerable areas. These works include but are not limited to; increasing new house slab height, elevating housing and other valuable infrastructure, increases in drainage infrastructure, improved insurance, increased community education and changes to emergency management practices. All accommodative strategies should, in the event of a major storm surge event, positively contribute to minimising the damage associated with inundation and the intense wave forces characteristic of storm surge. The effectiveness of accommodation as an adaptive option is relevant to the level of support given by both the government and the community. Results indicate that 93% of respondents believe the elevation of valuable infrastructure (where applicable) to be an important adaptation. A further 62% or respondents support the alteration of a dwelling so that the majority of the content is located on the second floor of multi-story housing. In addition to this, 66% stated they would support council works to increase drainage capacities throughout the area. With regards to changes in emergency management such as increased education, evacuation centres, enhanced risk assessment, vulnerability maps, and improved evacuation routes, the public displayed high levels of support for all of these initiatives. Home and contents insurance is another form of accommodative adaptation. Results show that dependence on insurance is likely to increase, with 44% of respondents considering a change to their insurance policies. Although insurance is often seen as an accommodative strategy, in fact it discourages residents from actively preparing their homes for the possibility of future, more intense events. As outlined by the Department of Climate Change (2011), insurance should be used as a market-based incentive to encourage people to prepare their homes and discourage further coastal development.
Planning,�building�and�insuring�����������69� �
The implementation of accommodative strategies provides a cost-effective, transitional approach to coastal hazard adaptation, promoting public involvement throughout vulnerable communities. To allow accommodation to occur within the Cassowary Coast Region, land use plans, zoning and building codes or standards must identify and regulate development works to support an overall agenda of adaptive change. As stated by CSIRO (2011) choosing to accommodate future storm surge, especially under the influence of long term climate change, will never be a permanent solution. It does however promote risk assessment and evaluation throughout vulnerable communities. Government Support for Hazard Adaptation The Cassowary Coast Regional Council (CCRC) is to play an integral role in coordinating adaptation within the Mission Beach area. Without the support and oversight of local and state governments the likelihood of any adaptive options coming to fruition is quite minimal. As noted earlier, historical issues regarding planning considerations of coastal hazards has resulted in the presence of a substantial amount of vulnerable infrastructure throughout the Mission Beach foreshore area. In an attempt to remedy this, Pittock & Jones (2000) suggest a proactive approach (adaptation) through a series of changes to land use planning and zoning, emergency management, and the implementation of various structures, practices and policies aimed at reducing future risk and vulnerability to storm surge inundation. Discussions with council representatives have confirmed the development of a new planning scheme that will replace the existing Cardwell Shire scheme. The new scheme will incorporate reformed State Planning Policies or SPPs included in the recently released Queensland Coastal Plan (2011). The amended state planning instrument represents the culmination of a three year statutory review process of the former State Coastal Plan (2001). Major changes have been incorporated into the new State Planning Policy that will influence local planning instruments, including an increased emphasis on climate change as well as the addition of a mandatory coastal hazard adaptation plan. Discussions with Cassowary Coast planning representatives confirmed the new scheme will in fact adopt the SPP guidelines on hazard adaptation, although as noted earlier, Council was unable to comment on the planning instrument’s precise details. The QCP dictates that the coastal hazard adaptation strategy should be based on an assessment of adaptive options, including retreat, protection and accommodation. A cost-benefit analysis must be included in the strategy to determine the most costeffective works or actions, taking into account the long-term social, financial and environmental aspects of each. An effective risk and vulnerability assessment process, as well as an accurate, informative cost benefit analysis, should allow local and state governments to determine the most feasible adaptation strategies for individual communities, based on their perceived vulnerability. With cost being a major factor for many adaptive strategies, an accurate risk assessment will allow Council to allocate funding for projects in areas most at risk. These assessments will also encourage changes to previous land use planning and zoning regulations throughout coastal zones. 70����������Planning,�building�and�insuring� �
In the wake of Tropical Cyclone Yasi, the Cassowary Coast Regional Council, in association with the James Cook University Cyclone Testing Station and the Queensland Reconstruction Authority, released a set of non-statutory re-building guidelines committed to strengthening Tully/Hull Heads communities affected by intense, destructive surges. The guidelines provide information and recommendations for re-building in storm surge prone areas. Appropriately named ‘Planning for a stronger, more resilient North Queensland’, the guidelines include information regarding site planning (locating your house, landscaping and other structures), building resistance, and building design recommendations. Although seen as a reactive approach to the damage sustained during cyclone Yasi, the recommendations given within that report incorporate many of the accommodative adaptation strategies discussed throughout this research project. Although the report is based on an assessment of the Tully/Hull Heads townships, the recommendations included are applicable to all low lying coastal communities throughout Queensland, including Mission Beach. Plausibility of Coastal Hazard Adaptation The likelihood of future hazard adaptation occurring throughout Mission Beach is more than plausible. Research has identified strong community support for many of the adaptive strategies highlighted throughout this project - particularly those associated with protective and accommodative adaptation. There can be little doubt that a strong community ‘sense of place’, combined with the high degree of resilience (including Tully/Hull Heads) is directly linked to the low levels of support for planned retreat. Accompanying this public support for adaptation is a local government determined to address the issues of storm tide inundation and climate change through amended planning instruments that will incorporate and implement an overall coastal hazard adaptation strategy throughout the Cassowary Coast region. An engaged management approach to hazard adaptation and climate change has allowed state planning policies to influence the inception of adaptation into future local planning instruments. An engaged management approach will ensure continued support and funding for hazard adaptation as well as the coordination needed to implement such strategies, especially those involving the general public. Recommendations & Conclusions After analysing the results and discussion, several recommendations can be made regarding feasible adaptive strategies that may be implemented throughout the Mission Beach area. Additional recommendations are intended to further streamline the hazard adaptation process and increase the area’s adaptive capacity. The degree to which coastal hazard adaptation will be adopted at Mission Beach will be determined by two main factors. The first is the level of community and government support given for each option. The other major factor will of course be cost. Many strategies incur high costs, especially those involved with planned retreat and protective adaptation. Their implementation may not be feasible, especially in a local government area that lacks the necessary funding or the critical infrastructure to justify such costs. With these factors in mind, the more appropriate options will likely be a combination of accommodative adaptation and minor protective works. Planning,�building�and�insuring�����������71� �
Protective Adaptation A series of minor, affordable protective works should be incorporated by state and local governments in order to attempt to protect foreshore areas and minimise the impact of seawater currents and wave forces. These, however, should not be at the cost of environmental impacts of sand transport and coastal erosion. The recommendations for protective works are as follows: x
x x
Extensive re-vegetation of foreshore areas in an attempt to minimise wave forces and erosion. This may include the introduction of grasses or shrubbery, and the plantation of coastal tree species such as coconut palms and Calophyllums (Coastal Touriga) (Cyclone Testing Station, 2011). Beach sand and dune re-nourishment. The presence of sand dunes will buffer destructive sea water currents and wave forces. The construction of sea walls or rock walls along vulnerable coastal localities to again attempt to reduce wave forces and erosion and maintain natural buffer zones.
Accommodative Adaptation Choosing to accommodate storm surge, if done correctly, should minimise levels of risk whilst allowing for the continued utilisation of vulnerable coastal property. The following accommodative strategies should be pursued: x
x x x
x x x
x
Elevating vulnerable coastal infrastructure (where applicable) based on precautionary surge height indicators. Sufficient strength must be given to foundations to support the elevated infrastructure against seawater currents and wave forces. Lower levels of multi-storey dwellings should be altered (where applicable) to allow for the flow through of water and waves whilst supporting upper levels. Increasing the finished floor height or slab height of new single storey dwellings within vulnerable localities based on precautionary surge height indicators. Alter ground level infrastructure (where applicable) to repeatedly withstand seawater inundation and wave forces. This may require the use of building techniques such as reinforced concrete construction. Altering the household dynamic so that the majority of the living area and household contents are situated on the second floor of multi-storey dwellings. Increase community and household drainage infrastructure to effectively disperse large amounts of water brought forth by significant surge events. Remove all vulnerable semi-permanent objects (where applicable) such as fences, garden sheds and water tanks and relocate as appropriate to locations less vulnerable to surges Changes to emergency management practices including evacuation, early warning systems, risk & vulnerability maps, and the construction of evacuation centres or shelters.
72����������Planning,�building�and�insuring� �
Public Education There is a clear need for public education throughout the Cassowary Coast region. Public education should address knowledge gaps regarding climate change, storm surge science and the dangers associated with coastal hazards. Hazard adaptation has the ability to minimise the risk and vulnerability associated with storm surge inundation but without public support, adaptation attempts will fail. In addressing these knowledge gaps and informing residents of the benefits of adaptation, public education should positively contribute to the area’s overall adaptive capacity. Public education initiatives should aim to imprint the methods and benefits of storm surge adaptation into the minds of those likely to be at risk both now and in the future. Education media should be coordinated by the Cassowary Coast Regional Council and include any public works that may be implementing in the near future as well as adaptive strategies which residents can be involved with, especially with regards to their own properties. The benefits of coastal hazard adaptation could be promoted through several forms of popular media including, but not limited to, television, radio, newspapers, billboards, signage and pamphlets via mail. Improved risk assessment As highlighted by Burton et al. (2002), a major barrier to the inception of effective coastal hazard adaptation is the technical shortcomings of regional governments. In order for the Cassowary Coast Regional Council to coordinate and implement effective hazard adaptation strategies, accurate risk assessment must be done throughout the South Mission, Wongaling and North Mission Beach areas. Risk assessment should incorporate a precautionary approach and account for, among other things, projected climate change factors such as sea level rise and an increase in the occurrence and intensity of tropical cyclones. Although the Department of Environment and Resource Management (DERM) are currently conducting risk assessments for all Queensland’s coastal areas, a more precise, focused assessment is needed to identify specific at-risk areas throughout the Mission Beach area. While larger councils with higher population densities may be financially equipped to conduct precise risk assessments, the Cassowary Coast Council may be unable to allocate the funding and expertise needed for in-depth risk assessments throughout its jurisdiction. An application for funding from the state government or a local funding scheme may be required to support the necessary risk assessment needed to effectively identify high risk areas. Alternatively, Council could adopt a precautionary approach to risk assessment and include all beachfront localities in its coastal hazard adaptation plan. Insurance In the past, those living in vulnerable coastal localities have relied heavily on their home and contents insurance as a safety net in the event of a catastrophe. This general dependence or reliance on insurance has, if anything, encouraged development within vulnerable localities, with the ever present expectation that Planning,�building�and�insuring�����������73� �
governments or insurance industries will support those who live within coastal hazard zones. According to Smit et al. (1999), for hazard adaptation to occur with some degree of success it must work in partnership with insurance companies to discourage future coastal development and encourage hazard adaptation in already developed, high-risk areas. Linnerooth-Bayer & Mechler (2006) explain how changes to insurance policies and premiums can be used as a market-based incentive for minimising further development in hazard prone areas. Insurance options can be manipulated to benefit hazard adaptation in three different ways. These are: x
x
x
Discontinue the availability of home and contents insurance in high-risk coastal hazard zones. Although this may seem extreme, it may become a reality if and when the influence of climate change increases risk levels to a point where it is no longer viable for insurance companies to accommodate vulnerable households. This option will also encourage hazard adaptation, particularly retreat, as residents may no longer feel secure without an option to insure. Increase the cost of insurance policies within hazard prone areas. Although not as extreme as completely abolishing insurance, it will still discourage people from living in vulnerable localities and may encourage residents to adopt various adaptive strategies. Include mandatory conditions on household insurance requiring policy holders to incorporate hazard adaptation strategies on their insured properties and reward them for doing so. This will allow residents to maintain their insurance options whilst encouraging their involvement in the hazard adaptation process through a performance-based set of criteria.
Governance & land use planning State and local governments will play a vital role in the coastal hazard adaptation process. Both the state and local governments are responsible for encouraging and coordinating hazard adaptation strategies as well as increasing the overall adaptive capacity of vulnerable communities. Their role in minimising risk in storm surge prone areas extends far beyond the early stages of hazard adaptation. For adaptation to successfully minimise risk and vulnerability, local governments have a role in encouraging the implementation of feasible adaptive strategies within vulnerable communities both now and well into the future. In addition, regional land use planning and zoning regulations need to be amended and enforced to ensure a discontinuation of development in hazard prone areas. Amendments should follow a precautionary approach, incorporating data on current incidence and future climatic projections regarding sea level rise and changes in the occurrence and magnitude of extreme events. Restricting coastal development in vulnerable localities will not only alleviate future issues associated with storm surge inundation; it will also set in place foundations for planned retreat if and when this option should become feasible. An alternative approach to restricting development in storm surge prone areas is to incorporate conditions that allow for planned retreat to eventually occur, if necessary (Abel et al., 2011). For example, a development approval may be given on the 74����������Planning,�building�and�insuring� �
condition that the infrastructure is semi permanent. If and when the property reaches a pre-specified level of risk to inundation, the infrastructure must be removed or destroyed (London et al., 2009).
Conclusion A process of coastal hazard adaptation is the single most effective means of minimising the risk of storm surge inundation throughout vulnerable coastal localities. With climate change implications predicted to increase levels of risk and vulnerability within communities containing extensive beachfront infrastructure, hazard adaptation is becoming increasingly relevant within coastal zone management regimes. The incorporation of hazard adaptation within state and local planning policies will no doubt generate considerable interest, as well as controversy. The three adaptive options; retreat from, protect against, or accommodate storm surge, will each incorporate different but interrelated strategies that will directly involve community members and local governments alike. Therefore, it is imperative to understand the perceptions of and opinions about these strategies as this will ultimately contribute to overall adaptive capacity. As this research has shown, coastal hazard adaptation should and will be incorporated throughout the Mission Beach area, although the extent of adaptation is unclear at this time. This research has identified a level of support from addressing past and future issues of storm surge inundation from both Mission Beach residents and their local government. If the adaptation strategies and recommendations discussed in this document are implemented throughout the Mission Beach area it should result in an overall reduction of risk to storm surge inundation, whilst allowing for the continued utilization of vulnerable coastal areas. The Mission Beach area is not alone in its quest for resilience and sustainability.
Planning,�building�and�insuring�����������75� �
5.2 Case Study (2): Residents’ Perceptions about Adapting the Residential Built Environment to Riverine Flooding in Brisbane (January 2011). Flood proofing is not possible at the household, neighbourhood, city or catchment scale, but adaptation, potentially, is. (Doss 2011). The purposes of this research were to assess the understanding of flood risk among residents impacted by flooding and their perceptions of adaptation strategies to reduce negative impacts from flooding. The research focus was on the January 2011 flood event in Brisbane. Residents’ perceptions were examined in a framework of protecting, accommodating or retreating from probable, but uncertain, future events. Analysis of the literature showed planned retreat as the option most favoured by researchers. In contrast, protection was the option preferred by the public. Accommodation strategies are considered the most viable. There is a gap in the literature about individual perceptions of adaptation strategies which this study has sought to fill. A case study approach involving two Brisbane suburbs was chosen to identify the impacts of the January 2011 flood event, levels of awareness, resilience and respondent capacity and willingness to take action to adapt homes to flooding. The majority of respondents to the survey indicated a desire to stay. Most residents chose raising the house as the most likely adaptation action they would take, but said they would do nothing without mandatory legislation, because of cost. The riverside lifestyle overrode concerns about flood risk. Respondents showed little knowledge about the vulnerability of their property to flooding, and poor understanding of current hazard terminology such as “1 in 100 year flood”. Recommendations from this study are that adaptation strategies that are most likely to succeed should they be introduced, and work done to better engage communities to plan and prepare for weather hazard events. Adaptation strategies identified in survey data are: raising houses to up to 11 metres in height; clearly understood, available and affordable insurance policies; larger stormwater drains incorporating backflow devices; standard flood hazard risk terminology; legally enforced land use zoning to prevent development in vulnerable areas; and not building in flood prone areas. Further research is needed to explore the reasons people find some adaptation strategies to be acceptable or unacceptable over others, individual perceptions of adaptation strategies, and the importance of place attachment when residents decide to retreat or stay. Introduction Floods cover large areas and are costly, particularly when they affect people and the built environment. Australia is experiencing increasing urbanisation, a growing population and uncertainty surrounding climate change scenarios about frequency and intensity of future floods. Spatial planners need to consider how to facilitate and build safer communities. Therefore it is necessary to have a better understanding of potential flood adaptation strategies, and of individual risk. In deciding the level of acceptable risk, uncertainty exists because of the uncertainty of climate change effects. The precautionary principle should be invoked because of this uncertainty and the risks of 76����������Planning,�building�and�insuring� �
inaction (Bates 2006). This principle was derived from the United Nations Conference on Environment and Development (Rio) in 1992 and is defined as: “Where there are threats of serious or irreversible damage, lack of full scientific certainty shall not be used as a reason for postponing cost-effective measures ...” (Bates 2006). The implication is that strong adaptive action is needed to reduce negative human environmental impacts to a level that is as low as reasonably achievable or practicable (Wills 2006). This may be difficult noting the lack of reliable information about the future impacts of any adaptation strategies used (Wills 2006). Risks need to be balanced against cost and uncertainty (Wills 2006). Doing nothing has been discounted as an adaptation strategy for this research because of potentially increasing risk. This is accentuated by the extent of damage floods cause. In Australia, floods cost almost $377 million annually - 31% of the costs of all disasters as at 2007 (Bureau of Infrastructure Transport and Regional Economics BITRE 2008). This is the highest cost of all natural disasters in Australia, with the Queensland share at 124.5 million dollars (BITRE 2008). These figures now exceed the cost of fires because of recent flood events, with economic costs across Australia from floods and cyclones during the 2010/2011 summer estimated at $9 billion (Herald Sun 2011). Brisbane The Intergovernmental Panel on Climate Change Climate recently indicated that Brisbane is particularly vulnerable to climate change (IPCC 2011). Any increase in frequency or intensity of rain events is likely to cause future flood events. Here, as in most cities, the market determines housing trends, and many Brisbane residents continue to see the riverside lifestyle as ideal. This will continue to be a challenge to the effectiveness of adaptation strategies (Byrne 2011), and is worth bearing in mind as context for this case study of climate change adaption and the recent Brisbane floods. By January 13, 2011, flood water had risen across Australia’s northeast, inundating 22 towns and stranding 200,000 people, and resulting in three-quarters of the state being declared a disaster area (Queensland Government 2011). Over 87% of the Queensland population lives on coastal or flood prone areas, including the capital city, Brisbane, which was built mainly on the flood plain of the Brisbane River (Australian Government Department of Climate Change 2009). There is a long recorded history of flooding in Brisbane. Explorer John Oxley is credited with opening up the Brisbane River floodplain to European settlement in 1824. At the time, Oxley noted evidence of “an inundation too great to be a mere flood” (Australian Government Bureau of Meteorology 2011). By 1974 when Brisbane experienced the ‘memorable’ “Brisbane floods” there was already 150 year old flood data available for the region, with ten recorded major floods in that period (see Figure 5.2.1).
Planning,�building�and�insuring�����������77� �
Figure 5.2.1: Flood peaks since 1824 (Bureau of Meteorology 2011).
Height is the measure of flood severity taken for this study. Severity might also be measured in terms of monetary, environmental and clean-up costs as well as cost in human lives and indirect impacts on transport, commerce and other ripple effects (Federal Environmental Management Agency, 2011). Degree of frequency of flooding is best understood as an annual exceedance probability (AEP) or the average return interval (ARI). AEP is the probability that a flood of a designated size or larger will occur in any year, and ARI is the likely interval for the return of a flood larger than or equal to another designated flood (Australian Government Attorney General’s Department, 1998). Recurrent flooding raises concerns about continued residential development in floodplain areas and the effects of: changes to land use planning; community involvement; climate change uncertainty; current and future adaptation strategies; design standards and the willingness of residents to change. Increasingly, adaptation to floods in Brisbane, where the river catchment covers 13,570 square kilometres and the population continues to grow, is seen as urgent (Brisbane City Council 2008). The 1974 flood was seen as a wake-up call to ‘flood proof’ Brisbane with a new dam (BOM 1974). On January 24, 1974 Tropical Cyclone Wanda, a category 1 cyclone, formed off the east coast of Australia. The Bureau of Meteorology issued the following flood warning in response: “... Moderate to major flooding is occurring ... Very heavy to flood rains are expected over all tributaries of the Brisbane River in the next 24 hours ... flooding and traffic disabilities are expected throughout the Brisbane Valley and tributaries by tomorrow” (Bureau of Meteorology BOM 1974). WARNING NO 3 Renewal of Flood Warning Brisbane Valley, BOM, Brisbane, 11.00 am, Friday 25/1/74.
78����������Planning,�building�and�insuring� �
In the subsequent five days from when this warning was given, rainfall totalled 1,318mm over 5 days in the Brisbane river catchment. Twelve people drowned, 6,007 homes were flooded and $200 million damage was caused (1974 values) in the 114 hour duration of Cyclone Wanda (BOM, 1974). Cyclone Wanda caused little direct wind damage, but led to the largest monthly Australia-wide rainfall totals recorded to that time (BOM, 1974). At the time, many people could not be convinced of the seriousness of the flooding because such severe events were not within living memory, and because education was lacking. People returned to their homes to clean up, only to be flooded again, and many residents discovered that their insurance policies covered storm and tempest but not riverine flood (BOM, 1974). A review of the impacts of this flood event led to proposals by local government and water authorities to adapt the built environment to safeguard the people, houses and infrastructure in proximity to the Brisbane River floodplain. The major solution adopted by the Queensland government, with assistance from the Irrigation and Water Supply Commission, was the construction of the Wivenhoe Dam (in 1985) both for water storage and mitigation against future floods (BOM 1974). Despite the initial intent, the circumstances of the 2011 summer wet season demonstrated that the dam was only partly effective in mitigating flood impacts. Figure 2 shows extent of the 2011 flood. The 1974 situation was similar to events surrounding the 2011 flood event. Bureau of meteorology predictions were for a wetter than average wet season for eastern Australia in 2010/2011 (BOM 2011). Low intensity Category 1 Tropical Cyclone Tasha formed on 24 December 2010 during a La Niña season. Following a 10-year drought period, December 2011 was Queensland’s wettest on record and the third wettest year on record for the Australian continent (National Climate Centre 2011). This caused significant localised flooding as floodwaters reached central Brisbane on 11 January (SEQ Water 2011). The authorised release of water was seen to exacerbate a situation which, in reality, was inevitable. The capacity of Wivenhoe Dam was exceeded by 88.5% and 14,000 properties were flooded, 1,970 people were evacuated from suburbs near the river, and 94 suburbs were inundated, see figure 5.2.2. Of those affected suburbs, 35 were directly affected by riverine flooding. One person drowned and a state of disaster was declared on January 11 (Brisbane City Council 2011b). This flood was reported by a joint task force report as the second highest flood of the last 100 years after the1974 flood (Brisbane City Council 2011c).
Planning,�building�and�insuring�����������79� �
Figure 5.2.2: Extent of Inundation Caused by the 2011 Flood Event (Brisbane City Council, 2011a)
Given the history of flooding, it is not surprising that since 1965 Brisbane City Council (2011a) has regulated development in flood zones for drainage purposes. In addition, since 1974 Brisbane has had a range of planning measures aimed at flood control, as detailed in Table 5.2.1. It is nevertheless clear that further changes to legislation are needed to limit development in vulnerable areas.
80����������Planning,�building�and�insuring� �
Table 5.2.1: Brisbane Land Use Planning Triggered by Flood Events (Brisbane City Council 2011h) 1978
Town Planning maps of areas subject to flooding, minimum habitable floor level of 3.7 metres from 5/12/78, restriction on residential use policy and Administration Policy AP - 065 (October 1978) not specific to riverine flooding.
1987
Local Planning Policy 20.01 (23/6/87) Houses to be >3.7 metres AHD at 1% AEP, most house built were permitted development and did not need a development application
1996
Subdivision and development guidelines were a recommendation to have reduced impacts from flooding
2000
City Plan 2000 introduced a house code minimum floor level at the Q100 level plus 500 mms for habitable residences.
2003
Subdivision and development guidelines updated to include the Defined Flood Level
2003
SPP 1/03 introduced. Brisbane city council complies by having a Defined Flood Level. The SPP itself and the subdivision and development guidelines do not state how this will be achieved
Since the 2011 flood, Brisbane City Council has introduced a Temporary Local Planning Instrument (01/11). This planning instrument proposes raising minimum house floor heights for new construction by a metre - up to 9.5 metres in total height for a new Interim residential flood level, with 500 millimetres of freeboard (Hackett 2011)
Understanding Flooding – Major Floods, Severity and Frequency Central to understanding the need for adaptation strategies is awareness of how frequency and severity of flooding is measured as applied to the Brisbane River floodplain, and of the meaning of ‘major’ floods. Queensland government educational material (2011) explains that floods happen when water, usually from rainfall, inundates land that is normally dry. While flooding can also refer to storm surge and tidal effects, flash floods, or runoff from tributaries, this research is focussed on riverine flooding: that is, flood waters that are caused by overflow of river banks (BoM 1974) and their effect on the built environment. Riverine flooding occurs after heavy rainfall when a river can no longer contain excess water in a catchment (Middelmann 2007). The extent of a riverine flood is affected, among other things, by its size, shape and land use in a catchment (Queensland Government 2011). The Bureau of Meteorology (2011) defines a major flood as one that causes inundation of large areas and isolates settlements, while causing major disruption to road and rail links and the evacuation of many houses. This contrasts with moderate flooding and minor flooding. Moderate flooding inundates low-lying areas causing some houses to be evacuated and closes main traffic bridges. Minor roads are closed, and low-lying bridges are closed by minor flooding (BoM, 2011). Climate change effects on flooding and possible scenarios are uncertain. To minimise negative impacts, and in any case to be prepared for predictable flooding scenarios, it is clear that people need to adapt built environments. Research is needed to determine Planning,�building�and�insuring�����������81� �
the best strategies and the viability and utility of these strategies as they are understood by residents. This may help avoid the effects of repeated flood. There is a variety of adaptive strategies available which range from: do nothing; protect; adapt; and retreat. While governments may choose or recommend particular strategies, whether the public accepts these is another matter. For this reason, extensive public consultation is advisable, as it generally leads to greater community take-up of government policy. This case study investigated community views on a range of adaptive strategies, focussing on two riverine suburbs affected in both the 1974 and 2011 Brisbane floods. Research Aim and Objectives The aim of this case study was to assess individual understanding of flood risk and individual perceptions of potential adaptation strategies within the Brisbane River flood plain. This aim was to be achieved through investigating: x
Individual flood risk awareness;
x
Understanding of potential adaptation strategies;
x
Individual intentions and attitudes with respect to different adaptation options;
x
Recommend adaptation strategies that have utility and relevance to Brisbane
Methodology There are a number of gaps in existing literature about flood adaptation in Brisbane. Predominantly, not enough is known about resident perceptions of adaptation strategies for flooding, what people will consider doing to adapt to flooding, and if people will decide to self-adapt to flooding in the absence of legislation. The best way to find answers to these questions was to speak to residents of affected suburbs about their experiences and observations following the January 2011 Brisbane flood event. Planning and policy issues have arisen through the questionnaires and discussion with respondents, and have clearly informed the latter’s perception of most appropriate adaptation to flooding. This study does not, however, directly examine Brisbane’s current land use planning schema, or present comprehensive recommendations for policy or legislative amendment. These issues are covered comprehensively in the following report section: “Review of Queensland Flood Commission of Inquiry Report Recommendations” (Case Study 3, below). Suburb Selection To meet the aims of the research, it was decided that suburbs selected for research should be close to the Brisbane River and to the Central Business District – within two kilometres. Suburbs also needed to be vulnerable to riverine flooding. To be considered vulnerable, suburbs had to have been affected by floodwaters in 1974 and again in 2011, with a significant level of damage. Significant damage to a suburb is defined as half the residential dwellings in a suburb having water enter property boundaries. Brisbane City Council data from 1974 and 2011 identified 35 suburbs as being affected in this way. More heavily affected suburbs that would otherwise fit the 82����������Planning,�building�and�insuring� �
criteria were not selected because of the reduced sample size and potential emotional trauma to residents. Suburbs were assessed for closeness to each other and accessibility for survey work. Commercial precincts were not selected because preliminary interviews revealed that shop owners within these precincts generally do not live near their businesses. Having chosen Brisbane for the case study, ground-truthing (preliminary field work) was undertaken in May 2011, by speaking to local residents and viewing possible sites at random. Informal telephone conversations with Brisbane City Council staff then helped with the selection of suburbs that were flood-affected and close to each other. Informal conversations were also held with stakeholders at the Flood of Ideas Exhibition (State Library, May 2011). From this preliminary field research, Milton and West End were selected because of their proximity on opposite sides of the river and similarity in demographic profile and historical development. Kurilpa The study area consisted of Milton and West End, two older inner-city Brisbane suburbs (established in the 1880’s). Together they form a locality known as Kurilpa – (Aboriginal) “place of the water rat” (Core Logic 2011). Figure 5.2.3 shows the relationship to the Brisbane River. Both suburbs are expected to continue to increase in population as densification and infill are used to accommodate an expanding Brisbane population (Brisbane City Council 2011g). Both suburbs contain separate commercial and residential precincts separated by main roads.
Planning,�building�and�insuring�����������83� �
Figure 5.2.3: Milton and West End in relation to the Brisbane River Image: David King (Derived from ABS Statistical Local Areas and 2006 census shapefiles using CData2001) Milton Profile The population of Milton is approximately 4,366 (City Postcodes 2011). It is a hilly suburb two kilometres west of the Brisbane Central Business District and has an area of 1.2 km.2 Commercial and residential sectors are separated by Milton road and Coronation drive, which runs along the river (Core Logic 2011). Milton combines light industry, warehouses, commercial offices, retail and single and multiple occupancy buildings, dominated by town houses and a café streetscape (Core Logic 2011). Many of the residents are students or unemployed and others are professionals or managers (Australian Bureau of Statistics 2008). In 2010, the Queensland Department of Infrastructure and Planning announced a Transit Oriented Development for Milton (Queensland Government 2011). This will be integrated with the Milton railway station to improve access to footpaths, bus stations and the train station with buildings up to 30 storeys in height, changing the character of the suburb with improvements to road traffic movement around high volume areas such as Suncorp Stadium and the Castlemaine Perkins Brewery (Queensland Government Department of Infrastructure and Planning 2010). Importantly, this added built infrastructure will potentially increase flood impacts. 84����������Planning,�building�and�insuring� �
West End Profile West End has a population of 6,206 (Australian Bureau of Statistics 2011). It is a generally flat suburb 1.5 kilometres from the Brisbane Central Business District, close to universities, and has an area of 1.9 km2. West End is bounded by the Brisbane River to the west and south. West End is Brisbane’s most multicultural suburb, with significant Indigenous, Greek, Italian, Chinese (Core Logic 2011) and Gay and Lesbian communities. There is a small commercial precinct, bordering Hardgrave road, and many homes of historic value (Core Logic 2011). Young professionals and students predominate. West End is part of the Western Brisbane transport network strategy, which identifies this suburb as likely to be subject to continued population increases (Queensland Government 2011). This strategy contains 18 integrated bus, rail and road corridor improvements including high capacity trains, priority for buses with integration to rail transport, new cycle-ways, walkways and river crossings and a new motorway, all of which are designed to ease congestion (Queensland Government 2011). As is the case for Milton, these added services will result in greater potential flood impacts. Survey Development The survey was developed based on a thematic analysis approach, from themes and gaps identified in literature. This meant that the survey was divided into three sections. Questions 1 to 10 sought closed responses about flooding impact, preparedness and resilience. Open-ended questions elicited further comments about most likely choices to improve home safety from flooding. Questions 11 to 19 asked about perceptions of flood adaptation strategies as put forward by government and private agencies. In this section, a 5 point Likert scale of importance was used, where 5 = very important and 1 = not at all important. A Likert scale is useful when respondents are given a series of equally weighted response options (de Vaus 2002). All questions in this survey were weighted equally. Questions 20 to 27 were designed to test informant understanding of flood terminology and awareness of related issues such as insurance. Other questions included indicators of transience and resilience. In this section, closed questions were followed by open-ended questions (“in your own words”) to enable informants to expanded on individual experiences with comments. Questions 28 to 33 allowed a demographic profile of the two suburbs to be established, using closed questions. Demographic questions related only to study relevance, so income level was not included. The survey was created using a template online survey program and then piloted. Australian Bureau of Statistics conventions were followed for demographic questions such as age, household structure, household type and age categories. Criteria for Participant Recruitment Participants were sampled primarily on the basis of location and occupancy. They were resident in the target suburbs. Residents of Milton and West End had experience of riverine flooding and were accessible. Initial planning was for two field visits, within six months of the flood event so potential informants could still freshly recall their experiences and before the Flood Commission of inquiry findings were released. Each Planning,�building�and�insuring�����������85� �
suburb was to be visited once, with a break of two weeks so preliminary analysis could be undertaken. Survey Administration As suburbs were predetermined and the principal researcher was uncertain of occupant availability, purposive convenience sampling was used to recruit survey participants. For the first two field visits the same process was used. Every house in streets near the river was approached unless they appeared abandoned or there were dogs or no visible access. Surveys were completed with residents, and retained by the principal investigator. One day was allocated to visit each suburb. Following preliminary data analysis of these results it was decided that a further trip was warranted to increase participation rates and validity. The methodology and survey administration were adjusted for this third visit. For this visit, the direct-administration survey method changed to also include self-administration and drop-off survey methods. Recruitment was modified during the third field visit. This visit was over two days. On the first day, houses in streets that were unsuccessfully approached the first time were approached again. On the second day, respondents in low-lying streets not previously visited were selectively approached. Those living in elevated areas such as Hill End were considered not to be impacted by flooding (Hill End is 30 metres above sea level). During each visit, only one resident of each house was invited to participate. This was done to reduce bias. Respondents were approached between 9 am and 5 pm on the selected field days as there was a greater chance of people being home. Initial Field Visits As noted above, these visits were held within six months of the flood event. Surveys were directly administered by the researcher in Milton and West End on Saturdays. This meant face-to-face contact with informants. An information sheet and consent form in the standard James Cook University ethics format were used to confirm residents’ agreement to participate. Informants retained the information sheet and returned the signed consent form. The information sheet contained contact details of the principal researcher and supervisors so respondents could call to add further comments. Direct administration was useful because the broader meaning of key terms such as impact could be explained. Directly administered surveys took between 25 to 30 minutes to complete. Second Field Visit During this visit, several methods were employed. Initially, streets previously approached in the two suburbs were revisited, using direct administration. To increase response numbers, streets not previously visited were approached. During this later visit, if residents were at home they were surveyed directly. If potential respondents wished to participate but had time constraints, the self-administration method was used. A survey pack containing the survey, an information sheet tailored to this type of survey delivery and a return self-addressed prepaid envelope was left with these
86����������Planning,�building�and�insuring� �
people. If residents were not at home, the drop-off method was used with the survey pack being sealed and left at the premises. During each visit, notes were taken to record the strength of feeling about issues raised. This added to data richness. Surveys were allocated an individual identifier so the survey could be matched to the suburb it was conducted in, for later analysis. For privacy, no other identifiers were used. Data Research data were obtained from mixed methods, including primary data, secondary data and a field log. Primary data pointing to preferred adaptation strategies were derived from survey response interviews. There were 50 survey responses from direct administration and 20 responses from self-administration (n = 70). Primary data was supplemented by direct observation of flood damage and notes recorded in a field log. These notes reflect residents’ tone, manner and responses during interviews. Further information was collated from secondary sources including informal interviews, reports, Brisbane City Council and Queensland Floods Commission of Inquiry recommendations, phone calls and conversations held during attendance at events such as the Flood of Ideas exhibition (State Library, May 2011). Secondary data helped inform the framing of survey questions. Combining the three methods allowed triangulation of findings, giving greater overall credibility to the research findings (Bernard, 2002). Data Analysis Survey questions related to resident perceptions of adaptation strategies, willingness to adapt, and resilience, as per research aims. For this study, all possible questionnaire responses were coded numerically to enable analysis. Responses were dichotomous (select from two), had multiple response choices, from a Likert scale or asked for openended comments. Survey Questions requiring selection from a dichotomy of options (yes or no, male or female) included impact, insurance, awareness, knowledge and gender. These were coded, for example, as 1 for yes and 2 for no. Demographic questions asked respondents to choose from a list of responses, coded from 1 to 7. Participant perceptions were coded from 1 to 5 against a Likert scale. SPSS manuals recommend that a ‘don’t know’ response is offered to participants (de Vaus 2002). Following this practice, a code of 3 meant an ‘uncertain’ response. This indicates what de Vaus (2002) calls non-attitudes. Open-ended questions were provided for additional comments. These responses were coded as separate variables. A zero code was used when a question asking for additional comments was left blank. This lack of response was not treated as a missing value. It generally meant that informants strongly supported one adaptation strategy and no others. All responses had the same weighting. The SPSS 19.0 statistical software package was used to analyse results. Outputs from this package were bar graphs and cross tabulation, as percentages. Frequency distribution was used as an indicator of resident flood preparedness, preferred adaptation strategies and awareness. Cross-tabulation was used to answer research questions where a strong association was expected from critical reading. An example of this is the potential relationship between the decision to stay or retreat from flooding Planning,�building�and�insuring�����������87� �
and demographic data of occupation and education levels. Likert scale survey questions related to individual perceptions of residential strategies. Analysis started in 1 September 2011 when enough surveys were received that results were deemed to be indicative of resident perceptions, and outliers had been identified. Inferences could then be drawn. Limitations A disadvantage of convenience sampling is that it can lead to bias from underrepresenting or over-representing particular groups (Marshall 1996). Bias also exists because case studies provide limited data although they do highlight patterns (Seale 2004). Time constraints meant concentration on two of the 35 suburbs directly affected by riverine flooding. Survey participation was restricted to selected categories of respondents. People not yet aged 18, shop owners and residents with dangerous dogs or no access, while not approached, could have provided valuable information. The extent that the perceptions of Milton and West End residents match those of residents of the rest of Brisbane cannot be known. Residents of abandoned houses were impacted but not able to be surveyed. These are gaps because the strategies preferred by these people are not known. Future research could be designed to include these groups. The same survey was used for direct-administration and self-administration. Normally a self-administered survey needs to be short, simple and easy to understand without the need to clarify meanings (Seale 2004). For respondents who received selfadministered and drop-off surveys, the broad meaning of impact from flooding could not be explained to them. This may have led to some respondents believing they were not impacted and so not returning surveys, reducing the response rate. Also, for respondents who were not approached using direct administration there was no way to verify the appropriateness of survey completion. At the same time, results from informants approached by direct-administration may have been affected by researcher bias. Opinions and views held by the survey administrator could have been transferred, affecting the outcome. Results Survey questions on adaptation strategies were designed to identify the popular / acceptable strategies and determine importance. In each case, using coastal adaptation categories, strategies have been identified here as those that protect, accommodate or retreat as they relate to individual adaptation. Survey results are separated into categories that follow themes from the survey questions. These are impact and resilience, insurance, preparedness, adaptation strategies, knowledge and willingness to adapt. While analysis was conducted on all data, significant results have been presented graphically as either tables or graphs. Having only 70 respondents, basic cross tabulations were limited to key characteristics to identify trends. For example, there was no clear correlation between demographic characteristics and specific responses about making changes.
88����������Planning,�building�and�insuring� �
Impact and Resilience Survey questions 1 to 4 were designed to identify the rate respondents considered themselves directly or indirectly impacted by flooding, and if so, whether the event was enough to motivate them to leave. This does not ask residents to qualify the degree of flood impact and does not account for those residents who had already left as a result of the flooding. The majority of informants were impacted by flooding and indicated that they intended to stay. A small percentage (8%) planned to leave, but for other reasons such as returning to other countries after holidays. Cross-tabulation confirms the strength of this relationship, with 90% of those impacted intending to stay. Notably, this is virtually the same as for those not impacted. It is important to remember that those who are motivated to leave may already have done so. This suggests that, in general, residents will not retreat despite being impacted by flooding, and implies resilience. Reasons given by respondents include cheap rent, a strong sense of place and the ‘river city’ lifestyle. In summary, irrespective of whether or not respondents were impacted by flooding, approximately 90% would stay. Of those impacted, their reasons to leaving appear unrelated to the event. For those not impacted, there were no clear reasons given for leaving. Insurance Survey questions 5 to 8 relate to flood insurance, an ‘accommodate’ strategy, see table 5.2.3. The intent of this section of the survey was to determine the pre-existing insurance rates, adequacy of policies and the likelihood of residents insuring against riverine flooding. Survey findings were that the main mode of tenure was rental, so take-up of building insurance was not widespread. Few respondents (14%) who rented had contents insurance, and did not need building insurance. Some owners of premises did have both building and contents insurance (36%). Few people had riverine insurance before the flood event (57% were unsure) and of those who did, 14 % are not intending to upgrade to be covered for floods. Table 5.2.3: Respondents Level of Riverine Insurance and Likelihood of taking out Insurance (N=70) (percentages) Riverine Insurance
Would take out insurance
Would not take out insurance
Don’t know
Total
Have riverine insurance
8.6
1.4
1.4
11.4
14.3
42.9
57.1
Do not have riverine insurance Don’t know
8.6
5.7
17.1
31.4
Total
17.1
21.4
61.4
100.0
Preparedness Survey questions 9 and 10 sought to identify residents’ perceptions of ways that homes can become more flood resistant, as a form of preparedness for possible future events. Planning,�building�and�insuring�����������89� �
The most frequent engineering response at 16% was the ‘accommodate’ strategy, or raising the house. Over one third of respondents (36%) said that they had no idea what to do, and many (16%) would most likely do nothing. One response (building better drains) emerged in later field visits, as potential respondents absorbed media reports about backflow devices for drains. Adaptation Strategies Residential Respondents were then presented with a series of options about possible adaptation strategies people could take up themselves, and others offered by local authorities, private industry and volunteer agencies. People were asked how important or unimportant they felt these strategies were. If respondents answered ‘very important’ or ‘important’ for a variable, this was interpreted as a positive perception. ‘Not very important’ or ‘not at all important’ answers were seen as a negative perception. Both types of response were seen as significant if they were the majority. If there was no clear response, this was seen as ambivalence. At the household level, Questions 11 to 14 asked about perceptions of strategies to reduce impacts, and focused on raising levels, strengthening and avoidance, see table 5.2.4. A total of 84% of respondents felt that the ‘accommodate’ strategy (raising the house onto stumps) was either important or very important. This was a higher percentage than for other options, which were: having a flood-proof room, raising the height of the electricity meter box or having higher house slabs on the ground. There was less support for a levee, flood markers, evacuation kits, and flyovers as escape roads. Table 5.2.4: Acceptance of adapting residences (N=70) Raising house onto stumps
84
Place your meter box higher
67
An upstairs flood proof area
54
Higher house slab
43
When asked about ‘accommodate’ options to strengthen homes in question 12, no strategy dominated. Having stronger walls, a well-drained garden, flood-proof windows and doors, and flood barriers and anchoring water tanks to the ground were all supported by between 37% and 53% of respondents, but none of these were preferred above others by respondents. Respondents were least supportive of strengthening windows and doors, at 41%. In terms of ‘accommodate’ strategies, respondents were asked about strategies that would reduce the level of direct exposure to flooding, such as building back from the river, sloping their land downwards away from the house, and about putting spaces 90����������Planning,�building�and�insuring� �
between houses to allow for water to run off. No option was preferred above others. When asked if they would make any of the changes discussed, the majority (74%) of respondents said that although they supported change they would do nothing unless required to by council policy or legislation. They said that the options were too costly or that they were renting. Catchment Survey questions 15 and 16 related to identified catchment-wide adaptation strategies, specifically, planning strategies and regulation of building structures, and are summarised in table 5.2.5. The planning option considered most important, at 86 %, was not to build in flood-prone areas (a ‘retreat’ strategy). While a number of residents were uncertain about the option of building in flood-prone areas no respondents selected ‘not at all important’ for question 15. Other response options from the survey: not living near the ocean; building above the 1 in 100 flood level; changes to land-use zoning laws; spaces between houses for water runoff; denser population settlement in flood-free areas; and having an upstairs flood-proof room were seen as less important. Some additional valuable strategies emerged from Queensland Floods Inquiry interim findings that also had the support of informants. These were: improved operating manuals and revised peak discharge standards for dams; enforced, permanently flagged development exclusion zones; a full hydrological survey of the catchment flood plain and adjacent flood fringe to assist mapping capability; flood proof exit roads allowing for more effective planned retreat; and standards to retrofit existing housing stock. Table 5.2.5: Perceived importance of planning strategies (N=70) (percentages) Not building near the ocean
39
Not building in flood prone areas
86
Building above the 1 in 100 year flood level
77
Changes to land use zoning laws
61
Spaces between houses for water runoff
59
Denser population in flood free areas
41
Upstairs flood proof rooms
40
When asked about structural or engineering solutions for the catchment – wide environment built environment in question 16, the preferred choice was for improved storm water drainage (to accommodate), with 76% of respondents viewing this as important or very important (see Table 5.2.6). Again, while there was a level of uncertainty, no respondents thought this option to be ‘not at all important’. The lack of Planning,�building�and�insuring�����������91� �
backflow devices in stormwater drains only came to prominence during the third field visit when media and flood inquiry focus was on this issue. Seen as less important were: building more dams with a single point for decision making; having levee banks and flood gates; limiting infrastructure on the Brisbane River; and having more urban drainage lines and collection reservoirs.
Table 5.2.6: Acceptance of catchment-wide adaptation strategies (N=70) (percentages) Stormwater drains
76
Limited infrastructure
67
Levee banks
45
Collection reservoirs
44
Flood gates
40
More dams
31
City With respect to city-wide adaptation strategies, Questions 17 and 18 referred to recommendations provided by local authorities, private industry and hazard managers in Brisbane, see table 5.2.7 and 5.2.8. For local authority initiatives (Question 17), the strategy preferred by respondents (93% ‘important or very important’) was better warnings, including: verbal contact; better flood maps and improved hazard and risk maps (another ‘accommodate’ strategy). Contingency funds and buy-back were the least popular options for respondents. Comments implied that such contingency funds went to the wrong people. Options that were seen as less important were: building homes half a metre higher; the flood-proofing of access roads; increased numbers of flood evacuation centres; and more awareness campaigns at the start of the wet season; such as the ‘Get Ready Queensland’ campaign mentioned earlier. A summary of field diary comments revealed that few suburban flood markers, insufficient flood proof escape roads and unavailable universal insurance, confusing flood hazard terminology, inadequate mapping, lack of full property disclosure about flood vulnerability, and conflicting communication across Brisbane without full use of social media potential, were also barriers to adaptation. Residents are seeking a more coordinated approach to mitigating negative impacts of natural hazards. This reflects some feelings of helplessness that were expressed. The Queensland Police Service Facebook page was regarded by respondents as a very effective use of social media in helping with understanding of individual flood risk.
92����������Planning,�building�and�insuring� �
Table 5.2.7: Perceived importance of local authority strategies (N=70) (percentages) Build half a metre higher
61
Buy-back of vulnerable houses
50
Flood-proofing access roads
83
Making flood maps better known
89
Flood evacuation centres
67
Better communication about warnings
93
Contingency funds
58
Better hazard and risk maps
91
Awareness campaigns at the start of the wet season
63
For strategies offered by private industry and emergency management in Brisbane (Question 18) the most important considerations for respondents were affordability, availability and clearly defined insurance and evacuation plans. No respondent saw insurance liability changes as ‘not at all important’ or ‘not very important’. Improved insurance was seen as the preferred long-term security solution to ‘accommodate’, with 87% ‘important’ or ‘very important’. Better insurance is the indicator that this study identifies as the preferred option for respondents overall. Other less preferred options were: having improved community emergency evacuation plans; more use of neighbourhood flood committees and of social media; and individuals taking on more responsibility to act. Table 5.2.8: Perceived importance of emergency management strategies (N=70) (percentages) Community emergency evacuation plans
88
Insurance liability changes
88
More use of social media
71
Individuals taking more responsibility
63
Neighbourhood flood committees
40
Planning,�building�and�insuring�����������93� �
Knowledge Survey questions 20 to 27 related to knowledge and understanding of key adaptation issues. Most respondents had lived in Milton or West End for 2 to 5 years and in Brisbane for more than 15 years, and most people were not in Brisbane during the last major flood event in 1974 (81%). All respondents (100%) thought there would be another major flood in Brisbane within the next 50 years. Having established personal backgrounds and Brisbane flood experience, those surveyed were then asked if they understood the meaning of a 1 in 100 year flood and how to find out about the vulnerability of their residence to flooding. Over two-thirds of the respondents said they knew how to define a 1-in-100 year flood, but only 10 % of these were able to provide an accurate meaning. According to 70% of respondents, direct telephone communication with the local council or internet resources were the most common ways of ascertaining residential site vulnerability, summarised in figure 5.2.4. Despite the variety of available information sources, 16% said they still had no idea how to find out about their personal levels of exposure.
Figure 5.2.4: Ways identified to find flood information
Willingness to Adapt The majority of respondents (74%) indicated that they would not self-adapt to flood risk. Reasons given for this include cost, renting rather than owning and a preference to do nothing because it is not their responsibility. Discussion “I’m not going to do anything, that’s what the council is for”- (Respondent 45 2011, pers. comm., 7 August) Research aims for this study were to assess individual understanding of flood risk and of potential adaptation strategies, and to assess if and how Brisbane residents intend 94����������Planning,�building�and�insuring� �
to adapt. Key issues identified in the survey results can assist in providing a better understanding of individual adaptation in the flood context. Reflecting the presentation of results, these issues include impact and resilience, insurance, preparedness, preferred adaptation strategies and knowledge. Impact of Flooding and Resilience “I know that this house has been flooded four times, but it makes no difference to me. The river is what Brisbane is all about” – (Respondent 5 2011, pers. comm.., 4 June) For this study, impact from flooding was broadly defined to include loss of property and income and isolation stresses as well as inundation. Despite some residents experiencing all of these effects, survey responses strongly indicate that residents have chosen to stay and restart. They further show that those residents who intend to leave are not doing so because of the flood event. This apparent resilience to recent flood adversity suggests that adaptation does happen at the community level. Insurance “I thought I had riverine insurance, now I wish I did” – (Respondent 20 2011, pers. comm., 4 June) Improved residents’ understanding of their insurance cover, and availability and affordability of policies for the appropriate level of cover in geographical areas at risk, is needed to support land use zoning to exclude development from vulnerable zones (Council of Australian Governments 2004). At issue is insurance industry reluctance to insure those at greatest risk (Smith & Handmer 2002). Many survey respondents did not know if they had riverine insurance, or felt that it was unaffordable. One resident contacted the principle researcher by telephone after the survey administration period and commented that they had contents insurance but the flood was not a ‘defined event’ according to their policy, so insurance was ineffective. This informant had received $1,000 in flood relief but was eligible for no other financial support because they rented. This illustrates the challenge for residents attempting to engage their insurers as a means of adaptation to future flood events. Preparedness “The only real strategy is to build higher. I am trying to do that but the new flood height is much higher than my lowest floor level and my application has not been allowed... I’m going to buy a boat” – Respondent 31 2011, pers. comm., 18 June) This respondent showed confusion and frustration with new building height regulations, having sought approval to raise the height of their home, received approval, then been refused as the height of the new construction was too low. Brisbane residents affected by flood in 2011 have been presented with an initial adaptation strategy using land use planning with the introduction of Temporary Local Planning Instrument 01/11 (TLPI) to raise habitable floor levels. The recommended building height is up to a maximum of 9.5 metres (Brisbane City Council 2011b). While such initiatives are important, responses suggest that residents do not fully understand minimum habitable floor levels and can only relate flooding to the official measurement of past depth of water on their allotment, when it is available. Flood maps do not yet show depth in enough Planning,�building�and�insuring�����������95� �
detail, though the ‘Floodwise’ Property Report is an example of how mapping of flood depth on allotments is improving. The new TLPI interim measures allow residents to build new homes half a metre higher than the 2011 flood height or higher. It is less useful for lowset housing designs, as some cannot be raised, and remain exposed (Hurl 2011). Several responses indicated that residents were considering building retaining walls around their properties, as building higher was not feasible. Adaptation “We are safe in this street because no flood can reach us” – (Respondent 9 2011, pers. comm., 4 June) Use of contingency funds and voluntary home purchase (buy-back) strategies were not options favoured by surveyed respondents. As reported in the results section, contingency funding, or monies set aside for specific purposes such as natural disasters, was considered to be flawed. The aim of buy-back in Brisbane was intended to allow the restoration of natural waterways as homes-at-risk were acquired. This scheme was only offered for residential homes with a 50% chance of flooding every year, where no other solution (such as drainage) was possible. The scheme was not successful, with only 55 properties purchased from 242 offers, and further funding was not being provided (Queensland Flood Commission Inquiry Report 2012). Informant responses suggest that residents of Milton and West End consider the benefits and amenity of living beside the river as far outweighing the possible safety of living on higher ground. Adaptation strategies are seen as costly or unnecessary, or only meant for new development. Residential Adaptation “My next house will be on a hill overlooking the ocean, protected by a levee” (Respondent 2 2011, pers. comm., 4 June) Residents see raising houses as an obvious adaptation, but are unlikely to modify their houses in the absence of legislation. Greater allowance for water runoff was also a popular strategy, but residents thought this would be impractical for existing homes and costly to implement for new homes. If such a strategy were implemented there would be reduced potential housing stock, unless denser housing strategies were combined with water- sensitive urban design (see the South-East Queensland regional plan (Part F 11 – Queensland Government Department of Local Government and Planning 2009). An alternative planning mechanism is low impact development to control water at the site level for stormwater management around new homes. This and technological solutions could together reduce flooding effects (Coffman 2001). With proposed riverside flood-aware housing options costing approximately $550,000 per home (Cox Rayner Architects in Fraser 2011), cost is likely to become a determining factor in decision-making. Direct observation revealed that a proportion of highset houses in the surveyed area had been effectively “built in” underneath since their original construction. On enquiry respondents indicated that such modifications (often illegal) were done for income generation by renting out the space. While there is clearly a financial incentive to this practice, it suggests limited consideration of the flood risk and increased exposure. A crucial recommendation in flood adaptation is to keep 96����������Planning,�building�and�insuring� �
valuable possessions and habitable floor heights above potential flood levels. Without significant adaptation, areas built-in under houses are at risk of flood damage. Catchment Adaptation “No more dams, just improve the guidelines for Wivenhoe” – Respondent 25 2011, pers. comm., 18 June) Research suggests that a city-wide preparedness program of installing backflow devices for drains is a highly effective engineering adaptation strategy. The insufficient capacity of storm water drains, drains filling with debris, and drains lacking backflow devices were key flood contributors to flooding in Brisbane (Queensland Floods Commission of Inquiry (2011). One survey respondent commented that large stormwater drains had been constructed in vulnerable suburbs but these were to mitigate the effects of flash floods, not riverine flooding. The respondent added further that the flood was “foreseeable and preventable” but the opportunity to reduce flood effects was lost when backflow devices were not installed in the new drains. Public meetings were held in Brisbane (including one meeting in Milton) in September 2011 in Brisbane to discuss the viability of backflow devices with residents and the commissioning of a possible risk analysis. Residents welcomed the prospective installation of backflow devices. Residents do not want more dams or flood gates built, and no longer trust that Wivenhoe Dam is a failsafe flood mitigation strategy. Residents also preferred the suggestion that a single point of authority should make water release decisions. The Queensland Floods Commission of Inquiry (2011) recommends that zoning of new residential subdivisions will need to account for unpopular planned retreat away from the ‘River City’ lifestyle if dams are not the answer. A universal flood levy across the whole of Australia is another policy option that has implications for Brisbane when considering how it can be introduced and whether the money would be used directly for rebuilding after the flood event (Hudson 2011). Hudson (2011) believes that money raised from such a proposal may not be used for direct flood recovery, as payment rates may be standard rather than indexed. City Adaptation “I got $4,000 compensation but lost $9,000 worth of things downstairs ... I feel let down” – (Respondent 17 2011, pers. comm., 4 June) Emergency Management Australia stresses the importance of effective flood communication. It has compiled a list of recommended good practice communication strategies in Manual 21 (‘Flood Warning’). This list includes: sirens and alarms; text messages; automated telephone use; radio messages; television; websites and social media; email; speaker phone; doorknocking; letterbox drops; noticeboards; print media and word of mouth (AGD 2009). At the city scale (aside from insurance considerations), better communication about flood warnings for individuals, including verbal communication and better flood and hazard and risk maps, were identified during this research as the most strongly supported adaptation strategy to mitigate flood hazard. Flood plain maps can be critical as these show where water will likely flow, and can encourage individual response to warnings. Warnings also provide the Planning,�building�and�insuring�����������97� �
opportunity for other mitigation to take place (Grigg 2011). Also, Grigg (2011) argues that in Brisbane, individuals are rarely advised how they can reduce flood damage personally, so not enough refutation of misleading information takes place. This suggests a need for better communication. Residents considered that better prepared evacuation plans, more evacuation centres, wider use of social media, construction of more flood access roads, awareness campaigns at the start of the wet season and selfhelp as less important, although responses indicated that these are still important considerations. Knowledge “We already had our 1 in 100 year flood” – (Respondent 62 2011, pers. comm., 6 August) Informants had limited knowledge and understanding of key concepts, possibly due to population transience and unfamiliarity with past flooding, so felt that self-adapting towards a threat they perceived as low-risk was unnecessary. This lack of knowledge could possibly be addressed with information about depth of flooding being provided, for example on rates notices and property searches. Misunderstanding of how often floods can happen, and why, is common and this causes apathy and complacency (Queensland Floods Commission of Inquiry 2011). These responses were evident during survey administration.
Conclusions The aim of this study was to assess individual understanding of flood risk and individual perceptions of potential adaptation strategies within the Brisbane River flood plain. The study investigated individual’s awareness of flood risk and their understanding of potential adaptation strategies, and explored individual intentions and attitudes with respect to different adaptation options. It is important to recognise that if people had decided to leave the areas surveyed, they would already have left or not returned, so that those who contributed to this research had already made a decision, at least for the short term. The level of understanding of flood risk appeared to be commensurate with the level of experience, awareness and available information. Although this information contributes to decisions about where to live, so does the desire for the amenity of living on the river. Better engagement of individuals and communities around preparation for severe weather events is needed if people are to continue to reside in these areas – whether by choice of lifestyle or lower housing costs. Improved understanding of individual risk is likely to increase the effectiveness of self-help responses, and awareness and preparation campaigns need to include a focus on this. Research participants saw that the most appropriate adaptation strategy for them was to build taller houses. Participants in the research largely opted to make no changes unless forced to do so by legislation, because of the costs. It may not be prudent to enforcing changes that residents are otherwise unwilling to make, noting the expense involved, and the adaptation alternatives available. The literature suggests that if cost 98����������Planning,�building�and�insuring� �
were not a barrier, new homes would be better protected from flooding if built higher – up to 11 metres to allow for 3 storey construction. Legislation reflecting adaptation good practice is more feasible for new dwellings. In the main, residents expressed feelings of helplessness around adaptation. They saw adaptation as a council role, and that their opinions were not likely to be considered. This may partly be attributable to the high levels of transience within the survey population. Councils need to engage better with their constituents about hazard planning, and ensure their concerns as well as their existing capacity are taken into account. There are also high levels of frustration resulting from a lack of compensation and insurance support, especially among those renting, to offset costs of damage incurred. Limited awareness, and inconsistent use, of natural disaster terminology also tended to reduce residents’ engagement in flooding adaptation. The consistent use of a single term such as “annual exceedance probability” or “local defined flood level” by stakeholders, including the media, non-government organisations, natural hazard managers, planners and local authorities, would likely build understanding and therefore community engagement and resilience. Respondents perceived that increased awareness, knowledge, education and understanding can only increase their adaptability. The vast majority of preferred adaptation strategies are those which can be considered ‘accommodate’ strategies. It may be that this type of approach is the most likely to succeed. Where appropriate, storm water drains including backflow devices, and spaces provided between houses for water run-off, were measures that were supported by respondent results. Retrofitting, in contrast, was considered more problematic. At the city scale, survey responses also point to the utility of combining flood markers in every suburb. Respondents also favour more use of social media, full disclosure of property water issues and understandable, affordable, available insurance as adaptation strategies. New homes could be constructed in areas that are not floodprone. Potential owners still need to consult rates notices, property searches, real estate information and ‘Floodwise’ property reports. Survey results identified a combination of catchment - wide adaptation strategies that could potentially mitigate flood risk hazard. These included permanently flagged and enforced land use zoning, and a review of flood codes that would prevent development inside flood zones and encourage decentralization. Prospective residents should also know what land to avoid in a catchment. Advances in flood mapping to show depth of flooding experienced at the house site level and a full hydrological survey of the entire flood plain and flood fringe would result in greater buyer engagement and responsibility for housing location choices. Also, more flood proof exit roads would mean more efficient retreat in emergencies. Retrofitting of existing houses is more likely to work where flood damage is minimised.
Planning,�building�and�insuring�����������99� �
5.3 Case Study (3): Planning Review of QLD Flood Commission of Inquiry Report Recommendations Adaptive Change to Planning Practice and Legislation: the Experience of the 2010/11 Wet Season in Queensland This research set out in 2010 to examine changes that may be required of planners in adapting practice and legislation to projected increases in the severity and frequency of natural hazards. A series of severe hazard events overtook the research plan in 2011, and resulted in the Queensland Floods Commission of Inquiry. The Inquiry asked planners (as well as a range of other professions) some of the questions that we had planned in the original research design of this project. We have therefore adapted our research to incorporate its findings. These have proved a valuable research resource and have enabled us to engage in a deeper analysis than might otherwise have been possible. In particular, we have made important headway in testing the recommendations of the Flood Inquiry, and planners’ responses to them. (We amended the research design to include, among other things, a survey of planners). The events of 2010/2011 fell within existing climate change scenarios relating to floods and sea level rise. This had the effect of raising public awareness of, and media focus on, climate change. All were water related. Although there were three cyclones, the storm surge from Tropical Cyclone Yasi created the worst damage and can be considered as a direct surrogate for the process of sea level rise. Most of the other floods in Queensland and Victoria were river floods that went far beyond regular flooding events. The worst events in terms of loss of life were flash floods. Thus responses to flooding are not simple – there are river floods, flash floods and storm surge, all coming under the broad area of flooding, but requiring an often disparate range of response. It should be noted that localised flash flooding is frequent, though not easy to map, in steeply mountainous areas. Amongst an extensive range of strategies for mitigating the impacts of natural hazards, and for managing adaptive change in hazard regimes, land use planning by state and local government has been identified as an area in need of strengthening and change. Planning legislation is one approach to climate change hazard mitigation and adaptation that has been emphasised by the Council of Australian Governments during the last decade. The most recent COAG report (COAG 2009) places hazard mitigation responsibility with all agencies and departments, and specifically refers to the roles of land use planning and development. Each state has its own planning and emergency management legislation, exhibiting differences in approaches and priorities. For example Victoria has given higher priority to a coastal retreat policy in the face of coastal inundation, especially from sea level rise, whereas in New South Wales engineering defensive solutions have been advocated. Table 5.3.1 below lists emergency management and planning legislation alongside flood mitigation policies, and coastal legislation and policies. There are broad similarities between the states’ planning legislation and between the various emergency management acts. The greater gulf is within each state and territory between emergency management and planning legislation.
100����������Planning,�building�and�insuring� �
Emergency Management Act 2005
Western Australia (WA) Planning and Development Act 2005
State Planning Police No. 3.4: Natural Hazards and Disasters 2006
SPPF Coastal Areas policy (Clause 15: 08-2)
State Planning Policy 1/03: Mitigating the Adverse Impacts of Flood, Bushfire and Landslide
Floodplain Protection Guidelines State Environmental Protection Policy Flood Prone Land Policy and Floodplain Development Manual 2005
Flood mitigation planning policy
No specific legislation
Coastal Management Act 1995
No specific legislation
Coastal Protection and Management Act 1995 Coast Protection Act 1972
No specific legislation
Coastal Protection Act 1979 Coastal Protection and Other Legislation Amendment Act 2010
N/A
Coastal legislation
Statement of Planning Policy 2.6: State Coastal Planning Policy 2003 (under state planning legislation)
Victorian Coastal Strategy 2008
Revised Draft State Coastal Policy 2008
Under review - Coastal Planning Information Package
NT Marine and Coastal Biodiversity Management Strategy being developed Draft Queensland Coastal Plan - Draft Guide Coastal Hazards
Draft NSW Coastal Planning Guideline: Adapting to Sea Level Rise
N/A
Coastal Policy
38cm by 2100
80cm by 2100
Not stated
30 cm by 2050 & 100cm by 2100
Draft – 30cm by 2050 & 80cm by 2100
Not stated
40cm by 2050 & 90cm by 2100
N/A
Sea level rise benchmark
Planning,�building�and�insuring�����������101� �
Sources: Thomas et al (2011), Emergency Management Australia (2008), AGD, (2009); Briggs et al. (2010)
Victoria
Tasmanian Planning Commission Act 1997 Planning and Environment Act 1987
Development Act 1993
Emergency Management Act 2004
Emergency Management Act 2006 Emergency Management Act 1986
Sustainable Planning Act 2009
Planning Act 2009
Environmental Planning and Assessment Act 1979
ACT (Planning and Land Management) Act 1988
Planning legislation
Disaster Management Act 2010
Disaster Act 2008
Emergencies Act 2004 State Emergency and Rescue Management Act 1989
Emergency Management Legislation
Tasmania
South Australia
Queensland
Northern Territory
New South Wales (NSW)
Australian Capital Territory
Australian State/Territory
Table 5.3.1: Flood related disaster planning legislation and policy in Australia
Planners are arguably late to the hazard planning area and are going through a process of adaptation to stronger demands and expectations. However, even later to hazard mitigation, and still largely absent, is most of private enterprise. Land use planners work between the private and government sectors, but it is private development that predominantly drives planning decisions. The planning profession is consequently entirely answerable to its legislation. Hazard mitigation and climate change adaptation must proceed within a legislative framework. Best practice is not in the best interests of community safety if developer interests can avoid responsibility through the court. It is only through legislation that planners can act to mitigate natural hazard and climate change impacts. Much of this review is concerned with planning legislation, as that was a strong focus of the Queensland Floods Commission of Inquiry. The Inquiry report is clear, well written and rational, with most of its recommendations sensible and achievable. However, such recommendations are not legal requirements. They have to be acted upon and incorporated into existing or new legislation. That process will find that many recommendations are complex and possibly flawed. This review briefly considers some of the Inquiry recommendations which it has tested against planners’ opinions and experiences through a comprehensive survey. Methodology of the Planning Review Case Study This case study consists of a review of the Queensland Floods Commission of Inquiry report sections that specifically concerned the roles, responsibilities and practices of land use planners. Particular attention has been applied to those sections and recommendations that contribute directly to severe flood hazard mitigation that contributes towards climate change adaptation. An online and workplace based survey of professional planners tested attitudes and levels of agreement towards key recommendations from the report; these were expressed as statements, or were interpreted as potential outcomes or strategies in a series of 48 statements. Respondents were asked to agree or disagree with each statement on a Likert scale (the survey questionnaire is contained in the appendix). Additionally, fieldwork and interviews were carried out during February 2011 in the primary impact area of cyclone Yasi in North Queensland and in central Queensland and the Lockyer Valley during April 2012. This fieldwork contributed to the critique of the Inquiry report’s recommendations concerning land swaps and rebuilding strategies. Adaptation of Land Use Planning to Climate Change-Driven Increases in Severity and Occurrence of Natural Hazards: The Queensland Floods Commission of Inquiry, its Implications and Recommendations for Land Use Planning and Planner Responses The Flood Commission of Inquiry did not attempt to define or prescribe what a flood study should be. The Inquiry used a panel of experts, comprising engineers and hydrologists, but not apparently planners (although planners were consulted as witnesses). It acknowledged that a flood study is a scientific process that, in this case, needed to be undertaken by government. The Inquiry report recommended that local government councils carry out their own comprehensive flood studies, and 102����������Planning,�building�and�insuring� �
acknowledged that Councils and state government may work together to carry these out. The Flood Commission of Inquiry criticises some local government areas for having made ad hoc decisions on floodplain development (the quotation from a planner in the conclusion to this review gives an example of this). It alleges a failure to address a range of foreseeable flood events and mitigation factors. The Flood Commission of Inquiry Report recommends a mix of four kinds of best practice floodplain management measures. 1. Land-use planning 2. Building controls 3. Structural measures, for example levees 4. Emergency measures such as warnings, evacuation and recovery plans. Although different departments and professions have responsibility for each of these measures, they do not exist in isolation, and each affects decisions made in the other areas. Although planners only have responsibility for land use planning, they may place conditions, or be influenced in approving development applications, on the basis of building codes, the existence or absence of structures such as levees, and the efficacy of such strategies as evacuation routes. Flood mitigation therefore requires comprehensive preliminary flood studies to be carried out. Flood Studies The Inquiry report makes reference to comprehensive flood studies. Along with detailed mapping flood studies typically have two main components: • a hydrologic study aimed at determining rainfall and associated stream flows in a range of scenarios • a hydraulic analysis that estimates the behaviour of flood flow (that is, flow rate, velocity, depth and extent of inundation) as it passes through the floodplain. "Comprehensive" was not defined by the expert panel but they specified elements that should be included in a flood study. When taking the example of a comprehensive flood study of the Brisbane River the panel suggested the cost could run into millions and timing would take up to three years. This process would be iterative, with validation and modelling taking place, specifically using the Monte Carlo analysis method to simulate scenarios that would include climate change. This is, however, not feasible for the great quantity of major river systems throughout Queensland, many in large shires with low populations and small rate-payer bases. The Flood Commission of Inquiry report extended from a consideration of Brisbane and Ipswich to all of Queensland, finding that not all river catchments need a comprehensive flood study. Urban areas have priority for detailed, precise flood Planning,�building�and�insuring�����������103� �
studies, but the report notes that it is not best practice to complete a flood study for an urban area or a Shire in isolation from a whole catchment. However, it acknowledges that given resource limitations, the immediate response necessitates a prioritisation of target localities. The responsibility for carrying out flood studies has historically fallen on local government councils. Despite noting the inadequacy of stand-alone urban floods studies, Inquiry Report recommendations 2.4 and 2.5 (below) suggest that councils should carry out flood studies of all urban areas, with significant involvement and support from the Queensland State Government and possible funding from the Commonwealth Government: 2.4 A recent flood study should be available for use in floodplain management for every urban area in Queensland. Where no recent study exists, one should be initiated. 2.5 The Queensland Government, in consultation with councils, should determine which urban areas in Queensland do not have access to flood information from a current flood study. The Queensland Government should rank those areas in order of priority in accordance with their need for updated flood information by reference to factors including: a. population b. sophistication of land use planning and emergency management measures already in place in those areas c. currency of any flood risk information available to the council d. approximate frequency of damaging floods in the area according to the historical record. The QLD Reconstruction Authority (QRA) is currently carrying out flood mapping over the whole state. There are some early signs that these are not aligned with best practice. Public explanations of the QRA mapping program have been couched primarily as demonstration projects. In particular, floodplain mapping, carried out very rapidly since the 2011 floods, uses a 10 metre contour interval (very imprecise), especially outside urban areas and places with known flood information. Despite the intention of the Inquiry Report recommendations, the interim maps available on the QRA website are only guides that are yet to be extended for land use planning decision-making and development assessment. Inquiry Report Recommendations 2.5 to 2.8 prioritise flood studies for urban areas, and recommendation 2.9 suggests that such studies should influence land use planning and emergency management. 2.6 By reference to the order of priority determined in accordance with (Report) recommendation 2.5, the Queensland Government and councils should together ensure that the council responsible for each urban area in Queensland has access to current flood study information. This will include determining:
104����������Planning,�building�and�insuring� �
a. a process or processes by which the flood studies will be completed, including the involvement of the Queensland Government and relevant councils b. how, and from whom, the necessary technical and financial resources will be obtained c. a reasonable timeframe by which all flood studies required will be completed. 2.7 As far as is practicable, councils should maintain up-to-date flood information. 2.8 When commissioning a flood study, the body conducting the study should: • check whether others, such as surrounding councils which are not involved in the study, dam operators, the Department of Environment and Resource Management, and the Bureau of Meteorology, are doing work that may assist the flood study or whether any significant scientific developments are expected in the near future, and decide whether to delay the study • discuss the scope of work with the persons to perform the flood study as well as surrounding councils which are not involved in the study, dam operators, the Department of Environment and Resource Management, and the Bureau of Meteorology. 2.9 Elected representatives from councils should be informed of the results of each flood study relevant to the council’s region, and consider the ramifications of the study for land planning and emergency management. These recommendations are then reinforced by recommendations 2.12 to 2.14 (following) that specify what must be involved in comprehensive floodplain management plans: 2.12 Councils in floodplain areas should, resources allowing, develop comprehensive floodplain management plans that accord as closely as practicable with best practice principles. 2.13 For urban areas or areas where development is expected to occur: a. councils with the requisite resources should develop a flood map which shows ‘zones of risk’ (at least three) derived from information about the likelihood and behaviour of flooding b. councils without the requisite resources to produce a flood behaviour map should develop a flood map which shows the extent of floods of a range of likelihoods (at least three). 2.14 For non-urban areas or areas where limited development is expected to occur councils should consider, on a risk basis, what level of information about flood risk is required for the area, and undertake the highest ranked of the following options which is appropriate to that need and within the capacities (financial and technical) of the council:
Planning,�building�and�insuring�����������105� �
a. a map showing ‘zones of risk’ (at least three) derived from information about the likelihood and behaviour of flooding b. a map showing the extent of floods of a range of likelihoods (at least three) c. a flood map based on historic flood levels that have been subjected to a flood frequency analysis to estimate the annual exceedance probability of the selected historical flood d. a historic flood map without flood frequency analysis e. the Queensland Reconstruction Authority Interim Floodplain Assessment Overlay as a way to determine those areas for which further flood studies are required, or f. the Queensland Reconstruction Authority Interim Floodplain Assessment Overlay (preferably refined using local flood information) as a trigger for development assessment. Panel experts agreed that the impacts of climate change should be assessed during the study. Our survey of planners prompted five statements concerning floodplain management plans and comprehensive flood studies. Local Government Council responsibility for carrying out flood studies, either by use of experts or using their own resources, received overall agreement of 58% of respondents, while a statement that Local Government Councils should be responsible for development of a floodplain management plan prompted 81% overall agreement. This suggests a significant degree of support for the Flood Commission of Inquiry suggestions that local councils should take responsibility with State government support. Within the Flood Commission of Inquiry report chapter on floodplain management are suggestions of best practice for management plans. The report refers to approaches put forward by Floodplain Management in Australia, along with the inquiry expert panel, QRA and various submissions to the commission. The Flood Commission of Inquiry report sections 2.6 and 2.7 constitute a reasonable basis for Floodplain management best practice guidelines. This idea received 81% of overall agreement from survey respondents. However the Flood Commission of Inquiry specifically used the concept of comprehensive flood studies, stating that ideally they should be carried out at catchment level. This idea received 96% agreement from survey respondents, and 79% agreement that comprehensive flood studies should be carried out in all local government areas in Queensland. In a sense this is the ideal position put forward in the commission report which goes on to acknowledge the constraints of cost and time that necessitate prioritising of flood studies in urban areas. Responses to our Survey of Planners included: “Whilst broad flood mapping and overlays should be included with a scheme the exact extent should be subject to detailed study (if necessary) at the development 106����������Planning,�building�and�insuring� �
application stage. Flooding is a catchment issue, most Local Governments only make up a part of a catchment. To fully understand flooding, mapping should be undertaken at catchment levels.” [survey respondent] “The formal identification of levels does not change the actual level of risk a property is subject to from inundation. Localised flooding also occurs from human error, not just rising waters. Debris can dam at bridges or small culverts or poor levee location or illegal earthworks. No amount of overlay within a Planning Scheme can prevent or identify this. However, the impacts of such a flood are the same on the affected property owner.” [survey respondent] Attitudes of planners were further tested by a claim that comprehensive flood studies are standardised and use comparable measures and definitions of flood and flood risk. Given that "comprehensive flood studies" are not precisely defined, this statement was intentionally set up to gauge understanding from planners. This did not prompt as much agreement as ideas about actually using comprehensive flood studies. There was overall disagreement from 30% of respondents and only 50% agreed that such studies are standardised. This attitude accords with the statement in the Flood Commission of Inquiry report (page 62) that: "there are two principal reasons for the inadequate level of flood mapping within Queensland:
x x
there is no requirement that councils undertake flood mapping by the operation of SPP 1/03, the SPA 2009, or any other piece of legislation; in almost every case, creating a comprehensive flood map involves undertaking a detailed flood study -- an expensive, time-consuming and technologically complex process, beyond the reach of many councils."
This observation is irrefutable and lies at the core of the failure of the State Planning Policy 1/03. Not only do the events of 2011 necessitate legislative and planning practice change in relation to flood mapping and floodplain management, but these flood events underscore the projected increases in flood hazards as a consequence of climate change. The recommendations of the Flood Commission of Inquiry are clearly stated directions for adaptation. However, the cursory floodplain mapping carried out by QRA does not constitute best practice, as crude delineation of floodplain boundaries are of extremely limited use for planning decisions. The Flood Commission of Inquiry report refers to historical flood maps, suggesting their use for establishing defined flood levels. The report (page 69) admittedly recommends caution in the use of historical flood maps. Our planners’ survey statement extended this to a more extreme position that "the historical flood maps should be used as defined flood levels in planning schemes", table 5.3.2. This generated only 33% overall agreement, with 52% disagreeing. The sensible use of historical maps would thus be as one tool among a number of resources. It is clear that historic land use patterns and decisions by individual local governments strongly influence the outcomes of policy on the ground (policy arguments versus outcomes arguments).
Planning,�building�and�insuring�����������107� �
Table 5.3.2: Planners’ Survey: Flood Studies and Floodplain Management (N=47) (percentages)
Strongly Disagree
Disagree
Ambivalent
Agree
Strongly Agree
n.a.
To what extent do you agree with the following statements about flood studies and management of flood plains?
Local government councils should be responsible for flood studies, either by hiring qualified experts or by doing it themselves
9
23
11
26
32
0
Local government councils should be responsible for the development of a floodplain management plan
4
9
6
49
32
0
Floodplain management plans should adhere to best practice guidelines
2
2
13
26
57
0
Comprehensive flood studies should be carried out in all local government areas in Queensland
2
13
6
32
47
0
Comprehensive flood studies are standardised and use comparable measures and definitions of flood and flood risk
4
24
11
24
33
4
Historical flood map should be used as defined flood levels in planning schemes
13
39
15
9
24
0
Comprehensive flood studies must take into account the likely impacts of climate change on future floods
0
4
7
28
61
0
Comprehensive flood studies should be carried out within the context of the whole catchment
0
0
2
24
72
2
Climate change is identified as significant by the Flood Commission of Inquiry (page 45) but the suggestions of the expert panel seem to have been limited to scenario modelling. Gold Coast City Council is identified most frequently in relation to climate change as it has carried out its own climate change study. However, Gold Coast City Council expressed the fear that their climate change modelling may increase their liability for compensation. The planner survey response to the statement that "comprehensive flood studies must take into account the likely impacts of climate change on future floods" received an overall 89% agreement – and only 4% disagreed. The planner survey intentionally did not attempt to gauge planners’ attitudes to climate change (because the survey was primarily developed from the Inquiry report which paid very little attention to this issue), but responses to this statement suggest a broad acceptance of the reality of climate 108����������Planning,�building�and�insuring� �
change amongst planners, and thus a need to plan for hazard impact within the context of climate change. State Planning Policy on Natural Hazards and the Q100 The Q100 level, or 1% annual exceedance probability, known also as the one in 100 year flood event, is specified as the standard in SPP 1/03. Comments in the report suggested that in the past the position of this level has been estimated in some council jurisdictions, while in others it is either supplemented by a range of levels, or in some cases it is not applied to development assessments at all. This is because it is simply not feasible to use it in places that are predominantly comprised of low-lying flood plains with no alternative areas for urban growth. SPP1/03 uses the Q100 or 100ARI as a standard against which to define flood prone land. European records of river flooding in Queensland are of short duration -- 150 years. There have been many more than one incidence of a one in 100 year flood, suggesting that the Q100 cannot be considered an absolute measure of a rare, one in 100 year event. There needs to be a considered review of what Q100 is and what alternative flood measures might be made available to land use planners. For example, some locations sit entirely below Q100 peak flood levels and need some sensible guidance for future urban development. Unfortunately the SPP 1/03 outcome 1– “Within natural hazard management areas, development to which this SPP applies is compatible with the nature of the natural hazard …..The Queensland Government’s position is that, generally, the appropriate flood event for determining a natural hazard management area (flood) is the 1% Annual Exceedance Probability (AEP) flood. However, it may be appropriate to adopt a different DFE depending on the circumstances of individual localities” – may be compromised by the Queensland Development Code NMP 1.5 which allows for the construction of dwellings within a proscribed natural hazard area, i.e. below Q100, as long as habitable rooms or a room is 300 mms above the identified flood line, such as Q100. The Quarternary record consists of riverine deposits that exist below the surface. These provide a flood record that goes back many thousands of years. Scientists who specialize in the study of such records, from cores taken through the deposits, assert that severe flood events are extremely common and they challenge the Q100 and the probability calculations on which it is based. Quarternary studies are a long established area of science (Geography, Geology, Earth Sciences). Definitions of probable flood levels should reflect the record of past flood events from quarternary records. Significant amounts of data already exist. “Storm surge levels need to be immediately reassessed to include paleo-evidence from both sand ridge and stalactite data (NOTT). 200 years is not enough time, nor is the present assessment reliable.” Table 5.3.3 records responses from planners when asked the extent to which Q100 is used in places in which they had worked: 7% stated that Q100 was not used and only Planning,�building�and�insuring�����������109� �
20% said that it is used exclusively to define flood zones, although a further 24% said that it was used in most jurisdictions. Just under half stated that Q100 is only used in combination with other measures, or that a comprehensive local flood study had defined flood levels. Table 5.3.3: Use of Q100 1. Q100 was the defined flood level in SPP1.03. The inquiry report suggests that Q100 levels in Brisbane and Ipswich were not based on a comprehensive flood study. It further suggests that Brisbane has moved away from the use of the term Q100. In places in which you have had recent planning responsibility, to what extent is Q100 used as the primary definition for flood zones (in the way in which it is laid out in SPP1.03)? Percentage exclusively
20.0%
in most jurisdictions
24.4%
in combination with other flood measures
35.6%
Q100 is not used
6.7%
a comprehensive local flood study has defined flood levels
13.3% 100.0%
Because Q100 or a 100 year event is so frequently misunderstood by the public, the survey tested four attitudinal statements, shown in table 5.3.4. Thus 71% of planners disagreed with a statement that the general public understand the concept of a one in one hundred year event. Response to the statement that the Q100 is effective and useful prompted a significant split in responses with 49% expressing overall agreement and 29% disagreement with a significant 20% expressing ambivalence. Table 5.3.4: Effectiveness of Q100
Strongly Disagree
Disagree
Ambivalent
Agree
Strongly Agree
n.a.
3. To what extent do you agree with the following statements?
2
27
20
42
7
2
Members of the general public understand what is 22 meant by Q100 or a 1 in 100 year flood event.
49
7
16
7
0
Instead of using the Q100, Councils should adopt a risk based approach to flood management.
2
9
27
40
22
0
Q100 should be replaced by a range of AEPs 4 such as one in 200 year events down to one in 20 or one in five year floods.
9
26
39
22
0
Percentages. N=47 Q100 is an effective and useful mechanism for defining flood risk.
110����������Planning,�building�and�insuring� �
The suggestion that councils should adopt a risk-based approach to flood management had 62% in overall agreement, but a very significant 27% again expressing ambivalence. This suggests that risk assessments have a place alongside a range of AEPs (as recommended in the Flood Commission of Inquiry report) with responses virtually the same. While Q100 is accepted as a measure that has problems, there is not an overwhelming indication from planners that it should not be used: “Q100 has been used for a long time and has generally been appropriate”. [survey respondent] “It is sometimes the Q20, Q50 events that make more damage”. [survey respondent] In summary, the general recommendations in the Flood Commission of Inquiry report for floodplain management have support amongst planners who participated in the survey. As adaptation strategies for increased impacts of natural hazards, comprehensive flood studies are a rational approach, but need to be sufficiently detailed to enable development assessment of function. The Commission has recognised that these will be expensive, complex and time-consuming if they are to be truly effective. Planning instruments and provisions The roles of state government departments, especially DLGP, DCS and DERM are discussed in the Inquiry report, raising areas of uncertainty and failure to implement the guidelines of the state planning policy. The report notes that DLGP decides whether or not to act on comments that are made about a planning scheme. This is particularly impacted upon statements from DCS relating to compliance with SPP 1/03. The report cites instances where comments or stipulations from DCS have been ignored, giving examples of Brisbane's and Emerald's planning schemes. On page 103 a specific gap is highlighted: "the DCS has not been, until very recently, in a position to ascertain easily whether its comments about planning schemes reflecting SPP 1/03 are being taken into account as part of the State interest review process." The criticism from DCS at the Flood Commission of Inquiry is quite mild compared to the research findings from interviews and conversations with responsible officers at EMQ over the last five years. EMQ has encountered widespread avoidance of compliance with SPP 1/03. Interviews with planners between 2007/8 and 2009 suggested that many regarded SPP 1/03 as no more than a guideline that can be used or ignored as they saw fit. Emergency managers at EMQ felt strongly that their recommendations for compliance were not being taken seriously either by councils or DLGP. SPP 1/03 was already under review before the 2011 floods and the Flood Commission of Inquiry, such that some submissions to the Inquiry had already been submitted to
Planning,�building�and�insuring�����������111� �
the state planning policy review. Recommendations concerning SPP 1/03 in the Flood Commission of Inquiry report are rational and achievable: Recommendation 4.1: The Queensland Government should: a. narrow the definition of ‘development commitment’ in State Planning Policy 1/03: Mitigating the Adverse Impacts of Flood, Bushfire and Landslide to ensure more development applications are assessed for compatibility with flood, and b. investigate whether the compensation provisions of the Sustainable Planning Act 2009 act as a deterrent to the inclusion of flood controls in a planning scheme and consider whether they ought be amended. 4.2 If, as part of a state interest review process, the Department of Local Government and Planning decides that no condition should be imposed requiring a council’s proposed planning scheme to incorporate the effect of the Department of Community Safety’s comments about State Planning Policy 1/03: Mitigating the Adverse Impacts of Flood, Bushfire and Landslide, it should advise the Department of Community Safety of the reasons for its decision. 4.3 The Department of Community Safety should put in place administrative arrangements which ensure it can readily ascertain whether its comments are being reflected in council planning schemes. If the Department of Community Safety becomes aware that its comments are not being adequately addressed, it should take steps to follow this up with the Department of Local Government and Planning. 4.5 The Queensland Government should change Temporary State Planning Policy 2/11: Planning for stronger more resilient floodplains to remove the possibility of councils’ using the interim floodplain assessment overlay mapping and Model Code as part of a permanent amendment to their existing planning scheme or as part of a new planning scheme. Several of these issues were articulated in the planner survey. While 39% overall agreed that SPP 1/03 is an inadequate mechanism for flood risk planning, 20% disagreed and a 29% were ambivalent. This reflects a lack of satisfaction with the existing state planning policy. To further test attitudes to the policy the statement that: “the existing role of EMQ/DCS in assessing planning scheme compliance with SPP1.03 is a sufficient safeguard for hazard mitigation, and does not require EMQ/DCS to be a referral agency” [survey statement] generated 38% disagreement and 33% overall agreement, with 29% ambivalent. The idea that EMQ (DCS) should be a direct referral agency (rather than just an adviser) was agreed with by 44% and disagreed with by 41%. Clearly there is no consensus on the existing state planning policy arrangements. A completely new policy or incorporation into the Sustainable Planning Act is needed. The existing arrangements of SPP 1/03 have not worked. A temporary state planning policy was introduced in 2011 (lasting from November 2011 to November 2012) to enable councils to modify planning schemes in response to identification of flood risk that was mapped by the QRA. It is the opinion of this 112����������Planning,�building�and�insuring� �
research and the planners who were interviewed at the time of the release of the QRA flood mapping, that floodplain boundaries are too crude to be of effective use to councils in assessing land use development. Comments in the report highlight the impermanence and relative ineffectiveness of this policy in relation to existing planning schemes and the problems of incorporation into SPA schemes once the temporary instrument has expired. The survey proposed a positively argumentative interpretation in relation to the temporary SPP 2/11, hypothesised as a rejection of its effectiveness; see table 5.3.5. The majority response was a combination of 54% who were either ambivalent or expressed lack of knowledge of this policy.
18 16 40 27
0
SPP1.03 is an inadequate mechanism for guiding planning in flood risk areas.
0
20 29 33 16
2
Flood risk is adequately addressed in the Queensland Planning Provisions through local government planning schemes.
9
40 31 16 2
2
Planning schemes should be amended immediately as better flood information becomes available, or if development results in a change to flood risk hazard zones.
0
11 11 40 38
0
EMQ (or the Department of Community Safety) should be a referral agency under SPA for development in any defined hazard zone (flood, bushfire, landslide, storm surge etc).
11
30 15 24 20
0
The existing role of EMQ/DCS in assessing planning 11 scheme compliance with SPP1.03 is a sufficient safeguard for hazard mitigation, and does not require EMQ/DCS to be a referral agency.
27 29 22 11
0
Temporary SPP2.11 Planning for Stronger More Resilient Flood plains has effectively advanced development of flood management plans following the 2011 floods.
9
7
11
47 22 4
na
0
Strongly Agree
Disagree
SPA should be amended to require flood risk to be incorporated into regional plans.
Agree
Strongly Disagree
To what extent do you agree with the following statements about SPA and State planning policies?
Ambivalent
Table 5.3.5: SPA and State Planning Policies (N=47) (Percentages)
Planning,�building�and�insuring�����������113� �
Information on flood risk and planning provisions Recommendation 2.13 (Flood Commission of Inquiry report). For urban areas or areas where development is expected to occur: a. councils with the requisite resources should develop a flood map which shows ‘zones of risk’ (at least three) derived from information about the likelihood and behaviour of flooding b. councils without the requisite resources to produce a flood behaviour map should develop a flood map which shows the extent of floods of a range of likelihoods (at least three). 2.16 Councils and the Queensland Government should display on their websites all flood mapping they have commissioned or adopted. 2.17 Flood maps, and property specific flooding information intended for use by the general public, should be readily interpretable and should, where necessary, be accompanied by a comprehensible explanatory note. These recommendations of the inquiry are reasonable and elicited strong overall agreement in all areas from the planners who were interviewed in the survey. Clear and detailed mapping is a necessary precursor to development controls and should be freely available to the public. “I suggest changes to the property law should also be considered as part of any reform process, so that when purchasing land in known high hazard prone areas that the prospective purchaser must be made aware. This could apply to other hazards as well, not just flood. In addition, the government corporations should not be exempt from the same requirements of other developers. Large tracts of land in flood prone areas should not be opened up and filled for development regardless of the entity developing it.” [survey respondent] “Risk appetite is higher in some communities than others. A common methodology for flood mapping, communication to communities and risk assessments is a good ground to work from.” [survey respondent] “The question is will the Federal Government and insurance companies correct past mistakes to ensure people are compensated for past decisions due to flooding standards?” [survey respondent] Recommendation 4.6 “Councils should consider using the limited development (constrained land) zone in their planning schemes for areas that have a very high flood risk” is more controversial and represents a primary planning issue in relation to flood hazards, especially under scenarios of increasing flood risk. One of the survey respondents criticised the survey statement that was derived from recommendation 4.6: “I found this survey somewhat biased. It appears that some questions have been written by persons without sufficient knowledge of the entire development process...such as question 4.4. Development in flood prone areas may be 114����������Planning,�building�and�insuring� �
possible, viable and desirable if engineering solutions adequately address the risk and do not adversely affect other property owners. The issues facing Queensland in relation to flooding are extremely emotive at the moment. At one point during 2011 2/3rds of Queensland was flood affected. Is the author of this survey suggesting that 2/3rds of the existing development in Queensland is inappropriate?” [survey respondent] The only alteration to recommendation 4.6 in the survey statement was to add the adjective “severe” before the noun “restrictions”. In any case, survey respondents were strongly in agreement, overall 85%, that zones of limited development should be imposed in areas of high flood risk. A further difference between recommendation 4.6 and the survey statement was the accidental omission of “very” from high risk areas. Thus respondents indicated support for a greater limitation than that which is in the Flood Commission of Inquiry report recommendation 4.6. Obviously mapping will be critical in setting zones of limited development. After further discussion of planning policies, indicating areas of clear need for improvement, the Flood Commission of Inquiry report moves to planning schemes and the Sustainable Planning Act 2009: Recommendation 4.7 The Queensland Government should consider amending the Sustainable Planning Act 2009 to require that consideration be given to the risk of flooding in the preparation or revision of a regional plan. 5.1 The Queensland Government should draft model flood planning controls, using a similar format and structure to that in the Queensland Planning Provisions, that councils can adapt for local conditions. The Queensland Government should require these controls to be reflected in new planning schemes. This may be achieved by including the controls in either: • a state planning policy dealing with flood, with an accompanying amendment to the Sustainable Planning Act 2009, or • the Queensland Planning Provisions. 5.8 The Queensland Government should consider amending the Sustainable Planning Act 2009 to expressly provide either a power to remake or a power to extend a temporary local planning instrument containing interim flood regulation for a further limited period. The power to remake or extend should: a. permit the modification of the temporary local planning instrument to the extent required to ensure its provisions remain relevant, having regard to any requirement that may have been introduced or any information that may have become available while the original temporary local planning instrument was in force b. be contingent on the Minister’s being satisfied that the circumstances listed in section 105 of the Sustainable Planning Act 2009 continue to exist and that there are proper grounds for the failure to make a permanent scheme amendment while the original temporary local planning instrument was in force.
Planning,�building�and�insuring�����������115� �
The recommendations 5.2 to 5.7 provide details of overlays and development conditions that are reasonable procedures to be adapted or modified under the SPA as part of planning schemes. The planner survey proposed that SPA should be amended (table 5.3.5) to require flood risks to be incorporated into regional plans. This received 67% overall agreement. When planners were asked to consider whether flood risk was adequately addressed through local government Council planning schemes, only 18% agreed, with 40% disagreeing and 31% ambivalent. Planning schemes as they currently exist vary in the extent to which they incorporate flood risk, or in the extent to which overlays are available and effective. Planning provisions are further explored in table 5.3.6, below. The conclusion that may be drawn is that the Sustainable Planning Act 2009 needs to be amended to incorporate flood risk more directly, in order to drive both local government planning schemes and regional plans that are more effective in incorporating catchment- wide risk. Temporary planning schemes are not necessarily a useful solution if they override a plan that was properly compiled under the SPA: “Until the Sustainable Planning Act provisions regarding compensation for back zoning are removed, there is limited ability for planning to be proactive in terms of reducing inappropriate development in flood areas.” [survey respondent] “The obvious place to implement local flooding policy is through the planning scheme, however the responsibility for the planning, and the studies lies with state and local government. Particularly when catchments are across council areas, and where back zoning is not cost effective due to the SPA provisions.” [survey respondent] “Options or opportunities need to be provided for interim land uses with a view to a long-term change in flood plain areas under planning schemes. For example, planning schemes are only intended to have a 5-8 year life. The planning scheme zone may still permit development in flood prone areas, if flood matters are resolved sufficient to the satisfaction of Council. However, then the Strategic plan can then indicate that the long-term goal is to revert the land to open space.” [survey respondent] “Perhaps 20-40 year plans need to be reconsidered as well.” [survey respondent] “There needs to be a more consistent legislation that covers all areas of QLD, as there are differing levels of flooding (i.e. SEQ - FNQ).” [survey respondent] “A Planning Scheme should not be a document that beyond doubt details whether a site is flood prone (to a defined event) or immune.” [survey respondent]
116����������Planning,�building�and�insuring� �
Table 5.3.6: Planning Provisions
Strongly Disagree
Disagree
Ambivalent
Agree
Strongly Agree
na
To what extent do you agree with the following statements about planning provisions?
All areas of future urban growth should be mapped for three or more levels of flood risk.
0
7
11
47
36
0
All local government area flood mapping should be accessible to members of the public on a web site or as printed maps.
2
2
4
22
70
0
The flood risk to all individual properties and parcels of lands should be made available to the public.
0
2
4
22
71
0
Queensland Planning Provisions should define a zone of limited development, or constrained land, areas subject to high risk of flooding, in order to impose severe restrictions on urban development in high risk areas.
4
4
7
27
58
0
Percentages. N=47
Recommendation 7.1 (Flood Commission Inquiry Report) The Queensland Government should consider extending the application of a state planning policy dealing with flood to the types of community infrastructure which are identified in the Sustainable Planning Regulation 2009 and which the community needs to continue functioning, notwithstanding flood: “Individuals should be more responsible for their own choices - not expecting governments to compensate.” [survey respondent] “State development areas and other state development MUST comply to the same requirements as private development. Private residents and developers should not be burdened by relaxations granted to state and their implications.” [survey respondent] Property impacts Impacts upon private, commercial and industrial property and infrastructure are discussed in several sections of the Flood Commission of Inquiry report. Submissions raised issues of liability both to hazards and to changes in legislation and planning schemes. These more general concerns were tested through five statements in the planner survey. Overall 78% agreed that detailed flood advice affects property values. If that is the case should councils then be responsible for compensating property owners for loss of value: 82% disagreed that the council should be responsible. The corollary of the statement that:
Planning,�building�and�insuring�����������117� �
“Councils are not liable for flood impact damage as long as the council has carried out reasonable mitigation and provided the most up-to-date information to the general public and property owners” prompted 86% overall agreement. A further version of council responsibility was expressed as: “Amendments to a planning scheme in updating and improving the flood risk overlay maps make the council liable to pay compensation for any decrease in property values.” This prompted 71% overall disagreement. Essentially these responses concur with earlier recommendations and statements that councils should be open in making flood risk information available at property level. State development areas may be substantially outside the control of the local government council and may override its planning scheme. There is often a concern, bordering on antipathy, amongst local government planners (the largest group of respondents to the planner survey) to state development projects. However, the requirement that such projects and areas must meet the same flood risk criteria as any other development application is entirely reasonable and prompted overall agreement of 94%, out of which 61% strongly agreed; table 5.3.7. Development issues concerning infrastructure, commerce and industry followed logically from the Floo Commission of Inquiry recommendations on planning legislation and practice.
118����������Planning,�building�and�insuring� �
Table 5.3.7: Property Impacts (N=47) (Percentages)
Strongly Disagree
Disagree
Ambivalent
Agree
Strongly Agree
na
To what extent do you agree with the following statements about property impacts?
Detailed flood advice affects property values.
2
7
9
48
30
4
If property values are affected by detailed flood advice, councils should be responsible for compensating property owners for any loss of value.
49
33
16
2
0
0
Councils are not liable for flood impact damage as long as the council has carried out reasonable mitigation and provided the most up to date information to the general public and property owners.
0
2
9
44
42
2
Amendments to a planning scheme in updating and improving the flood risk overlay maps make the council liable to pay compensation for any decrease in property values.
20
51
11
11
2
2
State Development areas must take account of flood risk and should be constrained in the same manner as any other development application.
0
0
4
33
61
2
Infrastructure Recommendation 7.1 specifies the need for community infrastructure to function regardless of flood (or any other hazard). This was expressed in the survey in the form of an extension of the idea contained in recommendation 7.1. If community infrastructure must continue to function during a flood, it reasonably follows that maybe it should be sited in areas at least risk of flooding, or that a higher standard of risk avoidance should be applied to community facilities. The overall agreement to this proposition was only 62%, with 21% ambivalent and 18% in disagreement. When the planner survey put a simpler statement that community infrastructure must be able to function effectively immediately after a flood or any other kind of natural disaster, agreement rose to 87%. Thus the outcome of effectiveness is more important than applying separate or higher standards for infrastructural location. Also there are many types of community infrastructure, not least roads, that have no alternative but to traverse high flood risk areas. Recommendation 7.1: The Queensland Government should consider extending the application of a state planning policy dealing with flood to the types of community infrastructure which are identified in the Sustainable Planning Regulation 2009 and which the community needs to continue functioning, notwithstanding flood.
Planning,�building�and�insuring�����������119� �
Recommendation 7.2: The Queensland Government should draft assessment criteria to be included in the model flood planning controls that require community infrastructure (including the types of community infrastructure which are identified in the Sustainable Planning Regulation 2009 and which the community needs to continue functioning, notwithstanding flood) to be located and designed to function effectively during and immediately after a flood of a specified level of risk. Recommendation 7.3: If the Queensland Government does not include such assessment criteria in model flood planning controls, councils should include assessment criteria in their planning schemes that require community infrastructure (including the types of community infrastructure which are identified in the Sustainable Planning Regulation 2009 and which the community needs to continue functioning, notwithstanding flood) to be located and designed to function effectively during and immediately after a flood of a specified level of risk. The commission also addressed issues related to commercial and industrial land uses and property. These areas are most often situated on flat and low-lying land, industry for space reasons, and both land uses for access to transport hubs, ports and the low lying crossing points and estuaries where many towns and cities were initially established. Recommendation 7.4: The Queensland Government should draft assessment criteria to be included in the model flood planning controls that require the impact of flood on commercial property to be minimised. Recommendation 7.5: If the Queensland Government does not include such assessment criteria in the model flood planning controls, councils should include assessment criteria in their planning schemes that require the impact of flood on commercial property to be minimised. Recommendation 7.18: The Queensland Government should consider amending the Sustainable Planning Regulation 2009 so that operational work or plumbing or drainage work (including maintenance and repair work) carried out by or on behalf of a public sector entity authorised under a state law to carry out the work is not exempt development under the Sustainable Planning Act 2009 if the development has the potential to reduce floodplain storage. These recommendations are reasonable, although they tend to be somewhat vague. The planner survey prompted a stronger response in stating that commercial properties should be responsible for their own risk minimisation. This resulted in overall agreement of 50%, with 30% ambivalent. To some extent it may be argued that commercial properties and businesses have the resources to ensure stronger risk minimisation than residential households, but many business districts in flood prone low-lying areas do not have alternative locations, and in order to compete must accept some level of hazard risk. Thus the following survey statement which proposed that commercial and industrial land uses should be permitted in areas of higher flood risk than residential dwellings prompted agreement from 52% of respondents and disagreement from 30%. Both of these sets of responses indicate insufficient
120����������Planning,�building�and�insuring� �
consensus concerning special conditions for commercial and industrial land use. It may be surmised that the minimisation of flood risk should be applied equally. The Flood Commission of Inquiry considered the issue of exemptions for fill and construction works carried out by public sector entities. Recommendation 7.18 suggests that restrictions should be placed on works and fill that impact upon stormwater flow and flood storage capacity. The planner survey indicated 93% overall agreement with the statement that: “construction works and fill in low lying flood prone areas should not be permitted if they increase local flooding or reduce flood storage capacity”. Clearly, all infrastructure e.g. sewerage, and electricity plants, need to be built above the PMF line. Emergency generators should not be on ground floors of multi-storey development. Maximum building heights should be allowed to 9.5 metres in flood prone areas to allow non-habitable rooms to be built underneath for overland flow. Levees and dams are considered the primary means of flood protection. After the 2011 floods many people in impacted communities called for more levees and dams and the strengthening or extending of levees (Bird et al 2012). Levees and dams are at the core of the issues surrounding the 2011 floods. The release of flood waters from Wivenhoe Dam remains controversial following the Flood Commission of Inquiry, with further investigation continuing. Brisbane’s floods may have been exacerbated by flood release from Wivenhoe Dam. Of comparative note is the failure of levees in New Orleans, USA, which certainly contributed to the enormous loss of life, property and infrastructure from Hurricane Katrina in August, 2005. The problem with both dams and levees is the complacency or false security that they may impart, and if there is any kind of failure the consequences may be catastrophic. Both dams and levees suffer four flaws: 1. they impart an attitude of security that may encourage inappropriate development on the assumption that flood risk has been removed; 2. failure of dams and levees (including inappropriate operation) is catastrophic because of reliance on their protection; 3. overtopping of levees may inundate areas that have limited escape channels for floodwaters; 4. both dams and levees will lose effectiveness over time as a consequence of silting of reservoirs and riverbeds that in turn raise water levels. These problems with dams and levees are part of the basis of opposition to their construction, or at least misgivings about reliance on the protection they afford. The Flood Commission of Inquiry addresses the issues of regulation of levees and of their impacts on catchments and communities. The recommendations concerning levees are rational and provide important directions for future floodplain management. Recommendation 7.19: Levees should be regulated. Recommendation 7.20: The Queensland Government should consult with councils to determine an effective method for the regulation of the construction of levees in Queensland. In particular, the Queensland Government should consider: Planning,�building�and�insuring�����������121� �
• requiring a development permit for the construction of a levee by designating levees as assessable development in the Sustainable Planning Regulation 2009, or • requiring, by way of a state planning policy or mandatory provision in the Queensland Planning Provisions, that councils nominate the construction of a levee as assessable development in their planning schemes. Recommendation 7.21: The Queensland Government should consult with councils to formulate a definition of ‘levee’ to identify what should be regulated. Recommendation 7.22: There should be a consistent process for the determination of applications to build levees. That process should include: • consulting landholders who may be affected by the proposed levee • obtaining or commissioning appropriate hydrological and hydraulic studies to assess the impacts of the proposed levee. Recommendation 7.23 There should be a common set of considerations in the decision whether to approve an application to build a levee, including: • the impacts of the proposed levee on the catchment as a whole • the benefits of the proposed levee to the individual or entity applying to build the levee and to any nearby community as a whole • any adverse impacts on other landholders, including the risk of levee failure • the implications of the proposed levee for land planning and emergency management procedures • whether any structural, land planning or emergency management measures can be taken to mitigate the adverse impacts of the proposed levee. Specific comments about levees were written by planners who responded to the survey. “As for the construction of levees and weirs – is this not against the idea of sustainable development? If we continue to protect flood prone land and properties, people will continue to think that it is the government’s responsibility ""to fix it"", rather than take individual responsibility for their decision or choice.” [survey respondent] “Development in flood prone areas may be possible, viable and desirable if engineering solutions adequately address the risk and do not adversely affect other property owners.” [survey respondent] “Are the existing towns protected by flood levees expected to be prohibited from future development? Should they be denied the opportunities for growth and prosperity that the rest of us desire? Should existing towns, especially small rural communities not be permitted to be protected by new levees? What would the authors’ opinion be of the development of the Netherlands? I believe that the 122����������Planning,�building�and�insuring� �
flooding in Brisbane was exacerbated by the Wivenhoe Dam being used for a purpose it was not built or designed for. I understood it was built as a flood amelioration device, not as a drinking water supply. I believe that as a community we are entitled to determine what risk level we will accept.” Four statements in the survey prompted responses about levees, summarised in table 5.3.8. The latter two statements were intentionally provocative in suggesting extreme development limitations in areas protected by levees. The first statement that levee construction should be regulated as assessable development under SPA is taken directly from recommendation 7.20. This only prompted 58% overall agreement. All of the other survey statements about levees failed to prompt consensus, with only a minority agreeing with strong restrictions on levees. This lack of consensus is a reasonable reflection of the controversial nature of levees (and dams) in the community. Thus while the Flood Commission of Inquiry recommendations are reasonable, and necessary, the regulation of levees will not be a simple matter, and restrictions on protected strategies will be contested.
Planning,�building�and�insuring�����������123� �
Community infrastructure should be sited in areas that are at least risk of flooding i.e. higher standards of risk avoidance should be applied to community facilities than to residential development.
Strongly Agree na
Agree
18 21 41 21
0
Community infrastructure must be able to function 0 effectively immediately after a flood or any other kind of natural disaster.
5
55 32
0
Commercial properties are responsible for their own risk minimisation.
2
18 30 39 11
0
Commercial and industrial land uses should be permitted in areas of higher risk of flooding than residential dwellings.
9
21 18 43 9
0
Construction works and fill in low lying flood prone areas should not be permitted if they increase local flooding or reduce flood storage capacity.
0
2
40 53
0
Public drainage works should not be exempt developments under SPA.
9
27 25 23 11
2
Levee construction should be regulated as assessable development under SPA.
7
22 9
40 18
4
If levees cannot be constructed to the level of a maximum possible flood, they should not be permitted.
7
30 25 27 11
0
Levees should only be constructed to protect existing properties.
9
29 20 36 4
2
New developments should not be permitted inside existing levee protected zones.
5
32 21 30 14
0
124����������Planning,�building�and�insuring� �
0
Ambivalent
To what extent do you agree with the following statements about land uses?
Strongly Disagree Disagree
Table 5.3.8: Land Uses, Infrastructure and Levees (N=47) (Percentages).
9
4
Interviews with planners and emergency managers have raised concerns over disaster or natural hazard evacuation, especially safe evacuation routes. Other issues of concern have been flash flooding and appropriate building design in flood prone areas. Recommendation 8.7: Councils should not rely on a condition requiring an evacuation plan as the sole basis for approving a development susceptible to flooding. Evacuation is a sensitive and risky disaster response. Emergency managers have paid a lot of attention to evacuation planning, and the issues surrounding evacuation centres have become politicised and advanced as a strategy. Thus planners have to avoid any increase in evacuation risks. A recommendation that “evacuation plans should not be specified as the primary or sole condition for approval of a development application in areas liable to flooding” is a sensible requirement for development assessments, which in the planner survey prompted 80% overall agreement. Flash floods occurred in Toowoomba and the Lockyer Valley in 2011, resulting in the primary death toll from all natural disasters in 2011. There was no adequate reference to flash floods in SPP 1/03 and as a specific hazard there is surprisingly little in the Flood Commission of Inquiry report. While the Toowoomba and Lockyer Valley flash floods were a very extreme event, flash floods occur every year in Australia and are a regular, predictable hazard. In response to the Flood Commission of Inquiry report, a survey question was drawn from recommendations 8.1 and 8.2 that “planning schemes should contain flood and stormwater policy that sets out information to be provided in development assessments”. This recommendation needs to go much further in developing appropriate planning for flash floods and stormwater control. The planner survey response to the statement (table 5.3.9) received a 96% overall agreement. A further statement on the mapping of overland flow paths and flash flood risk also prompted a level of 87% agreement from the surveyed planners. Recommendation 8.1: Councils should, resources allowing, maintain flood maps and overland flow path maps for use in development assessment. For urban areas these maps should be based on hydraulic modelling; the model should be designed to allow it to be easily updated as new information (such as information about further development) becomes available. Recommendation 8.2: Councils should make their flood and overland flow maps and models available to applicants for development approvals, and to consultants engaged by applicants. The issue of building heights in flood prone areas was raised in interviews with planners and residents (Apan et al., 2010; Bird et al., 2012). Some interviews suggested that there had been dubious interpretations of habitable areas which had been used as loopholes for development in flood prone residential developments. Recommendation 9.1 suggests a rational approach to residential buildings in flood prone areas.
Planning,�building�and�insuring�����������125� �
Recommendation 9.1: The proposed new part of the Queensland Development Code, Mandatory Part 3.5 ‘Construction of buildings in flood hazard areas’, should be amended so that the performance requirement relating to building design and construction (Performance Requirement P1) for building on a lot will only be triggered where the council has: • designated part of its area as a natural hazard management area (flood) under section 13 of the Building Regulation 2006, and • either: – declared a height to be the expected flood level under section 13 of the Building Regulation 2006, or – adopted a highest recorded flood level for the lot, and • either: – declared a velocity to be the expected maximum velocity of flood water for the area in which the lot is located, or – designated the area in which the lot is located an inactive flow or backwater area. One way in which an applicant can demonstrate compliance with this standard is by constructing the floor level of habitable rooms at not less than 300 millimetres above the level of a 1% AEP flood.108 Other provisions in the planning scheme also require floor levels for particular uses to be at a height above the 1% AEP flood level. The statement made in the planner survey that: “residential dwellings may be permitted in flood prone areas as long as at least the main habitable rooms are at or above the defined flood level” reflects the practice of some councils, but is not necessarily compliant with SPP 1/03. Only 51% overall agreed with building habitable rooms above the defined flood level. The responses suggest a lack of consensus and a need to include this approach to housing design along with other planning strategies.
126����������Planning,�building�and�insuring� �
Table 5.3.9: Evacuation, Flash Flood and Housing Issues (N=47) (Percentages).
Strongly Disagree
Disagree
Ambivalent
Agree
Strongly Agree
na
To what extent do you agree with the following statements?
Evacuation plans should not be specified as the primary or sole condition for approval of a development application in areas liable to flooding.
2
7
11
34
46
0
Planning schemes should contain flood and stormwater policy that sets out information to be provided in development assessments.
0
2
2
57
39
0
Residential dwellings may be permitted in flood prone areas as long as at least the main habitable rooms are at above the defined flood level.
7
24
16
44
7
2
Because overland flow paths are primarily conduits for flash floods these must be mapped as part of overall flood risk assessment.
2
2
9
54
33
0
Building houses higher is considered the best option but is too expensive. Residents continue to return to affected residential areas despite risk. If houses and commercial/retail buildings are to be re-built in Q100 flood areas, they need to be designed better to reduce future damage and possible loss of life. Buybacks, Land Swaps and Rebuilding Retreat: Relocation The ‘retreat’ strategy is not a new reality that is only about climate change adaptation. Since Europeans first settled in Australia people have been faced with the necessity of relocation as they encountered severe floods in places where they had no knowledge of local conditions. Coates (2011) cites Governor Macquarie establishing flood free settlements and encountering recalcitrance from settlers unwilling to move, as far back as 1810. There is a significant history of towns that have moved and many examples of new places that failed to develop or thrive because they were sited in hazardous flood plains. Aboriginal people had long and detailed knowledge of flood hazards, and being predominantly nomadic, moved seasonally to avoid floods. However, when they tried to communicate that threat, early settlers tended to ignore their warnings. This failure to heed warning signs and specific advice from local aboriginal neighbours has become part of the history of Clermont in North Queensland, that generations after its catastrophic flood of 1916, still portrays itself as the town that moved. Earliest settlers at Clermont in 1864 were warned by local aboriginal people that the site they had chosen by the Sandy Creek lagoon was dangerous for floods. Subsequent floods in Planning,�building�and�insuring�����������127� �
1870, 1893 and 1896 reinforced the danger but the town remained by the lagoon until the catastrophic 1916 flood that killed 65 people and decimated the business centre. During 1917 most of the surviving township was physically relocated by steam tractor dragging buildings up the gentle slope to higher ground where it remains (O’Donnell 1989). Reconstruction and Relocation Following 2011 Disasters Following the Lockyer Valley flash floods, the Brisbane floods, and wider Queensland flooding, and following Tropical Cyclone Yasi, the Queensland Reconstruction Authority (QRA) facilitated different responses in separate parts of the State. Rather than being locally appropriate, the reality is that a retreat strategy was adopted in response to an extremely rare event, while at the same time a protect strategy was adopted in the face of a much higher probability event. These contrasting approaches were adopted at Grantham and the Lockyer Valley and the storm surge devastated coast from Mission Beach through Hull Heads, Tully Heads to Cardwell. In North Queensland where the probability of severe cyclone-induced storm surges occurring in future decades is relatively high, the strategy encouraged by QRA was to build improved residences better able to withstand severe cyclonic winds and associated storm surges (QRA 2011). In the Lockyer Valley where the probability of river flooding remains high, but the probability of a repeat of the flash flood that occurred on 10th of January 2011 is very much lower than that of storm surge in North Queensland, the strategy of QRA was to facilitate a major relocation scheme. Buy-backs and Land Swaps Under this schema, the State or Council buys land voluntarily from residents or landowners and designates the land that is released for non-residential use, also described as ‘voluntary purchase schemes’ or ‘property buy-back programs’ (Queensland Floods Commission of Inquiry 2012 p270). The resident or landowner may use the compensation that is granted in order to purchase land in another location, or the State or Council offers alternative land as a land swap arrangement. These are entirely voluntary purchase schemes administered as part of a property buy-back or land swap program. Schemes are expensive to administer and there is generally a lack of funds. As part of hazard mitigation these have only occurred in very high risk hazard zones. Since 2007 the State of Queensland has been involved in a limited acquisition at Ipswich, but generally there has been no formal Queensland state buy-back scheme for flood risk. The Natural Disaster Resilience Program (Department Of Community Safety and Commonwealth Government) is a possible source of funding which involves contributions from local councils. Funds that were available were approximately $11 million per year. Generally only large councils have been able to afford buy-back, and even then, on a small-scale. After the 1974 Brisbane flood there were calls for the removal of highly vulnerable properties. Since 2005 there has been a Voluntary Home Purchase Scheme, but as of May 2011 only 525 properties were eligible within the Brisbane City Council area:
128����������Planning,�building�and�insuring� �
“The council has approached the owners of some 242 properties to participate in the scheme, which has resulted in acceptance in respect of 55 properties. Those 55 properties were purchased for a total cost of $24.21 million.” (Queensland Floods Commission of Inquiry 2012 p273) Moreton Bay, Bundaberg and Ipswich have proposed acquisition and removal of flood vulnerable properties as part of a long term flood prevention strategy. A flood retreat program aims to reduce population, property and infrastructure to reduce flood risk. Queensland Floods Commission of Inquiry’s ‘Voluntary Home Purchase Scheme’ comprises four eligibility criteria: • the property is flooded during a flood with an average recurrence interval of two years • the property is in a residential zone • floodwaters inundate the residential dwelling on the property • there is no other viable infrastructure solution (such as pipes) available to remove the flooding problem. (Queensland Floods Commission of Inquiry 2012 p273) Recommendation 11.1 states that: “Councils should consider implementing a property buy-back program in areas that are particularly vulnerable to regular flooding, as part of a broader floodplain management strategy, where possible obtaining funding from the Natural Disaster Resilience Program for this purpose.” (Queensland Floods Commission of Inquiry 2012 p275) Under the Queensland Reconstruction Authority Act 2011 (which is in place for two years, with possible extension) Lockyer Valley Regional Council was granted the capacity to develop a new development scheme for Grantham to enable resettlement of residents who had lost houses or whose houses had been severely damaged. Lockyer Valley Regional Council bought 378 hectares on the ridge adjacent to the existing township, above 2011 flood levels. The existing town of Grantham is partly on flat land of the valley and partly on the low ridge which extends northwards. This adjacent part of the ridge, beyond the existing town boundary, was open grazing land, unsuitable for cultivation as soils were dry and sandy. The owner of the ridge had previously put a proposal to Council to develop the land for residential purposes. Lockyer Valley Regional Council rejected the application on the grounds that it lay outside the urban footprint as defined by the planning scheme. The other four flood-impacted communities in the Lockyer Valley, Murphy's Creek, Postman's Ridge, Helidon and Withcott, are about 10 km from Grand Firm on the foothills of the dividing range at the end of the Lockyer Valley. Extensive areas had been developed in the foothills, much as acreage residential in undulating, wooded country. Some areas of Helidon and Withcott are on flatter land closer to the Warrego Highway. These communities are not part of Grantham, being effectively suburbs, many occupied by retirees, of Toowoomba. There is a clear socio-economic difference between these foothill communities and the lower socio-economic farming community of Grantham and surrounding parts of the Lockyer Valley. Planning,�building�and�insuring�����������129� �
The total number of properties impacted by the flood came to 2,798. In the Lockyer Valley 119 houses were destroyed. Because of the existence of suitable land immediately adjacent to Grantham township, and the history of the availability and suitability of this land for residential purposes, Lockyer Valley Regional Council was able to mobilise the land rapidly under the QRA Act 2011. Eligibility to participate in the land swap was on the basis of loss of home - the conditions of the Grantham relocation policy. Grantham Relocation Policy, as described by the Queensland Floods Commission of Inquiry, features: • landowners who meet the eligibility criteria participate voluntarily • the council offers unencumbered residential allotments to eligible landowners at no cost in exchange for their transferring ownership of their land, unencumbered, to council • blocks of comparable size are offered, up to 10 000 square metres; if a landowner elects to take a smaller block than his or her existing one, no compensation is paid for the difference • landowners are responsible for meeting the cost of building their homes on the new blocks • the process is a staged one: initial stages accommodate affected members of the community while later stages allow other lots to be developed and sold to provide revenue to council to help offset the cost of the land offer program • the timeframes are short, so that allotments were able to be allocated to eligible landowners in July 2011, with the land offer program expected to terminate on 1 July 2012 (Queensland Floods Commission of Inquiry 2012 p276) Community consultation took place from February 2011 and was ongoing into mid2012. The Master plan for the new community was carried out under the QRA Act 2011, which suspended the Lockyer Valley Regional Council planning scheme in order to develop the new scheme. New residential reconstruction development in areas that were impacted by the January 2011 flash flood is discouraged. Rebuilding in the flood impact zone is permitted as long as: “the habitable flood level is 300 millimetres above the defined flood level. However, any new residential development in the area significantly affected by the flash flooding of 10 January 2011 is discouraged: • The purpose of the zone is expressed as identifying land known to be significantly affected by one or more development constraints, such as flooding, which severely restrict the land’s ability to be developed for residential purposes. • No new subdivision of lots is intended in the zone, while amalgamation of lots is encouraged so that existing lots can be aggregated for agricultural uses.
130����������Planning,�building�and�insuring� �
• The table of assessment provides that any new residential development will be impact assessable.” (Queensland Floods Commission of Inquiry 2012 p277) The Queensland Flood Inquiry Commission praised the appropriateness of the Grantham development scheme, but noted that it would need to be incorporated into the Sustainable Planning Act 2009 planning scheme that was suspended under the QRA Act. In other words this implies that the temporary planning scheme was developed entirely under the QRA Act and not under the SPA 2009. The commission noted that the QRA was required to consider State Planning Policy 1/03, but that it was not bound to comply with it. While SPP 1/03 is under review during 2011 and 2012, it still applies to all new developments and planning schemes. The problem with the state planning policy has been the broad interpretation practice of many councils - thus the need to review the policy. The QRA believes that its scheme reflects SPP 1/03 in principle. It does this by defining the 2011 flood event as the prescribed flood level. “• residential zones are located outside the area affected by the 10 January 2011 flood • the scheme incorporates a defined flood level and provides that this level is as determined by the Lockyer Valley Regional Council having regard to the flooding on 10 January 2011.” (Queensland Floods Commission of Inquiry 2012 p277) While Lockyer Valley Regional Council initiated the Grantham relocation scheme, implementation of the plan was primarily driven by the QRA. It was very quickly developed as a master planned community, and as figures 5.3.1 and 5.3.2 illustrate, people very quickly started to relocate. While first allocations of land were to flood victims, the council has a longer-term plan to continue development of the ridge for commercial residential development, in order to recoup some of its costs in obtaining the land. This clearly goes well beyond the pre-flood planning scheme and will need a new Sustainable Planning Act compliant planning scheme that incorporates both the flood relocation and future urban expansion. It is a reasonable (but often contested) strategy for a council to defray its costs, and burden on the ratepayers, by selling land privately. However, if this land was formerly outside the Grantham urban footprint, there would need to be some purpose other than financial for expanding the town with an influx of new residents. New residents from outside Grantham who buy land in the township will be housed in a community that is adjacent to a flood victim community. Each component of the new community will possess a very different history and sense of place that may introduce divisions. However this may also be the situation that is faced by those residents who move in from the other four impacted communities. Alongside the new planning scheme that there must be a comprehensive flood study that puts the whole community in context. The QRA Master planned Grantham development scheme is initially a temporary development which does not include subsequent urban development for private sale. This is a complex scheme that is by no means the simple solution that has been portrayed. The Flood Commission of Inquiry report that recommends the Grantham development scheme as a template for other councils to consider does not anticipate the complexity of either community
Planning,�building�and�insuring�����������131� �
recovery or the status of planning legislation. We explore these issues in more detail in the following section, using Grantham as a case study.
Figure 5.3.1: Sourced as “Grantham house being relocated to higher ground” (photo courtesy Lockyer Valley Regional Council). This appears to be a new kit home, rather than a flood damaged house being relocated, which would presumably fall outside the Land-Swap scheme �
Figure 5.3.2: The same house now in place at the new location
132����������Planning,�building�and�insuring� �
The Lockyer Valley Flood: Buy Back schemes, Land Swaps and the Grantham Model The 10th January flash flood was a major disaster with 19 deaths occurring in the Lockyer valley, at Grantham, Postmans Ridge, Murphys Creek, Helidon and Withcott. No deaths occurred in North Queensland as a direct consequence of marginal category 5 severe Tropical Cyclone Yasi. In the Lockyer Valley people were caught by surprise in a very unusual event. In North Queensland an event that was as severe in terms of its impact, especially the 5 metre storm surge, resulted in no deaths. In the latter case, people were warned, prepared and knew when and where to shelter or evacuate. The response to the disaster in the Lockyer Valley was a relocation strategy. The response in North Queensland consisted of guidelines for rebuilding in the same hazard zone. The reaction of the affected local governments to disaster is understandable and may be expected to vary according to local issues and personalities. The Queensland Reconstruction Authority (QRA) was established to provide guidance and direction to all of the disaster impacted councils of the state, and was made a statutory authority. Was the QRA response in each location a reaction to the death rate, rather than a response to the severity of the event? It is understandable that there are likely to be strong and hasty reactions to the drama and trauma of a disaster, especially when large numbers of people have died. QRA planners paid close attention to the needs and wishes of each community and the contrasting planning strategies reflect the difference outcomes expressed by each community. It is nevertheless necessary to look beyond the immediate response when setting policies and strategies for long term mitigation. It has been suggested above that the creation of the Grantham relocation plan will probably generate additional challenges for the future. It is also suggested that the QRA approaches to Lockyer Valley and North Queensland recovery were driven by close community consultation, rather than the probability of repeated events that may be a consequence of climate change. These issues will develop at the local level and will be the responsibility of local councils to deal with them.
Figure 5.3.3: House at Tully Heads Destroyed in Storm Surge from Cyclone Yasi Image: David King, 2011
Planning,�building�and�insuring�����������133� �
Figure 5.3.4: The Grantham Relocation Project Entrance Immediately Adjacent to the Edge of the Existing Grantham Image: David King
Figures 5.3.3 & 5.3.4 illustrate contrasting Strategies: rebuilding after Storm Surge at Tully Heads; and relocation at Grantham after the Lockyer Valley Flash Flood. A policy based on replication of 2011 recovery approaches, such as in the Lockyer Valley and North Queensland, as a model for hazard mitigation is therefore problematic. The Flood Commission Report devoted a significant section to the Grantham case study. It concluded with a summary of the “suitability of the Grantham response for other areas” and made the following conclusion; “The success of the Grantham project, however, provides a template for a response to floodplain management which other councils in similar circumstances may wish to adopt.” and recommendation; Recommendation 11.1. Councils should consider implementing a property buy-back program in areas that are particularly vulnerable to regular flooding, as part of a broader floodplain management strategy, where possible obtaining funding from the Natural Disaster Resilience Program for this purpose. (Queensland Floods Commission of Inquiry 2012 p277) Is the Grantham project a template for floodplain management, as suggested by the commission, or is it, as suggested in an interview at Lockyer Valley Regional Council on 17/4/12, more a model of the process of developing a land swap? The survey of planners that was conducted after the release of the Queensland Floods Commission Report developed ideas and themes from the issues raised in the report. It was not relevant to question planners about the virtues of the Grantham scheme as a template for floodplain management as details of the scheme were not widely available. Six statements were put to the participating planners covering issues of property buy-backs and hazard vulnerability; table 5.3.10. Some statements are contrary to the ideas and recommendations made in the Commission Report.
134����������Planning,�building�and�insuring� �
33 24 11 18
2
Voluntary buyback schemes of high flood risk vulnerable properties should be funded by the State government
9
7
2
Local councils should take responsibility for buying back high flood risk vulnerable properties
25
41 25 5
Land that is purchased in a buyback scheme should be zoned only for open space recreation or drainage easements etc
7
16 14 36 25
2
Property buyback schemes of highly flood vulnerable properties should not be considered as an option either by State government or local councils
21
36 21 11 7
5
23 14 34 23
0
Residents in settlements that are destroyed or 7 severely damaged by hazards such as floods or storm surge should not be permitted to rebuild on the same block, but should be offered alternative land in a hazard free area
18 43 21
2
na
11
Strongly Agree
Disagree
Properties in high risk flood zones should be purchased compulsorily by the State government
Agree
Strongly Disagree
To what extent do you agree with the following statements about buybacks and land swaps?
Ambivalent
Table 5.3.10: Responses of Planners to Buy Back Issues (N=47) (Percentages).
2
The Commission report recommendation is that “Councils should consider implementing a property buy-back program in areas that are particularly vulnerable to regular flooding” (ibid). This was tested with the statement that properties in high risk flood zones should be purchased compulsorily by the State government. As 64% of respondents worked for local government there is likely to be a bias towards state government funding such a scheme. The first statement proposes compulsory purchase, even though all schemes have been voluntary. Almost half disagreed with the idea that the state should compulsorily purchase vulnerable properties, but almost a third were in agreement with a compulsory purchase. For voluntary schemes two thirds agreed with the statement that voluntary buyback schemes of high flood risk vulnerable properties should be funded by the State government. Similarly, two thirds disagreed with the statement that local councils should take responsibility for buying back high flood risk vulnerable properties. The statement that property buyback schemes of highly flood vulnerable properties should not be considered as an option either by State government or local councils was intentionally provocative rather than representative of existing schemes and 59% disagreed with this statement. The 17% who felt ambivalent about the idea was a similar proportion, 19%, to those who agreed. Amongst the open ended comments the quotation below encompasses the complexity of the issue. Planning,�building�and�insuring�����������135� �
“Surveys of affected residents indicate that buybacks and planned retreat are unpopular options. Building houses higher is considered the best option but is too expensive. Residents continue to return to affected residential areas despite risk. All infrastructure e.g. sewerage, and electricity plants need to be built above the PMF line. Emergency generators should not be on ground floors of multi-storey development. Maximum Building heights should be allowed to 9.5 metres in flood prone areas to allow non-habitable rooms to be built underneath for overland flow.” The statement that land that is purchased in a buy-back scheme should be zoned only for open space recreation or drainage easements represents current practice with 62% agreeing, but almost a quarter disagreeing. The final statement extended the buy-back concept to a more extreme viewpoint, although this is a position very strongly held amongst emergency managers. While 54% of respondents agreed that residents in settlements that are destroyed or severely damaged by hazards such as floods or storm surge should not be permitted to rebuild on the same block, but should be offered alternative land in a hazard free area, a significant 31% disagreed. Some comments indicated the complexity of flood and settlement. “Ensure future policy approach is focussed on risk appetite of communities. Historic land use patterns and decisions by individual local governments strongly influences the outcomes of policy on the ground (policy arguments versus outcomes arguments). Risk appetite is higher in some communities than others. A common methodology for flood mapping, communication to communities and risk assessments is a good ground to work from. Further, State-wide mandatory policy is a much harder thing for local governments to accept if the State removes itself from implementation responsibilities, but then wants to assess development applications as well.” [survey respondent] And others express, as below, the diversity and constraints that underpin that complexity. “Some of these questions are difficult to give a definite answer as I work mainly on remote Indigenous schemes. Most remote Indigenous communities are highly constrained, in particular Wujal Wujal. They are a very small DOGITs constrained not only by flood, bushfire hazard etc, - most of the DOGIT is World Heritage rainforest - they have very little land for expansion/growth. Additionally DOGIT communities are not rates based - Councils are limited in the funds - studies, etc are expensive and some of the questions in the survey do not account for the vast differences in these communities (this applies to remote rural communities also). I HIGHLY disagree with a blanket approach and feel that all planning, risk mitigation measures, methods, etc..MUST start to appreciate the extraordinary differences between mainstream councils and others. Build to the conditions, NOT restrict where there are very little, or in some cases in the Far North, no choices.” [survey respondent]
136����������Planning,�building�and�insuring� �
Figure 5.3.5: Funding of Buy Back �
Figure 5.3.6: Funding
Planning,�building�and�insuring�����������137� �
Figure 5.3.7: Council Responsibility �
Figure 5.3.8: Buy back zoning
138����������Planning,�building�and�insuring� �
Figure 5.3.9: No Buy Back schemes �
Figure 5.3.10: Rebuilding post Disaster
Figures 5.3.5 to 5.3.10 above, illustrate the responses of planners to buy back issues and graphically show lack of consensus on most issues that were presented in the survey, based on Flood Inquiry recommendations and assumptions. Planning: Conclusions The planner survey proposed 48 statements mostly drawn from the recommendations of the Flood Commission of Inquiry report. As noted in the following table, only 18 of these statements prompted a strong degree of consensus, either of more than 75% disagreement of agreement with a statement. Most of these consensus statements are Planning,�building�and�insuring�����������139� �
commonsense, reasonable and should be capable of being enacted, even though comprehensive flood mapping and studies may take a long time. Five of the statements relate to 4 issues that are potentially more significant or even controversial: whole of catchment flood mapping, climate change adaptation as part of hazard mitigation, zones of limited or constrained development, and flash flooding. Many of the other 30 statements that did not indicate a consensus include some controversial and complex issues. The complexity of things like land swaps and levees will generate disagreement and will be contested. The lack of consensus amongst the survey respondents illustrates that lack of agreement and suggests that easy solutions will not be found: the minority of issues that achieved a level of consensus are summarised in table 5.3.11, below. Table 5.3.11: Consensus Issues (N=47) (Percentages). Ambivalent
Agree
4
9
6
49 32
0
Floodplain management plans should adhere to best practice guidelines
2
2
13 26 57
0
Comprehensive flood studies should be carried out in all local government areas in Queensland
2
13 6
32 47
0
Comprehensive flood studies must take into account the likely 0 impacts of climate change on future floods
4
7
28 61
0
Comprehensive flood studies should be carried out within the context of the whole catchment
0
2
24 72
2
Planning schemes should be amended immediately as better 0 flood information becomes available, or if development results in a change to flood risk hazard zones.
11 11 40 38
0
All areas of future urban growth should be mapped for three or 0 more levels of flood risk.
7
11 47 36
0
All local government area flood mapping should be accessible 2 to members of the public on a web site or as printed maps.
2
4
22 70
0
The flood risk to all individual properties and parcels of lands should be made available to the public.
0
2
4
22 71
0
Queensland Planning Provisions should define a zone of 4 limited development, or constrained land, areas subject to high risk of flooding, in order to impose severe restrictions on urban development in high risk areas.
4
7
27 58
0
Detailed flood advice affects property values.
7
9
48 30
4
140����������Planning,�building�and�insuring� �
0
2
na
Disagree
Local government councils should be responsible for the development of a floodplain management plan
Strongly Agree
Strongly Disagree
Statements for which there was Strong Consensus of More than 75% agreement or disagreement
33 16 2
na
49
Strongly Agree
Ambivale t Agree
Disagree
If property values are affected by detailed flood advice, councils should be responsible for compensating property owners for any loss of value.
Strongly Disagree
Statements for which there was Strong Consensus of More than 75% agreement or disagreement
0
0
Councils are not liable for flood impact damage as long as the 0 council has carried out reasonable mitigation and provided the most up to date information to the general public and property owners.
2
9
44 42
2
State Development areas must take account of flood risk and should be constrained in the same manner as any other development application.
0
0
4
33 61
2
Construction works and fill in low lying flood prone areas should not be permitted if they increase local flooding or reduce flood storage capacity.
0
2
4
40 53
0
Community infrastructure must be able to function effectively immediately after a flood or any other kind of natural disaster.
0
5
9
55 32
0
Planning schemes should contain flood and stormwater policy that sets out information to be provided in development assessments.
0
2
2
57 39
0
Because overland flow paths are primarily conduits for flash floods these must be mapped as part of overall flood risk assessment.
2
2
9
54 33
0
Extended comments from the planners who participated in the survey encapsulate the issues and complexities of planning in a changing and hazard prone environment. “Flood planning is an inexact science and is influenced by many external factors, including ongoing management of drainage systems. We choose the level of risk we want for our health insurance, car insurance, standard of our children’s education. Before planners dictate what a new level of risk management should be, it should be done in consultation with the public, local, state and federal governments, insurance bodies, property Council, UDIA, etc. I believe that as planners we need to ensure that sufficient work is being done to deliver all facets of community facilities and safety. If a growing city such as Brisbane needs another drinking water supply, then so it should be delivered in the most sustainable way, with EQUAL weight given to social, environmental and economic consideration. Government in Australia, and Queensland especially, has been devoid of equal weighting of sustainability measures for some time. No new dams have been built on mainland Australia for decades. We need to change this. Water recycling needs to be improved. Existing communities at flood risk need support and protection, not mapping and alienation. We need some consistency across planning at all levels.” [survey respondent]
Planning,�building�and�insuring�����������141� �
“Qld is in desperate need of some coordination between agencies instead of the power plays and empire building that has been occurring for at least the last 6-10 years.” [survey respondent] “Ensure future policy approach is focussed on risk appetite of communities.” [survey respondent] “Planners are aware of flooding and aim to design planning outcomes that are unaffected by these impacts. But the engineers and others are responsible for the detail behind the scenes and provide advice/recommendations accordingly.” [survey respondent] The final extended quotation is from a professional planner who participated in the ‘pilot’ testing of the planner survey. The statement draws important contrasts between the planning response made at Grantham and the strategy following Tropical Cyclone Yasi in North Queensland. My concern is on the basis of planning - more specifically statutory planning procedure. The purpose of statutory land use planning is provide certainty for the future. The Lockyer Valley Regional Council are like all of us in Queensland - we are stuck with regional plans that delineate a defined urban footprint. This means that no development can occur outside this footprint. The new Grantham is outside the urban footprint. The previous owner of the new Grantham applied to Council to reconfigure - i.e. subdivide. He was refused on the grounds that the development was outside the urban footprint. From my perspective the planning system represents the scale and intensity of development that is commensurate with community aspirations. This in turn means that people are happy with the way things lay on the land and that this is represented in the plan. This is why the original application to reconfigure was refused. It did not meet with the community's aspirations for development (as represented through a statutory land use plan). However, subsequent to the Grantham disaster, the state (local and state government) determined that a new Grantham could be established on land that was previously thought to be inappropriate for development by the community. Two issues spring to mind. One is that no one is in their right mind subsequent to a disaster of this type or magnitude - to make decisions about development - let alone development that is commensurate with community aspirations (non stressed ones). Secondly the purpose of the Sustainable Planning Act is to achieve ecological sustainability by: 1. managing the process by which development takes place, including ensuring the process is accountable, effective and efficient and delivers sustainable outcomes; 2. managing the effects of development on the environment, including managing the use of premises; 3. continuing the coordination and integration of planning at the local, regional and State levels. Note that the purpose is to ensure that the process is accountable, effective and efficient. At no times were these three variables taken into consideration in the 142����������Planning,�building�and�insuring� �
decision making regarding the identification of the new Grantham - because if they had - then the original decision to refuse the application would have stood. Ecological sustainability is a balance that integrates (SPA 2009): (a) protection of ecological processes and natural systems at local, regional, State and wider levels; and (b) economic development; and (c) maintenance of the cultural, economic, physical and social wellbeing of people and communities. Note again that (c) talks of the social well being of people and communities. However the way this is defined is in terms of being well serviced (infrastructure), communities where places of cultural significance are conserved, that a network of open space is provided and that the potential adverse impacts on climate change are taken into account - through - sustainable settlement patterns and sustainable urban design. At no times does this Act - that governs all planning in Queensland ever say that social well being is served through ensuring that natural disasters are mitigated, that risks from natural disasters are identified, and that in the event of a disaster that all planning procedures and documents may be overturned to permit Mayors to make decisions about future settlements including the location, scale and intensity. That is my gripe - political interference, inconsistent planning process, decisionmaking under times of extreme duress and emotional upheaval, reversal of decisions made when not under extreme duress and emotional upheaval, the introduction of a Reconstruction Authority - as opposed to agency - and the ability of the state to develop a whole new piece of legislation to over ride all planning procedures and policies made and agreed upon by local communities (at a time when not under duress). So that leads me to my final point - that planning is about creating certainty. When the state makes decisions on its own there is no certainty, because there are no rules that govern when they can and cannot intervene - just when they write a law that says they can. One only needs to look at the differences in responses by the Lockyer valley Regional Council Mayor - in creating new Grantham - and the Cassowary Coast Mayor subsequent to Yasi - at Tully Heads. At no time was there ever any consideration of doing a buy back at Tully Heads instead the reconstruction AUTHORITY - created some excuse of a policy that says in the event of a storm surge build away from the ocean and increase the height of the lowest floor from the ground (http://www.qldreconstruction.org.au/u/lib/cms/DRAFT-PART-1-LOWRES.pdf) ..... how does that compare to what Grantham got? My last point - the difference between the Grantham and the Tully Heads cases is that Grantham was fuelled by emotion and probably created by what appears to me to be a poor communication process in disaster warning systems (that would have only been in existence if the area had prior experience of such events - i.e. like we do in the north - we are used to it so we have a good system - they aren't used to it so they don't have a good system - as humans we respond to stimuli - no stimuli no Planning,�building�and�insuring�����������143� �
response). However the city based emotion was totally drained by the time Yasi hit the north and so they came up with this poor excuse of a policy as a response. How come we didn't get a new Tully Heads? How come Tully is still in Tully, Innisfail is still in Innisfail, Cardwell still in Cardwell? Does this now mean that we move everyone from Cairns and every other town along the coast to Mareeba - because it is safer? Consistency and certainty are those things that make planning tick along. This new Grantham effectively makes provision for an additional 400 lots. If they were thinking sensibly - they would have created more - to make the development commercially viable. I just don't agree with the process - if planning sucks so badly then don't band aid it - rewrite it so that what happened in Grantham can happen everywhere - that's called adaptive planning. But if you play with the planning system you also need to play with the legal, property, economic and bank systems too! If a developer wanted to use the argument that they want to develop a new community outside of the planning scheme parameters or regional plan - under the auspices of relocating a community or providing a disaster safe settlement - would this be approved by the Assessment Manager under the current process? I would say not - because the current planning law would apply to the developer as opposed to the power that the LVRC and the QRA have to amend the process. Because there is no specific purpose contained in the Sustainable Planning Act that says social well being includes a disaster safe community - then there is no argument to go outside the legal parameters for a developer - as the Lockyer Valley Regional Council did for the new Grantham. Same material outcome, just a different developer. The state planning policy is only able to be triggered because it has been endorsed as a state planning policy. There is no legislation to trigger an assessment process by another agency under a relevant piece of legislation - which is the only way the SPP is included in the development assessment process. If there was a piece of legislation that was under the specific responsibility of EMQ that enabled them to condition development according to the parameters set within said legislation then that would be another story. As we know, the SPP is so bad and contains so many loopholes - that I am not surprised at the high rate of vulnerable buildings and settlements! The only way that slopes, bushfire hazards and floods (other than those covered in the coastal management plan and Act) are mapped as hazards or overlays in planning schemes is through the SPP - as a direct requirement. However the councils have traditionally contracted this out to consultants and invariably a range of methods have been used to identify the location of hazard prone areas - and at scales that make it nearly impossible to be vaguely reliable. I had one client come to me who was required as part of his decision notice to map the area to Q100 and then in the next condition there was some guff about the ARI - and siting buildings so many metres from the ARI. He said to me that the planner said - there are no 144����������Planning,�building�and�insuring� �
Q100 maps for this shire - so therefore ask some old timers what they reckon and then draw in some lines on a map and then submit this back..... I have had other instances where this same shire and same planner have directed me to get a hydrologist to do the flood mapping for a reconfigure 1 lot to 3 - to determine where the Q100 is (despite the SPP saying that Council had to do this) and then they would consider the application. The study alone made the development unviable. The planning system in Queensland is just not made to consider safe development. There is a theory referred to as 'safe development paradox' (Stevens et al 2010) and I think we say that we are about safe development and all the rhetoric is about safe development - but we are unable to define what is unsafe (to use the legal terms - you would need to be sure that you could statistically derive a probability of the disaster occurring that was 'beyond a reasonable doubt' - for a court to uphold a decision). [survey respondent] The insights provided by these planners’ statements suggest that the planning adaptive response will require a much more significant reappraisal of the legislation than just a tightening up of the State Planning Policy for Natural Hazards. There are strong arguments for modifying the Sustainable Planning Act, possibly including Emergency Management Queensland through the Department of Community Safety as a Referral Agency. This will probably need to come after a period of extensive hazard mapping, when it will be possible to make much more precise hazard risk assessments of development applications. The appointment of a temporary disaster response entity to speed the process of recovery seemed to be a decisive move, but the populist gesture of ‘cutting red tape’ implies that the legislation was an unnecessary restriction, or an encumbrance. If that is a flaw of the Sustainable Planning Act, then the act needs to be improved, rather than over-ridden each time a crisis occurs. At the core of this issue lie the actions of the Queensland Reconstruction Authority in the Lockyer Valley and in North Queensland. The variability of their responses presents a problem for future planning adaptation strategies – do planners put public and community consultation first, or do they plan for hazard mitigation within clear legislative guidelines that put public safety above community wishes? At the present time neither strategy can satisfactorily be tackled until there is effective hazard mitigation legislation in SPA, or in succeeding planning legislation. The case study uses the example of Queensland and its planning legislation, but this philosophical issue is relevant to all states in adapting planning practice and legislation for natural hazards to anticipated increased impacts that are a consequence of climate change. Specific recommendations of changes in planning practice and legislation are listed at the end of this report. However, these case studies illustrate two sets of critical issues for planners. Firstly common ground and contested approaches: will development conditions and land use constraints hold up in court? Many rational and logical recommendations were made by the Queensland Floods Commission of Inquiry, but when some of these ideas and interpretations of their implications were tested in a survey of professional planners there was a lack of consensus concerning many of the ideas and proposals. A lack of consensus will translate directly into positions of contest, which will ultimately be argued in planning courts. Adaptive legislative change has to be accepted or agreed as workable, by the profession and development industries. Secondly the case studies illustrate the dichotomy of public safety and public participation positions. These are Planning,�building�and�insuring�����������145� �
liable to be in contradiction. Planners tread a fine line between response to community wishes and responsibility for the safety of existing and planned (not yet existing) communities. The profession is required to consult and work with communities, but it may have to override the wishes of those communities in the best interests of their safety in the face of worsening natural hazard impacts. It is the argument of this report that planners need clear and decisive legislation to support them in making what may be contested planning decisions that are in the best interests of the safety of the community.
146����������Planning,�building�and�insuring� �
6. BUILDING CODES 6.1 Climate Change and the Built Environment – Housing to Resist Wind Loading 6.1.1 Introduction to the project The Cyclone Testing Station (CTS) segment of this report considers how regulations and standards can (and have) improved the resilience of housing to a range of natural hazards. The main objectives of this part of the report are to: x
Describe the main weather-related environment hazards that damage houses. Review the existing regulatory mechanisms (i.e. building codes and standards) and their effectiveness and assess their ability to respond to projected climate change scenarios. Categorize houses according to their location, age, and construction methods/materials.
x
Present methods for assessing housing vulnerability using engineering methods based on reliability techniques. This method will be used with test data available at the CTS in case studies that investigate the resilience of two different house types, subjected to cyclonic wind loading. The case studies will consider a range of different upgrade options to strengthen the capacity of components to critical connections of existing houses, and consider the effect of additional wind loading caused by increased internal pressure that develops if dominant openings occur to the windward building envelope.
This work can be used to assist in future comparative studies on adaptation measures for housing to increased wind speeds or the possible poleward shift of the cyclone boundaries that may be caused by climate change. Note that this study does not include an economic analysis of the benefits or costs of implementing these adaptation measures. Literature Review All parts of Australia are impacted by natural disasters that can inflict significant economic costs in addition to the social disruption to the community. Tropical cyclones, storms, floods and bushfires have the biggest impact but events such as earthquakes, landslides and tsunamis can also cause damage. The impacts of these disasters increase with the growth in population. In addition, any influences on the occurrence of these weather related events as a result of climate change must be considered. This section provides an overview of regulations to control housing design and construction, and its effectiveness and considers possible effects on buildings for climate change projections in Australia, and analyses the response of huses to cyclones and windstorms, floods and bushfires.
6.1.2 Policies, plans and regulations The Australian Federal government formulates national disaster management policies and provides states and territories with support during and following a natural disaster. Planning,�building�and�insuring�����������147� �
State and territory governments are responsible for natural disaster management in their jurisdictions, including developing relevant policies, warning systems, awareness and education, and response and recovery. Local governments, in collaboration with State and Federal Government agencies, often lead the development of regional emergency management and disaster response plans. They also conduct community awareness and preparedness programs aimed at reducing the impacts from natural hazards. Professional bodies, consultative groups such as the Queensland Tropical Cyclone Consultative Committee (QTCCC) and a range of industries provide advice on the management of natural hazards. The engineering profession plays a crucial part in mitigation, via Engineers Australia and Standards Australia. Research into natural hazards and their impact is undertaken at many universities. Consulting companies are able to provide a range of services including developing risk assessments, and analysing hazards and structural response. State and territory governments are responsible for administering planning laws and building regulations (formulated by the Australian Building Codes Board (ABCB)) to ensure that infrastructure and housing are built to an acceptable level of performance. State and territory governments, through the relevant emergency services agencies (e.g. Emergency Management Queensland-EMQ), work closely with the community to develop plans to minimize impacts of windstorms. Northern Territory, Queensland and Western Australia territory or state government departments also conduct educational programs for builders and allied professionals on these issues. Designers and builders are required to comply with the Building Codes of Australia provisions under the appropriate state or territory legislation. The Australian Building Codes Board (ABCB) sets the level of risk for building performance in the National Construction Code (NCC), with the primary objective of safeguarding people from injury arising from structural failures, and preventing loss of amenity and the protection of property. The NCC (2012) structural performance requirements specify that a building or structure, to the degree necessary, must resist the wind actions to which it may reasonably be subjected and remain stable and not collapse, prevent progressive collapse, minimize local damage and loss of amenity, and avoid causing damage to other properties. The NCC also specifies building requirements for resistance to bushfire attack and has recently prepared a draft standard for the construction of buildings in flood hazard areas. Windstorms Windstorms are recognized as the natural hazard that causes most of the damage to buildings in Australia, GeoScience Australia (2007). In addition to economic losses, these events also inflict a social cost on the community. Population growth is exposing more people and buildings to risks from these wind hazards. This risk is dependent on the frequency and intensity of windstorms, and the number of buildings exposed and their vulnerability. Windstorms are broadly classified according to their meteorological parameters, specifically: tropical cyclones, thunderstorms, tornados and gales. Thunderstorms and tornados are short-lived local events with their influence affecting distances of up to tens of kilometres. Cyclones generally impact coastal regions in the tropics, and 148����������Planning,�building�and�insuring� �
extend hundreds of kilometres, therefore having the potential to cause the most damage. Parts of Australia experience different types of windstorms and are characterized as either cyclonic or non-cyclonic wind regions in the wind load standard AS/NZS 1170.2 (2011). This standard, which excludes tornados from its scope of wind actions, classifies Australia into several regions, as shown in figure 6.1.1, and provides data for calculating wind loads used in the design of structures (e.g. houses). The cyclonic regions are identified with increasing severity as C and D extending 50km inland along Australia’s western, northern and eastern tropical coastlines. Non-cyclonic regions are classified as A1 to A5 and cover the southern parts and the interior of Australia. Decaying cyclone regions are classified as intermediate Region B.
Figure 6.1.1: Wind Regions of Australia (Copy of Figure 3.1(A) from AS/NZS 1170.2 (2011))
6.1.3 Tropical Cyclones Tropical cyclones develop over the warm oceans to Australia’s north during the summer months from November to April, and can generate destructive winds, heavy rain and flooding to many coastal areas in Western Australia, Northern Territory and Queensland. These are severe wind events in which winds rotate clockwise around a low pressure eye with a diameter generally of about 20-50 km, and track overland at varying speeds, before decaying into a low-pressure system. The passage of a cyclone past a given location will generate increasing, then decreasing, winds along with Planning,�building�and�insuring�����������149� �
changing wind directions, over a period of a number of hours. The impact of a cyclone is generally felt over an area of hundreds of square kilometres, over many days with the most destructive winds experienced just outside the eye. These destructive winds can cause extensive property damage and generate windborne debris. The Bureau of Meteorology categorizes cyclones with increasing severity from Category 1 to 5 according to the maximum expected wind speed and minimum central pressure, as shown in Table 6.1.1.
Table 6.1.1: Bureau of Meteorology Cyclone Categories Gust Wind Speed at 10 m height in flat open terrain
Central Pressure
km/h
knots
m/s
hPa
1
90-125
49-68
25-35
>990
2
125-164
68-89
35-46
970-985
3
165-224
89-121
46-62
950-965
4
225-279
121-151
62-78
930-945
5
>280
>151
>78
early 1980s
Reinforced masonry block, hip and gable, large truss spans, medium roof pitch, slab on ground
Images: Cyclone Testing Station, JCU The deterministic wind field model SEACATd was combined with the preliminary CTS housing wind resistance models to provide a software interface to estimate the number of houses suffering wind induced damage from a cyclone of given parameters (track, intensity, radius etc). In the model framework, topographic features, surrounding terrain
Planning,�building�and�insuring�����������177� �
and neighbouring structures were represented in accordance with the aerodynamic coefficients as detailed in the Wind Load Standard, AS/NZS 1170.2. For verification, the output of the combined SEACATd and CTS housing wind resistance model was calibrated against damage survey data. In this case, Tropical Cyclone Althea, which hit Townsville in 1971 was used to calibrate the output from the wind model and pre 1970’s houses. TC Althea caused overall damage levels in the order of 16% and a damage level of 68 % in an exposed coastal suburb, for pre-1970s housing for which the CTS model estimated the percentage of houses damaged at 15% for a shielded suburb and 71% in the exposed coastal suburb, which compares favourably with the reported damage. Other damage investigations following Tropical Cyclones Tracy and Vance for example, have been used for validation of specific data points. In recent times, damage survey data from TC Larry and TC Yasi have been used to validate outputs from an updated model developed by the CTS. The model generated output is intended to give an estimate of the number of houses sustaining wind damage when subjected to a specified wind speed. Limitations, assumptions and variability in the house resistance, distribution of house types, wind speed and terrain should all be considered when assessing the model output. The results of the model are sensitive to inputs and care should be taken in the interpretation of the output and findings as described in the Queensland Climate Change and Community Vulnerability to Tropical Cyclones – Cyclone Hazards Assessment (TS582 2003). “Variations in model parameters such as the construction quality (or the “strength”) of the housing stock and the proportion of houses that might be subjected to high internal pressure can play a large factor in the model’s estimation of overall damage. For defined districts within a community, the report estimates numbers of houses suffering damage and the types of structural failures, for each of the house types, for a specific cyclone. For various cyclone scenarios, areas of housing stock within the modelled districts are shown to have varying levels of vulnerability due to combinations of terrain, topographic and building type features. The study showed that the suburbs within the regions of Cairns is estimated to have a lower overall vulnerability of its housing stock to wind loads than the suburbs regions of Townsville and Mackay, because Cairns has a greater proportion of housing built following the introduction of engineered house building requirements in the early 1980’s.” The Queensland Climate Change and Community Vulnerability to Tropical Cyclones – Cyclone Hazards Assessment (TS582 2003) identifies the potential for reducing house damage by protecting the house envelope thus reducing the probability of subjecting the house to a large internal pressure. The project developed a detailed practical methodology for determining the vulnerability of houses within communities by combining a range of CTS house wind resistance models, with the SEA tropical cyclone wind field model. The CTS in collaboration with GA and JDH consulting has further developed methods for assessing the building vulnerability to windstorms. A more refined engineering model has been developed which can be used to assess building vulnerability, when the structural system, loading and load sharing characteristics are known. This model has been applied by Henderson and Ginger 178����������Planning,�building�and�insuring� �
(2007) to the Group 4 house, and shown to satisfactorily simulate the modes of failure with increasing wind speed.
6.2.3 Engineering Model - Vulnerability of House Structure Engineering vulnerability models estimate the damage caused by wind loads of varying intensity by applying mechanics of materials and structural engineering techniques. This requires reliable estimates of spatial and temporal variations in wind loads on a building and the structural (including all component and connection) responses. Knowledge of the possible modes of failure, including effects such as component fatigue, and the redistribution of forces as a result of component failures, is also required. These models are based on reliability analysis where the loads and component capacities are given in probabilistic terms. In practice, engineering-based vulnerability models use a combination of engineering and expert opinion. This approach has been used by Henderson and Ginger (2007) to develop a vulnerability model for a typical northern Australian house built prior to the adoption of current building standards. They modelled both the probability of damage occurring from different modes of failure as the wind speed increased and the probabilities of various levels of damage occurring at different wind speeds as a result of progressive failure, including the effect of debris damage and consequent internal pressurization. Good agreement was obtained with recorded information from damage surveys undertaken following major tropical cyclones which have impacted this form of housing in northern Australia. In this approach the wind load, effect W acting on components is given by the probabilistic model in Equation 6.2.3, where V is the maximum gust velocity at 10m height in terrain Category 2 in 50 years (lifetime) and the parameter B includes all the other parameters (including the tributary areas, pressure coefficients, factors accounting for surrounding terrain, topography and shielding and uncertainties in analysis methods) of the wind load effect. Pham et al (1983) and Holmes (1985) used a similar model to describe the wind load component in the limit state design approach used in developing AS/NZS 1170.2. The nominal values of these parameters (obtained from codes etc) are combined to give BN which is used to deduce the nominal design wind load effect, WN from Equation 6.2.4, where VN is the ultimate limit state design wind speed. W = B V2
(6.2.3)
WN = BN VN2
(6.2.4)
Probabilistic descriptions of each of the variables contained in B deduced from surveys and other studies are applied to obtain a probability distribution of the random variable B. In these assumptions, values in AS/NZS 1170.2 are generally considered conservative, on average, especially when calculating design wind load effects on the primary structure. However pressures on small tributary areas near windward roof edges can be underestimated and shielding benefits over-estimated on parts of the roof, by codes.
Planning,�building�and�insuring�����������179� �
The probability of failure of a component, as a result of its strength being exceeded by the wind load, can be obtained by comparing the wind load W with corresponding resistance R. The wind load W and resistance R are represented by random variables with probability density functions fW(W) and fR(R), with means ȝW and ȝR, as shown in Figure 6.2.3. Failure occurs when the wind load exceeds the resistance of the component. Hence, the aim of design is to ensure that the likelihood of R < W is very small for the life of the component. Therefore, the reliability can be measured in terms of the probability, P [R > W].
fR(R)
fW(W)�
111
ʅR�
ʅW�
Figure 6.2.3: Probability distributions - wind load W and component resistance R
Assuming that W and R are statistically independent, the probability of failure is given by Equation 6.2.5. f
pf
³F
R
(W ) fW (W )dW
(6.2.5)
�f
where, FR(R) is the cumulative probability distribution, such that W
FR (W )
³f
R
( R)dR (6.2.6)
�f
The probability of failure of each of the components of the house and progressive failures were determined by combinations of experimental testing of populations of components, examination of full scale testing, engineering analysis and detailed statistical observations following damage surveys. Wehner et al. (2010) describe the alpha version of a software tool being developed by GeoScience Australia for assessing the vulnerability of buildings in Australia. The creation of a dominant opening during a windstorm by the failure of a window or door can significantly increase the internal pressures thereby often increasing the probabilities of failure of the affected components. Such scenarios add to the uncertainty in the estimation of wind loads on individual components for a given incident wind speed. Failure of individual components leads to a redistribution of 180����������Planning,�building�and�insuring� �
forces which further increases uncertainty and affects the sequence of progressive failure. Windborne debris, which can consist of items such as tree branches or elements from damaged upwind buildings, can also add to the vulnerability. Furthermore, the damage to components such as garage doors, fascias and guttering is independent of structural design wind speed, as was observed in Tropical Cyclones Larry (Henderson et al. (2006)) and Yasi (Boughton et al (2011)). Unanwa et al. (2000) also used probabilistic methods including modelling the consequence of the failure of one component on the probabilities of failure of other components. They outlined a method for establishing a fully probabilistic engineering based vulnerability model for a building using fault trees to link possible modes of failure and their interaction with each other. They assumed wind loads were deterministic and given by formulas in a code. Similar methods were used by Pinelli et al. (2004) to develop vulnerability estimates for the Florida Public Hurricane Loss Model, and calibrate against recorded loss data, from hurricane damage in Florida. The development of a comprehensive engineering-based wind vulnerability model is constrained by the availability of adequate knowledge on the structural behaviour of building systems under wind loads, including both component behaviour and the consequential structural behaviour following failure of individual components. Further complications arise because small variations in component details can significantly change structural response, especially in domestic dwellings, and as damage to the structure could also change the pressure distributions acting on the house. The development of performance-based design of structures has resulted in a number of recent studies focusing on the vulnerability of structural systems under wind loads. Many of these, such as those by Ellingwood et al. (2004), Rosowsky and Ellingwood (2002), Henderson and Ginger (2007) and Jayasinghe and Ginger (2011), analyse the behaviour of critical components and their connections and the integration of this information to model the vulnerability of sub-systems such as the roof.
6.3 A Case Study Approach The following section analyses the vulnerability of two house types representing Pre1980s and Post-1980s houses in more detail by using engineering methods and structural component tests results. The high-set house shown in Figure 6.3.1 was constructed during the 1960s and into mid-1970s and represents a typical Pre-1980s house in cyclonic regions. Figure 6.3.2 shows a typical post-1980s house in cyclonic regions considered here based on a recent survey carried out in Townsville, where it was found that more than 90% of new houses utilized this type of masonry block construction.
Planning,�building�and�insuring�����������181� �
Figure 6.3.1: Typical Pre 1980s High set house (Henderson and Ginger (2007))
Figure 6.3.2: Completed Masonry Block house – Post 1980s (Jayasinghe (2012 ))
6.3.1 Case Study: Pre-1980s High-set house The Pre-1980s High-Set house is classified as a rectangular plan high set timber framed, fibre cement or timber-clad home constructed during the 1960s and into the early 1970s. These are rectangular plan, elevated timber framed houses; with FC or AC sheet exterior wall cladding, and metal roof cladding on a low to flat pitch gable end roof. The typical floor plan consists of three bedrooms at one end of the house with a large combined living room and dining area at the other. In these houses cyclone rods are present in perimeter walls at about 2 to 3 metres spacing. Alternatively a specific number of rods were stipulated for a house. Sometimes the rods extended to
182����������Planning,�building�and�insuring� �
overbattens, but the holding nuts interfered with the roofing and were often embedded in the batten, weakening it severely. A typical house of this period for Townsville was timber framed (as shown in Figure 6.3.3) , elevated on stumps about 2 to 2.5 metres high, with external walls clad with fibre cement or timber weatherboards and internal wall lining of either hardboard or plasterboard. The roofing was usually corrugated iron sheeting on a relatively low to flat pitch. The framing was typically of pitched construction meaning a traditional form of rafters, collar ties, ceiling joists and hanging beams all with nailed connections as opposed to current practice (beginning in the late 70s to early 80s) of a medium to high slope roof using roof trusses manufactured in a truss plant at a timber yard. The Pre-1980s low slope roof house sustained cyclone damage in both Townsville (Althea 1971) and Darwin (Tracy 1974) of which post disaster survey data is available. There are differences in geometry, materials and construction methods, not only between the two cities but within the cities for the generic type of house considered for this study. The differences in overall size, construction material, spacing of members, fixings, are incorporated into assessing the vulnerability through the coefficient of variation for the component strengths. Data surveys of the external features of housing along with detailed structural inspections of houses were carried out by CTS for Townsville as part of the Tropical Cyclone Coastal Impacts Program (TCCIP). The survey parameters and data collection method is detailed in Henderson and Harper (2003).
Figure 6.3.3: Elements in an idealized timber framed house (from TRADAC Timber framing manual, 1990) Planning,�building�and�insuring�����������183� �
The roof cladding was predominantly metal corrugated cladding typically fixed at every second crest at sheet edges and at 3-4-3 spacings for intermediate batten supports. For this house type the cladding was typically fixed to the battens with screws. No cyclone assemblies were used. Some examples of the cladding being fixed with roofing nails were observed during the Townsville survey. The battens were typically 75 x 38 mm hardwood spaced on average at 900 mm centres. The observed range of batten spacings in the Townsville houses inspected was 700 to 900 mm, with the majority at 900 mm. Walker (1975) found a range of 800 mm to 1100 mm. The battens were fixed to the rafters by two 3” nails or by a galvanized strap nailed to the rafter. The majority of the Townsville houses inspected had a pitched timber roof frame typically consisting of 100 x 50 mm rafters, 75 x 50 mm collar ties on every second rafter pair, and 100 x 50 mm ceiling joists adjacent to the rafters. The combined rafterceiling joist connection was tied down by skew nails and a 75 x 38 mm over batten with cyclone rods at approximately 3 m centres. Other roof structure construction types were graded purlin and nail plate trusses. The graded purlin construction used the ceiling joists as the principal structural members with the purlins increasing in height to generate the very low pitch roof slope. Pressed nail plate fabricated roof trusses were starting to be used in domestic construction, with framing anchors and over battens as hold down support. The walls have a hardwood frame with either a 75 x 75 mm or 75 x 50 mm top plate and 75 x 50 mm bottom plates and studs. Studs were spaced at 450 mm centres. Diagonal timber braces were typically 75 x 15 mm with two along end walls and at least two along the front and back walls. The walls were clad with fibre cement sheeting nailed at approximately 200 mm centres along studs. Some houses had a front face clad with timber weather boards, typically the log cabin profile. Internal walls were typically lined with hardboard in the earlier houses and in the later houses with plaster board. Typically these houses were supported on concrete piers, spaced 2.5 to 3 m apart. Diagonal timber cross bracing members were bolted to the piers with one 12 mm bolt each end. Many of the houses inspected had a single diagonal brace on each face of the house. The diagonal brace ran in different directions on the opposite face (i.e. top to bottom and bottom to top). In some cases there was no brace along the front face as it may have been assumed that the stairs would act as the diagonal brace. The majority of these houses now are generally enclosed underneath with masonry block walls. Knowledge of the interconnectivity of the house’s components and connections along with their strengths is important in understanding possible damage scenarios for the structure. The inter-dependency of failure modes was assumed using the failure paths shown in the tree diagram of Figure 6.3.4. The probability of failure of each component in the sub-structure classes were calculated at discrete wind speeds, followed by the application of rules related to the failure paths. For example, it is assumed that loss of roof cladding (i.e. Roof envelope damage) then precludes the loss of rafters (Roof
184����������Planning,�building�and�insuring� �
structure failure) since once the cladding has been lost there is no longer any surface to apply suction loads on the rafters. This is important considering the possible modifications that could be applied to the houses in either strengthening scenarios (up-grading) or modeling scenarios that account for degradation of components (e.g. corrosion). An example of this is from damage survey results after Cyclone Larry (Henderson et al 2006) of more than 1000 pre-1985 houses indicated that about 15% to 20% were subjected to damage ranging from minor (i.e. loss of roof sheeting, guttering etc.) to major (i.e. destruction of house). It is interesting to note that these reports detail a shift in failure mode away from the loss of roof cladding to a predominant loss of cladding with battens still attached. The shift is due to the partial upgrading of the structure with the strengthening of the roof cladding connection but not the subsequent joints (i.e. batten to rafter connection) along the roof hold-down path.
Undamaged� state�
Wall�
Roof� envelope�
cladding�
OR
Roof� structure� f l
Racking�failure�
Wall� collapse�
Pier�failure
Figure 6.3.4: Possible damage propagation paths for pre 1980s high-set house model Source: Derived from Henderson and Ginger (2007)
6.3.2 Case Study: Post-1980s Masonry Block House The dimensions and structural characteristics were gathered from surveys of contemporary houses under construction in the cyclonic region of North Queensland in Australia. The features such as size, shape, cladding, roof shape and pitch, method of construction, type of connections and structural system were taken from a survey of approximately 100 houses. The survey also reviewed certified drawings of houses submitted to the local authorities. More than 90% of the houses surveyed were of masonry block type. A typical house of this type is constructed on a concrete slab on ground with masonry block walls filled with concrete and continuous reinforcements at regular intervals from the bond beam at the top of the wall to the slab. These houses have either gable or hip roof shape or a combination of these. This study focuses on
Planning,�building�and�insuring�����������185� �
the gable shape roof, as they experience larger wind loads Meecham et al (1991) and post-disaster surveys reveal that they are more vulnerable to damage in windstorms. Figures 6:3:5 and 6:3:6 show a schematic diagram of a masonry block house and a masonry block house under construction, respectively. Based on the survey data, a single story gable end 10m × 19.8m × 2.7m low rise house with 0.6m roof overhang and 22.5 pitch represents features of a common contemporary house for the cyclonic region of North Queensland.
Figure 6.3.5: Schematic diagram of a Post 1980s Masonry Block House (Jayasinghe (2012 ))
186����������Planning,�building�and�insuring� �
Figure 6.3.6: Post 1980s Masonry Block house under construction (Jayasinghe (2012))
The roof structure of masonry block house consists of timber trusses and top-hat battens clad with metal roof sheeting. The trusses and battens are spaced nominally 900mm apart with an overhang of 600mm to fit the house dimensions. Figure 6:3:7 shows a schematic of the trusses and battens in a masonry block house. The timber trusses are manufactured from machine graded pine (MGP12) 90mm × 35mm components joined with toothed truss connector metal plates and connected to the bond beam at the top of the wall with a metal cleat bolted to the truss, as shown in Figure 6:3:8. In some cases, straps and angle brackets are also used to connect the truss to the wall instead of cleats. Top hat battens, (40mm × 40mm), manufactured from G550 steel with a base metal thickness (BMT) of 0.75mm are fixed to the top chord of these trusses with two Type17 screws (No14-10 × 25mm), as shown in Figure 6:3:9. The metal roof cladding is usually corrugated profile with a base metal thickness of 0.42mm and is attached to the battens using Type-17 cladding fasteners (No14-10 × 50mm) without cyclone washers, as shown in Figure 6:3:10. The typical spacing of the cladding fasteners is every second crest of the corrugations (152mm) but sometimes different spacings are used in the edges and middle of the roof. Ceiling sheeting (usually plasterboards) is fixed directly to the trusses or to metal ceiling battens connected to the bottom chord of trusses.
Planning,�building�and�insuring�����������187� �
Figure 6.3.7: Battens and trusses in masonry block house (Jayasinghe (2012 ))
Figure 6.3.8: Truss to wall connection (Jayasinghe (2012 ))
188����������Planning,�building�and�insuring� �
Type�17� Screws
Figure 6.3.9: Batten to truss connection (Jayasinghe (2012 ))
Cladding� fasteners�
Figure 6.3.10: Roof cladding to batten connections (Jayasinghe (2012 )) �
6.3.3 Vulnerability of houses This section presents the vulnerability of the selected pre-1980s High-set house and Post 1980s Masonry block houses built in cyclonic Region C, based on recent studies, structural testing and reliability analysis. The component strength data for each house type was derived from tests carried out by the CTS and structural engineering theories. The reliability of components in these houses was determined from probabilistic descriptions of wind loads and component strengths. The failure of a door or a window can create a dominant opening in a house leading to a significant increase in internal pressure. Failure of ceiling elements or the ceiling access manholes will transmit these high internal pressures to the roof cladding and as a result the wind loads on roofing components are increased. In this analysis, the percentage of houses subjected to higher internal pressure as a result of dominant opening in the envelope was taken to increase from 0% to maximum of 90% for approach gust wind speed of 40m/s to 80m/s. These values are based on limited damage investigation results and engineering judgement. The internal pressure Planning,�building�and�insuring�����������189� �
coefficient was calculated from AS/NZS 1170.2 (2011). Further studies are being conducted to refine these internal pressure estimates. This case study estimates the failure of a population of pre-1980s and post-1980s house types. Figures 6:3:11 and 6:3:12 show the percentage of pre-1980s houses and post-1980s houses that experience structural failure with increasing wind speeds. The figures show the difference in modelled performance of the two housing types analysed in the case study. For a 70 m/s wind speed (referenced at 10 m height), the pre-1980s housing suffers significant damage compared with about 5% for the post-1980s housing. Similar damage levels were observed following investigations after Tropical Cyclone Larry (Henderson et al 2006) and Tropical Cyclone Yasi (Boughton et al 2011), where damage to older housing was significantly greater than structural wind damage to post-1980s housing. As shown in these figures, the predicted failure of pre-1980s houses increases from 79% to 100% at 70m/s due to the effect of dominant opening in that house type and that for post-1980s houses increases from 1% to 5% at 70m/s as shown in the graphs. These figures show the influence of increased internal pressure on the vulnerability of these houses. Thus, the performance of houses can be improved by preventing dominant wall openings (i.e. increasing the resistance of windows and doors to wind-borne debris damage).
Figure 6.3.11: Vulnerability curve of pre 1980s houses for increasing wind speeds with and without internal pressure
190����������Planning,�building�and�insuring� �
Figure 6.3.12: Vulnerability curve of post-1980s contemporary houses for increasing wind speeds with and without internal pressure
AS/NZS 1170.2 provides information for selecting the design wind speed related to the return period. Figure 6.3.13 (below) shows the percentage of housing failure with the return period for a typical cyclonic region C, suburban site. These curves show the significant decrease in damage to housing that could be achieved if the older pre-1980s houses were to be upgraded to be as strong as the contemporary Post-1980s houses and so provide important information for building regulators.
Planning,�building�and�insuring�����������191� �
Figure 6.3.13: Vulnerability curves for pre-1980s and post 1980s houses with increasing return period
Figure 6.3.14 (below) shows estimated damage to houses for the pre-1980s case study when structural adaptation measures have been employed. It can be seen that merely screwing new roofing to the existing structure has a slight effect with the curve shifting indicating that slightly higher wind speeds are required to damage a similar number of houses. However, this now pushes failures to the “next weakest” level where roofing with battens attached were detached from the houses. This mode of failure was observed following Tropical Cyclone Larry as discussed above. If the roof batten to rafter connections are also upgraded to current building standards’ requirements the curve shifts further to the right. Figure 6.3.14 also shows that these two structural adaptation upgrades are not as effective as protecting all openings including doors to reduce the risk of having a dominant opening. Upgrading the roof, batten and rafter connections to similar requirements for current construction has the largest effect. However, this form of structural adaptation is the most invasive into the house structure.
192����������Planning,�building�and�insuring� �
Figure 6.3.14: Estimated damage from wind loads to houses with different structural adaptation measures
The wind speeds for building design given in AS/NZS 1170.2 (2011) are derived from statistically analysing long-term wind speed records from the Bureau of Meteorology. Long term wind speed data obtained from recording stations in various cyclonic and non-cyclonic wind regions of Australia are plotted in the form of return period against wind speed as shown in Figure 6.3.15 (below). The shape of these curves and the design wind speeds could be revised as more data becomes available. For example, an increase or decrease in frequency or intensity of high wind speeds will shift these curves to the right or left respectively. If there is a combined increase in both frequency and intensity then the overall vulnerability will increase even further. However, if the frequency and intensity of severe wind events are opposing, then there could be little or no change in the housing vulnerability. This scenario projected by the IPCC, may cause an increase in the wind speeds accompanied by a decrease in the frequency. Therefore, the overall effects of changes in the long-term wind climate on building design may not be significant considering the gradual changes to wind speed patterns and the 50 to 60 year design life applied for houses.
Planning,�building�and�insuring�����������193� �
Figure 6.3.15: Typical design wind speed versus return period
6.3.4 Internal Pressures An increase in internal pressure resulting from a dominant windward wall opening can more than double the net wind loads experienced by structural components of a building. The analysis carried out in this case study indicates that houses subjected to high positive internal pressure as a result of a dominant opening, are at an increased risk of damage compared to houses not experiencing high internal pressures. This shows the importance of ensuring the integrity of the house envelope. Furthermore, houses designed for a low internal pressure (as is the case with the current regulations for houses in non-cyclonic regions), are susceptible to significant damage in windstorms approaching design level wind speeds. This is especially important for IPCC projections where cyclones may impact regions where non-cyclonic criteria are applied for designing houses.
6.3.5 Construction Quality Wind damage to houses can also be reduced by preventing or at least minimising errors that often occur during building design and construction. CTS investigations and recent audits of design details in houses have shown typical errors by designers when selecting parameters. These errors included the selection of lower design site wind speeds, local pressure factors on the roof and internal pressure coefficient. Underestimation of these design parameters results in the use of components and connections of inadequate strength to withstand the design wind loads and consequently an increase in vulnerability.
194����������Planning,�building�and�insuring� �
Inspections of houses under construction in both cyclonic and non-cyclonic regions have revealed common construction faults that can significantly reduce the capacity of structural elements, leading to the failure of the structure. Typical faults were missing framing anchors, misalignment of truss cleats, inadequate fixings for windows and incorrect truss spacing and poor fixing installations. Design standards and manufacturers data do not account for these types of faults and poor construction practices. This is a reason for higher than expected failures of contemporary construction. A missing or poorly installed fastener can result in the failure of significant portions of a building, as adjacent fixings are overloaded and can fail in a cascading manner. However, these errors can be incorporated to some extent in the building vulnerability assessments using statistical terms such as those used in the analysis of this study.
6.3.6 Validation of the Model The approach for the vulnerability assessment presented here can be validated using post disaster surveys following cyclones. For example, structural damage from wind loads, excluding wind driven debris impacts, to contemporary housing in the Innisfail region following Tropical Cyclone Larry was reported as approximately 5 % (Henderson et al. (2006)). This is for wind speeds in the range of 50 to 65 m/s. Their study also showed that the 1960-70s housing had a probability of failure of 0.95 (i.e. 95 %) at a wind speed of 70 m/s. These values are consistent with the estimates reported in this case study. The results also indicate the marked improvements in housing design codes and standards, regulations, and construction since the implementation of the Queensland-Home-Building-Code (1981). However, designer and builder education, quality control and inspection must be maintained.
6.3.7 Limitations of the Case Study This analysis does not explicitly consider damage to the envelope (i.e. windows, garage doors, soffits, etc), attachments and ancillary components (gutters, sun shades etc.). The analysis also does not quantify damage resulting from water ingress and associated factors. Water ingress and associated damage to “non-structural” components of the house can be expected when heavy rain occurs with wind speeds greater than about 30 m/s. This damage will arise from the ingress of rain-water with a pressure difference across the envelope (i.e. net positive pressure across the roof and wall), and from the envelope being damaged by wind-borne debris or failure from wind of soffits, gutters and fascias, all allowing water to enter the house. The extent of water damage to the internal components (ceiling, wall plasterboard and carpets) will also increase with larger wind speeds, in parallel with more houses being damaged.
6.4 Conclusions Seneviratne et al (2012) state that: “There is generally low confidence in projections of changes in extreme winds because of the relatively few studies of projected extreme winds, and shortcomings in the simulations of these events”, (Page 113).
Planning,�building�and�insuring�����������195� �
However, they go on to note that an exception is mean tropical cyclone maximum wind speed, which is likely to increase (although this may not occur in all ocean basins) and it is also likely that the global frequency of tropical cyclones will either decrease or remain essentially unchanged.
The current design wind speed calculations (based on return period curves) are dependent on estimates of both the intensity and frequency of extreme winds. A number of studies carried out (i.e. Holmes (2008), Harper et al (2008), Ginger et al (2011)) have shown that there is no evidence of a trend in peak gust wind speeds measured in Australia over the past 60 years. Any changes to the design wind speeds specified in AS/NZS 1170.2 (2011) will require a comprehensive re-analysis of wind speeds recorded at weather stations and an improved level of confidence on future wind speed prediction models. Therefore, it is still unknown as to what extent the changing climate will influence the maximum wind gusts from windstorms for the typical fifty-year design life for housing. Nevertheless structural adaptation or strategies for houses built prior to 1980 in all parts of Australia and for houses built in non-cyclonic regions A and B post-1980 can significantly improve their resilience (or reduce vulnerability) to wind damage. The NCC regulations and design standards are revised to meet societal needs to balance an acceptable level of risk against implementation cost. With regards to wind loading design, these regulations have been updated significantly following Tropical Cyclone Tracy, with further changes after more recent events such as Tropical Cyclone Yasi. However, these changes are not retrospective and hence existing housing (the greater proportion of housing stock) is more vulnerable than new construction.
6.4.1 Adaptation Strategies to improve resilience of houses to windstorms Adaptation of Pre-1980s houses (cyclonic regions) As explained in the Case studies, the pre-1980s houses are significantly weaker than housing in cyclonic areas built since the early 80s. Structural upgrading (e.g. using details in HB132) are effective in reducing the vulnerability (i.e. increasing the strength of houses to wind loads) of these older houses. However the take-up of these measures is not widespread, as it requires removal and upgrading of roofing and strength of components within the roof space and wall area. This is a significant amount of work and may not be cost effective. However, if this upgrade to critical roofing connections is performed at the same time as the roof cladding is being replaced (typically after twenty to thirty years since construction), then access to the “roof space” is already available. As shown in the Case Studies, the prevention of a dominant opening occurring in the envelope is another option that provides an improvement to the resilience of these older houses. This can be accomplished by protecting all openings (windows and doors) using wind-borne debris impact resistant screens. There are limitations to the effectiveness of this method as it requires home owners to install shutters or screens
196����������Planning,�building�and�insuring� �
prior to cyclone’s impact and even then, a dominant opening can be created in the wall on areas away from windows by the impact of wind-borne debris. Adaptation of Housing in Non-Cyclonic regions The Case Studies show that reducing the possibility of creating a dominant opening on the windward walls/windows also provides a significant improvement in resilience for housing located in non-cyclonic regions of Australia. Therefore, protecting openings from wind-borne debris impact has the potential to be a viable upgrading option. Adaptation by promoting Community Education The CTS post-windstorm damage surveys (see appendices, Section 10.5) have shown that houses designed and built to the revised standards since the 1980s perform better structurally than houses built prior to 1980. These studies have also indicated that the current suite of loading, design and construction standards for housing in cyclone regions are effective. These houses are able to perform adequately to ultimate limit state wind loads. However, there were examples of houses designed and built that did not conform to the relevant standards, because of the; x
Use of un-conservative design parameters, such as not accounting for high internal pressure caused by a dominant opening, or incorrect site classification (i.e. low wind speed-up or shielding multipliers).
x
Poor or faulty construction practices such as unattached or missing fasteners, overdriven nails, component or connection spacings in excess of specified minimum distances.
x
Inappropriate use of materials for durability requirements (corrosion, rot, etc), and
x
Use of products that have not been designed, tested or installed for appropriate wind region (unrated roller doors and awnings, cladding and battens that have not been fatigue tested).
Education and awareness of the consequences of making un-conservative design assumptions, and of faulty construction (e.g. damage to property and risk to life) is required in every step of the building process (regulation, design, construction, certification and maintenance) and by all parties (designer, builder, certifier, and owner). Education and awareness is needed in the areas of; x
Correct interpretation of NCC provisions and application of design standards,
x
Testing and certifying building materials, connections, etc to the relevant standards,
x
Diligent construction practices, and correct application of materials and components as per manufacturer’s instructions,
x
Appropriate inspection and certification at time of construction, and Planning,�building�and�insuring�����������197� �
x
Ongoing inspections and maintenance for serviceable life of building.
Further research This study has presented a range of possible adaptation strategies that could be used to improve the resilience of housing to wind loading caused by severe wind events. It is recommended that probabilistic vulnerability modeling be conducted in conjunction with economic analysis to investigate relative costings for the different upgrade options. This will allow potential “Low Regret” adaptation measures (i.e. those where the benefits outweigh the costs for a range of possible climate change scenarios) to be identified.
198����������Planning,�building�and�insuring� �
7.
INSURING: BUSHFIRES IN RELATION TO BUILDING AND PROPERTY INSURANCE IN TASMANIA
7.1 Literature Review Introduction This literature review was prepared as part of a project funded by the National Climate Change Adaptation Research Facility (NCCARF). The role of NCCARF is to lead the research community in a national interdisciplinary effort to generate the information needed by decision-makers in government and in vulnerable sectors and communities to manage the risk of climate change impacts. This review is the first report for a project exploring and developing the role that insurance can play in climate change adaptation and risk mitigation, with a focus on bushfires in the Tasmania. We canvass the issues and context of bushfires in Australia; review the predictions that have been made regarding the impact of climate change on bushfire occurrence; introduce insurance as a mechanism for climate change adaptation and risk mitigation; discuss barriers and drivers for the use of insurance; and outline the rationale behind the project’s methodology and methods.
BUSHFIRES Background Of all the natural hazards in Australia, fire events are most notable as they have caused the greatest numbers of fatalities despite incurring the lowest of insured losses. In one of the nation’s most comprehensive analyses, the Bureau of Transport Economics used 1967-99 data to calculate an average annual cost of $77m for bushfires which comprises only 7% of all natural disaster costs (Gentle et al., 2001). The occurrence and impacts of fire events can be reduced significantly through mitigation (Middelmann, 2007). However, Australia continues to be affected by bushfires and the trauma, injury and death that result have high personal and social costs (Leicester and Handmer, 2008). For example, Victoria’s ‘Black Saturday’ bushfires caused 173 deaths and the loss of more than 2,000 homes on 7 February, 2009, and were deemed to be the worst such event in the nation’s recorded history due to factors including ‘unprecedented’ weather conditions (Teague et al., 2009). Climate change poses major concerns with this type of natural hazard as extended periods of drought and very hot days are expected to contribute to the occurrence of more extreme and potentially unprecedented events. Bushfires – also referred to as wildfires – mostly comprise grassland fires and forest fires, but can burn scrub and heath. In Australia half of bushfires are ignited by lightning, but up to 70% of those occurring in the south-eastern states are lit by people either deliberately through arson and as part of land-clearing, or by accident (Middelmann, 2007). The behaviour of bushfires is influenced by variables relating to fuel (vegetation class, fuel load, height, age and moisture content); weather (fire danger index, wind speed, ambient temperature and relative humidity); topography (effective slope, site slope and aspect); and the flame (temperature, emissivity, transmissivity, length, width and angle) and its configuration (with the radiant heat Planning,�building�and�insuring�����������199� �
receiver) (Tan and Midgeley, 2009). Bushfire attack on residential property is understood in terms of embers (number, quality, windborne and duration) as well as flame and radiation (duration and structural element or area attacked). Housing characteristics (design and materials) are also critical, as is the presence of outbuildings and fences (Blanchi and Leonard, 2008; Blanchi et al., 2006a, 2006b; Leonard et al., 2004). In addition, human factors such as knowledge, capability, timing and decision-making influence the outcomes of a fire event. Social activities including land-use, development and planning are also key factors influencing the exposure of people and property to fire risks.
Geographical context Bushfires are prevalent in the south-eastern states of Australia. There is also a fire season pattern that follows water and temperature gradients across the continent (Figure 7.1.1). Most bushfires occur in summer and autumn in the temperate regions of southern Australia (including WA, SA, NSW, the ACT, Victoria and Tasmania), and in winter and spring in the sub-tropical and tropical regions of northern Australia (including parts of WA, the NT, QLD and northern, coastal NSW).
Figure 7.1.1: Bushfire seasons across Australia (BoM and Lindesay, 2003, cited in Middelmann, 2007) Regional differences in Australia are socially and cultural produced (e.g., in political administrative systems), but are also apparent in the changing natural landscape. It is agreed in Australia, as elsewhere, that natural hazards, risk and disaster management is best undertaken, inter alia, through inter-governmental and inter-agency collaboration (COAG, 2004a, 2004b; Handmer and Dovers, 2007; Middelmann, 2007). This stance facilitates access to necessary resources but also accepts that the presence of natural hazards and any subsequent events are not contained by administrative boundaries. Variation in the exposure of each state and territory to natural hazards influences the possibility of disasters, and a number of seminal reports (Gentle et al., 2001; COAG, 2004a, 2004b; Middelmann, 2007) indicate the differences 200����������Planning,�building�and�insuring� �
in their occurrence and impacts on the nation. Specific disaster types can be identified with specific states or territories. In this context, naming the most costly types of event by location identifies cyclones in northern Australia (WA, NT and Queensland); floods on the east coast of Australia (NSW, Queensland, Victoria, Tasmania and South Australia); and bushfires in south-eastern Australia (Tasmania, Victoria and ACT) (Table 7.1.1). Table 7.1.1: Most costly types of natural disaster 1967-1999 by state and territory (Gentle et al., 2001) State or territory
Natural disasters
New South Wales
Floods, storms
Queensland
Floods, tropical cyclones
Victoria
Floods, bushfires
Western Australia
Tropical cyclones, storms
South Australia
Floods, storms
Tasmania
Bushfires, floods
Northern Territory
Tropical cyclones, floods
Australian Capital Territory
Bushfires, storms
The identification of bushfires as the most costly natural hazards in south-eastern Australia can be cross-referenced with the temperate region encompassing three Building Code of Australia climate zones – BCA zones 5,6,7 (Figure 7.1.2). In general these zones experience mild to warm summers and cool to cold winters.
Planning,�building�and�insuring�����������201� �
Figure 7.1.2: Climate zones of Australia according to BCA (Your Home, n.d.)
There are several iconic fire events in Australia’s history – all in south-eastern Australia – that caused significant damage to property with great loss of life. Prior to the 2009 ‘Black Saturday’ bushfires, fire events in Victoria, NSW and Tasmania already accounted for 85% of all deaths since 1900 (Table 7.1.2). Built assets including private homes are the other main component of loss in bushfires (Table 7.1.3). In addition, environmental damage can be extensive with some fire events impacting on agricultural production, natural resources and biodiversity, and causing habitat loss and erosion.
202����������Planning,�building�and�insuring� �
Table 7.1.2: Bushfire fatalities per state 1900-2008 (Haynes et al., 2010) State
Number
Percentage
Victoria
296
53.6
New South Wales
105
19.0
Tasmania
67
12.1
South Australia
44
8.0
Queensland
17
3.1
Western Australia
17
3.1
Australian Capital Territory
5
0.9
Northern Territory
1
0.2
Total
552
100.0
Table 7.1.3: Most significant Australian bushfires since 1900 (Haynes et al., 2010; Teague et al., 2009) Date
States
Homes lost
Lives lost
14 February, 1926
Vic.
550
39
8-13 January, 1939 ‘Black Thursday’
Vic., NSW
650
79
Summer, 1943-44
Vic.
885
46
7 February, 1967
Tas. (Hobart)
1557
64
8 January, 1969
Vic. (Lara)
230
21
16 February, 1983 ‘Ash Wednesday’
Vic., S.A.
2253
60
18 February, 2003
A.C.T. (Canberra)
530
4
11 January, 2005 ‘Black Tuesday’
S.A. (Eyre Pen.)
93
9
7 February, 2009 ‘Black Saturday’
Vic.
2039
173
Many of the largest bushfires in Australia have triggered state inquiries and royal commissions because of high levels of property damage and significant loss of life (Loh, 2009). The fire management agencies and activities instituted after the 1939 ‘Black Thursday’ bushfires in Victoria and NSW, for example, still remain in force today. Planning,�building�and�insuring�����������203� �
Reviews of current policy and practices have been completed in Victoria as a result of the 2009 bushfires and subsequent royal commission (Teague et al., 2010). It is also important to note that low intensity bushfires remain a critical and regenerative part of the Australian landscape. Measures of bushfire risk and loss Even with the relative stability in the risk of fire events and losses incurred from damage to residential buildings, and with the emphasis on the use of building regulation and land-use planning as key mechanisms, there is a place for econometric, financial and insurance approaches to bushfire management in Australia. There are a number of studies that quantify bushfire risk and losses. For example, using 2005 as a base year, Ashe et al. (2009) estimate the total cost of fires in Australia (house fires as well as bushfires) to be almost $12b or 1.3% of GDP, but they query the efficiency of investing $10.2b in preparation and response so as to manage an actual direct loss of only $1.7b or 14% of the total cost of fire. Other studies – using different measures – have assessed, for example, the costs and benefits of on-ground and aerial fire suppression as economically efficient (Ganewatta and Handmer, 2006, 2009; Ganewatta et al., 2006). It is important to note the social as well as the purely economic and financial foundations of mechanisms such as insurance in bushfire mitigation and climate change adaptation. In the case of the Canberra bushfires, social capital has been deemed as important as financial capital because bonding through networks and intracommunity bridging are what provided the capacity to cope with the event (ACT Government, 2003; Camilleri et al., 2007; Winkworth et al., 2009). With regard to the quantification and pricing of bushfire risks to property in Australia, Chen and McAneney (2005), McAneney (2005) and McAneney et al. (2007) identify up to 340,000 houses within 50m of bushland and thus at ‘high risk’. Building damage can also be standardized across all event types, although in bushfires it tends to be a binary assessment with either total or no loss resulting (Blong, 2003). Using over 70years’ worth of data, McAneney (2005) suggests that the average 1 in 100 year and 1 in 250 year bushfire events would cause $0.7b and $1.1b losses – losses equivalent in present day terms to the insured losses incurred in Australia’s greatest disasters: tropical cyclone Tracy and the Newcastle earthquake, respectively. However, as McAneney (2005) calculates an average annual loss of just 83 homes, the risk to a particular home in any one year is low, which provides no consolation for those people directly affected. Instead of drawing attention to the need to address issues of vulnerability and resilience, it may instead vindicate inaction. There are also other problems associated with such quantification. Some destruction of homes is expected in 55% to 60% of years (Crompton et al., 2008; McAneney, 2005), and for Crompton et al. (2008) the likelihood of an event incurring the loss of at least 25 homes falls to 40%. Notably this does not reach the $10m threshold (even at current asset values) at which the Australian Government can declare a national disaster, triggering inclusion on the ICA Disaster list and provision of Natural Disaster Relief and Recovery Assistance funds. McAneney (2005) calculates a $62.4m national risk
204����������Planning,�building�and�insuring� �
premium, but this calculation excludes loss of life, the fixed costs for bushfire fighting services, opportunity costs of volunteer fire fighters, and government contributions. According to insurance agencies, the higher costs of other event types make bushfire a more negligible risk (Walker, 2003). However, insurance administration costs for fire hazards each year in Australia have been estimated at $325m excluding transfers between insurers and policy holders (Ashe et al., 2009). Current management Approaches to hazard management reflect differences arising with historical and geographical context, a multiplicity of stakeholders, and tiers of governance. Disaster planning, preparation, response and recovery in Australia is guided by international protocols and procedures for emergency risk management and planning of safer communities (EMA, 2002; 2004a; 2004b), and is based on Australian Standards (AS/NZS, 2004). It is also supported by the Commonwealth through the provision of research programs, coordinated response efforts, and financial assistance for relief and recovery. Implementation occurs at the state or territory, and local government levels. Bushfire management has been informed by reviews and recommendations from a range of recent disasters (ACT Government, 2003; Camilleri et al., 2007; Ellis et al., 2004; Esplin et al., 2003; Teague et al., 2009, 2010). For example, to address impediments to performance and compliance when disasters cross jurisdictions, there has been a call for a set of national bushfire management principles aimed at establishing and communicating shared goals and a common management framework (Ellis et al., 2004). Other areas of activity informed by recent bushfire events include: x x
x
x
Risk avoidance through land-use zoning and prohibitions; road design and siting; and hazard mapping and overlays. Likelihood reduction through vegetation clearance; prescribed burning; pest and weed management; use of firebreaks, set-backs and fuel breaks; arson control; restricted access; and land-use diversification and fragmentation. Consequence reduction through readiness of water supplies; fire bans; early detection; ICT; training of fire-fighters; management plans; and response and recovery. Risk transference through good information, communication, awareness-raising and community education (Esplin et al., 2003).
The tools of bushfire management include use of fire danger indices, and various models incorporating multiple variables, probabilities, stochastics and Monte Carlo simulations in order to determine the risks of bushfire attack and building destruction (Blanchi and Leonard, 2008; Blanchi et al., 2006a; 2006b; Leonard et al., 2004; Tan and Midgeley, 2009; Tolhurst et al., 2006; 2008). Geographical Information Systems (GIS) are increasingly used for bushfire management. Applications of this technology indicate that the proximity of buildings to bushland is a critical fire risk factor at the urban-rural interface and that this can be easily quantified (Blanchi et al., 2004; Chen and McAneney, 2004, 2005; McAneney et al., 2007). Planning,�building�and�insuring�����������205� �
In policy and practice, various state government agencies have provided regulations and advice on building in fire prone areas (CFA, 2002; TFS, 2005). This includes a recent review conducted in Tasmania (DPAC, 2010). The well known ‘Prepare, stay and defend or leave early’ or ‘Stay or go’ policy (AFAC, 2010) has proven valuable for promoting self-reliance and safety, but problems with this policy have also been highlighted, such as the lack of information concerning the danger of late evacuation (Haynes et al., 2010; Leicester and Handmer, 2008; Tibbitts and Whittaker, 2007). A lack of consensus in the policy arena also exists with major differences amongst fire service providers, and between these providers and community stakeholders (Marton and Phillips, 2005). Fire events in Australia test management capacities at all levels of governance, and research and reviews continue to involve stakeholders in efforts to increase understanding and improve practice. The main service providers are the state Fire Service and Country Fire Authorities (CFA). Important agencies include the Bushfire CRC (http://www.bushfirecrc.com/) which brings together universities, CSIRO, government agencies and industry on research collaborations that promote community safety and bushfire management; and the Australasian Fire Authorities Council (AFAC) as the peak advisory body on policy and standards (http://www.afac.com.au/). The Bureau of Meteorology (www.bom.gov.au/), Insurance Council of Australia ICA (http://www.insurancecouncil.com.au/) and Emergency Management Australia EMA (www.ema.gov.au/) are other key agencies. The stakeholders include members of the community, businesses, schools, other organisations and the media. However, the emphasis on land, land-use and the built environment affords critical roles to householders and property owners, planners, developers, architects, engineers, landscape designers and other professionals and practitioners in sectors such as housing and construction. There is great complexity to managing bushfire risk given the large number of actors involved in public and private settings across different scales. Problems with crosssectoral communication and collaboration have therefore been noted in national inquiries after major bushfires (ACT Government, 2003; Camilleri et al., 2007; Ellis et al., 2004; Esplin et al., 2003; Teague et al., 2009, 2010). Difficulties exist with land-use planning for bushfire management at a state level (Buxton et al. 2011; Hughes and Mercer 2009) and for management of natural disasters generally within sectors such as public housing (Williams et al. 2009). These issues are also relevant to increased risks arising in the context of climate change and with need for adaptation. Climate change and bushfire management Different emissions scenarios and time periods can be used in climate modelling to explore the possible impact of climate change on bushfire risks. Pitman et al. (2007), for example, demonstrate a consistent increase in regional scale fire risks across Australia driven by warming and reductions in relative humidity. Such research confirms the likelihood of a significant increase in risk as ‘very high.’ Increased temperatures and precipitation in winter may also encourage vegetative growth and hence contribute to greater summer fuel loads in the temperate region of south-eastern Australia. Williams et al. (2001) suggest the likelihood of a more severe, earlier and perhaps protracted fire season in southern Australia. 206����������Planning,�building�and�insuring� �
Further research indicates that the frequency of days with ‘very high’ or ‘extreme’ FDI ratings is likely to increase by between 4% and 25% by 2020 and between 15% and 70% by 2050 (Hennessy et al., 2005). A more recent study revised these results upwards. Lucas et al. (2007) suggest that projected ‘very high’ fire danger days will increase between 2% and 30% by 2020 and between 5% and 100% by 2050; and ‘extreme’ fire danger days will increase between 5% and 65% by 2020 and between 10% and 300% by 2050. More frequent and intense fire events are likely with the expected increases in temperature and decreases in rainfall. In addition, it is probable that the window of opportunity for prescribed burning will be reduced and increased pressures on water availability will affect the capacity to manage bushfires (Hennessy et al., 2005, 2007; Lucas et al., 2007; Pitman et al., 2007; Williams et al., 2001). Fine-scale modelling with greater spatial resolution provides more useful information at the local scale. Its use in Tasmania shows less change in temperature than national models, and changes in annual and seasonal rainfall have a complex spatial pattern, positive and negative values, and considerable seasonal variation, with implications for extreme events at the local level (Grose et al., 2010; White et al., 2010). Based on scenarios, predictions and observations, bushfire management will be increasingly informed by the concepts and practices of climate change adaptation and risk mitigation. However, it is important to note that analyses of normalized data for natural (meteorological) hazards between 1967-2006 suggest no real impact of climate change on insured losses, and instead note that a rise in losses can be explained by increasing number of dwellings and value of assets (Crompton and McAneney, 2008; Crompton et al., 2008, 2010; McAneney, 2005). Yet, climate change scenarios and predictions should not be ignored as the expected increase in extreme events continues to point to greater bushfire risk especially at the rural-urban interface (Blong, 2004, 2005; McAneney et al., 2007, 2009). Managing this risk necessarily and increasingly relies on the use of mechanisms such as land-use planning, building regulations and insurance practices. Human activities have significant influence on bushfire risk and its management. The dynamism and heterogeneity of a community produce great variations in how the risks and realities of bushfire are constructed (Bushnell et al., 2007), and both the vulnerability and the resilience of communities are critical in the management of bushfire risk (Braun, 2006). There is increased need for effective planning and community education in light of Australia’s continued urban and peri-urban growth, especially with the development of rural subdivisions adjacent to national parks, the limited awareness of newly arrived residents, and the differences in perceived roles and responsibilities of local governments (Balcombe, 2009; Bushnell and Cottrell, 2007; Cottrell and King, 2007; Gurran, 2005; Gurran et al., 2007). Ideas about what constitutes the rural/urban interface, peri-urban region, a locality or a community all require further clarification, and an understanding of people and place remains central to managing with bushfire hazards (Cottrell, 2005; King and Cottrell, 2009). Communities remain an integral component and major resource in preparing for bushfires (Balcombe, 2009; Bushnell and Cottrell, 2007) and recovering from them (ACT Government, 2003; Camilleri et al., 2007; Winkworth et al., 2009).
Planning,�building�and�insuring�����������207� �
The bushfire risk comprises highly variable, multi-stakeholder, cross-scale, and spatiotemporal problems which in turn demand appropriately sophisticated responses, responses that must include all levels of government as well as the courts and legal institutions and processes (Eburn, 2009; Loh, 2009). Still, bushfire management continues to be associated mostly with the effective management of land and the built environment through building regulation and land-use planning at the local and state government level (see, e.g., AFAC, 2010; CFA, 2002; Gill, 2005; Hughes and Mercer, 2009; TFS, 2005; DPAC, 2010). At the national level, the focus on managing fire hazards in the built environment has been summarised by COAG (2004) as follows: “In some communities, Local Government authorities have specific regulations controlling home siting, design and building materials in fire prone areas. Other mitigation measures for fire typically, but not exclusively, include the following: • land use management to limit development in high bushfire risk areas • siting of structures (away from the top of slopes/ridges) • building codes for fire hazards • fire resistant building materials • planting of fire-resistant vegetation • bushfire breaks • controlled (or prescribed) burning • removal of bushfire ‘fuel’… from around house and gutters • secure storage of flammable materials (wood, paint and fuel) • fire weather warning systems • community awareness of bushfire risk • sufficient water supply and hoses • protective clothing, and • fire evacuation plan” (COAG, 2004a, p.143). Building design and materials, development layout and location, and land-use and zoning are all critical factors. Guides and handbooks also target the individual home and householder, and builders and developers, as well as the planning and building regulatory agencies (see, e.g., Ramsay and Rudolph, 2003; Schauble, 2004). The advice offered usually refers to the Building Code of Australia (BCA) and the Australian Standard for Construction in Bushfire Prone Areas (AS3959) for methods to increase a building’s bushfire resistance. These provide details relating to much of the above (e.g., building is of simple design, in an area of low to moderate bushfire risk away from hill crests, preferably on a concrete slab, with continuous low-pitch roofline, minimal offsets, and non-combustible materials), but extends to notions of ‘defendable space’
208����������Planning,�building�and�insuring� �
and ‘modified buffer zones’, and covers topics such as outdoor landscaping, facilitysiting and selective planting of fire-resistant plant species (Figure 7.1.3). Building regulation and land-use planning are the main mechanisms of bushfire management in Australia, and insurance is little if ever mentioned. For example, in its risk assessment of natural hazards in Australia, the government agency Geoscience Australia examined bushfire hazard and identified tools for bushfire management but not insurance as a key mechanism (see Middelmann, 2007). At local and state level, both building regulation and land-use planning are the key mechanisms of bushfire management (see, e.g., Buxton et al, 2011; DPAC, 2010; Hughes and Mercer, 2009; TFS, 2005). Insurance is rarely if ever mentioned here and even then it is only ever in a limited capacity. At the community and household level, people are advised to get insurance but its purchase is recommended so as ‘to cover the full replacement cost of assets’ rather than to influence risk behaviours (see AFAC, 2010).
Figure 7.1.3: Layout for building in a bushfire prone area (TFS, 2005) Planning and building comprise are central to the recommendations made in postbushfire reports (see, e.g., Ellis et al., 2004; Esplin et al., 2003; Teague et al., 2009, 2010). These reports have still only variously, albeit more consistently than in the above, noted the need for insurance to be a key part of bushfire management. The issues identified include problems of non-insurance and under-insurance in light of the need to maintain appropriate levels of coverage as a preparedness measure; the variable performance of insurance companies in responding in a sympathetic, flexible and timely manner after bushfire events; the high costs of insurance due to overtaxation with state and federal government imposed stamp duties, fire levies and GST;
Planning,�building�and�insuring�����������209� �
and the insurance sector’s reluctance to reward policy holders for modifying risks on their property. However, insurance is starting to be identified as a key mechanism for climate change adaptation as well as risk management in relation to both wildfires in the USA (Berry and Carpenter, 2010; Talberth et al., 2006) and veldfires in South Africa (Forsyth et al., 2010). There is now also developed a sophisticated context for understanding such challenges as climate adaptation in terms of the latest work in socio-ecological systems theory (Adger et al., 2005; Chapin et al., 2009; Pelling 2011). The role of resilience together with that of vulnerability remains central to the approaches used in disaster management (King and Cottrell, 2009) but is now also critical to working with complex adaptive systems (Miller et al., 2010; Morecroft et al., 2012). Such approaches are informing research on bushfire risks overseas (e.g., Butler and Goldstein, 2010). However, insurance is not mentioned in the context of developed countries such as Australia, and features only briefly in the very different context of developed countries (see, e.g., Pelling, 2011). That said, the insights from socioecological systems theory suggest that any understanding of the possible roles of insurance in climate change adaptation in Australia warrants a focus on multiple actors in dynamic, cross-scalar settings with an emphasis on governance.
INSURANCE Insurance provides a way to share risk through contractual transactions with relatively small payments guaranteeing financial protection against a potentially large loss. It has traditionally involved risk identification and evaluation or assessment, followed by risk control and financing. The probabilistic calculations of risk models and possible maximum losses underpin practices of risk pricing (e.g., calculating actuarially derived premiums and deductibles) and limiting liability (e.g., not offering cover in high risk areas). Excessive exposure of one insurer to a catastrophic event can be limited through reinsurance with another provider, but there are also alternative risk transfers including insurance-linked securities such as Cat-bonds and weather derivatives. The private insurance market does not accept all risks and as such government also has a significant role as insurer of last resort. For example in the US, the National Flood Insurance Program is a government funded and run initiative. Various levels of government also offer earthquake and wind pools to low-income households and for residents in high-risk areas. The pricing of such programs is intentionally affordable and may not accurately reflect the risk. Some argue that this may contribute to moral hazard – the reticence of households to undertake risk mitigation because they feel themselves adequately protected by insurance (Kousky, 2010). Governments also manage reserve funds in the event of disaster. In Australia insurance is available through the private market but the Commonwealth provides significant assistance post-disaster through relief and recovery funding. The government’s acting as the insurer of last resort raises questions about the effectiveness (or not) of pricing and sharing risks through the insurance market. There are then ramifications for the possible role of insurance in climate adaptation.
210����������Planning,�building�and�insuring� �
The insurance industry comprises individual and institutional actors that provide insurance and reinsurance, brokers and financiers, amongst others. The provision of insurance services is based in North America, the EU and Japan. The uptake there is reflected in high potential costs of damage to buildings and infrastructure, but the loss of life due to natural disasters is significantly greater in developing nations. As a major global financial investor the insurance sector has potential to influence the risks posed by natural hazards and climate change, and it is playing an increasing role in promoting sustainable development particularly in the developing world (Warner et al., 2009). Insurance industry representatives worldwide have noted over recent decades the rise in economic and insured losses due to extreme events but as previously observed with regard to the Australian context, the main drivers for such increases remain population growth, urbanization, and affluence (Kunreuther, 2006; Smolka 2006). Now, however, the insurance industry is paying increasing attention to climate change and associated predictions (ABI, 2009; Dlugolecki, 2009; Geneva Association, 2009; Hecht, 2008; Herweijer et al., 2009; Kleindorfer, 2009; Maynard, 2008; Mills, 2008, 2009a, 2009b; Sato and Seki, 2010; Warner et al., 2009; Wilkins, 2010). The industry recognises that more frequent and severe events are to be expected, and that both opportunities and limitations exist, specifically in the area of adaptation. One of Australia’s largest reports on natural hazards (COAG, 2004a) identifies insurance as critical to the nation’s effective management of natural disaster. In addition to questions about insurance availability and affordability, this report also addresses issues such as the exclusion of riverine flooding (and increasingly cyclones) from household and small business insurance policies, and continuing levels of noninsurance and underinsurance. The emphasis too is on national disaster mitigation rather than adaptation. The report places emphasis on disaster mitigation rather than adaptation, recommending that, amongst other things: “the insurance industry should take active steps to: • ensure the availability and affordability of all hazards, natural disaster insurance as part of standard insurance policy cover • work with the new national emergency management machinery to develop a single national definition of natural hazards, including water damage, to be offered by all insurers, and • agree to a national system of disclosure of insurance company premiums, number of policyholders, exclusions and claims to the Commonwealth’s insurance industry regulator so that an accurate picture of the costs of natural disasters and the role of insurance can be developed” (COAG, 2004a, p.xi). However, in Australia and as previously discussed, building controls and land-use planning continue to be identified more often than insurance as the key components of disaster management and climate change adaptation (see for example Dovers, 2009; Handmer and Dovers, 2007). The insurance sector is an important component of natural hazards management and climate change adaptation. Its role is currently under-utilized in Australia especially in Planning,�building�and�insuring�����������211� �
relation to bushfire. The insights above invite further analysis of the role of insurance as a mechanism of climate change adaptation in relation to the risks of bushfire in the built environment understood as a complex adaptive system. As numerous bushfire inquiries have noted, there is opportunity and need for insurance companies to work with governments, business and communities in providing information and incentives for the implementation of bushfire mitigation and adaptation (Ellis et al., 2004; Esplin et al., 2003; Teague et al., 2009).
Methodology Generic all-hazards approach Disaster management in the developed world generally employs a generic or allhazards approach. This is the prevailing paradigm in the UK, USA and New Zealand (see for example Britton, 2002; McEntire et al., 2002; Mileti, 1999; O’Brien and Read, 2005; Quarantelli, 1997) as well as in Australia (Handmer and Dovers, 2007; Middelmann, 2007). Efficiencies are derived with integration and there are benefits in extending a community’s preparedness for one type of event to cover all possible disasters. The generic approach to disaster management includes preparation for technological emergencies but its development in western nations post-9/11 has seen a focus on terrorism. This includes a growth in civil contingencies and crisis planning, and a centralisation of government powers (McConnell and Drennan, 2006; Perry and Lindell, 2003). Now climate change is also being recognised as a key concern, and this recognition is driving the development of new policy and practice overseas and in Australia. In disaster management there has also been a shift in recent decades from response and recovery towards planning and preparedness (Table 7.2.1) (Pearce, 2003; Perry and Lindell, 2003). This shift includes increased attention to issues of vulnerability rather than specific hazards; the use of more proactive measures such as land-use policies and management plans; the pursuit of multi-agency and multi-disciplinary approaches; and working more closely with communities. It is acknowledged that in order to succeed, these approaches need to be participatory and linked to individuals and institutions, their values, interests and goals, and local decision-making processes (Christoplos et al., 2001; Pearce, 2003).
212����������Planning,�building�and�insuring� �
Table 7.2.1: The shift in disaster management strategies (Pearce, 2003) From…
To…
Hazards
Vulnerability
Reactive
Proactive
Single agency
Partnerships
Science driven
Multi-disciplinary approach
Response management
Risk management
Planning for communities
Planning with communities
Communicating to communities
Communicating with communities
The generic approach to disaster management has important resonances with this research project. It includes our concern with climate change understood in broad terms and applied generally in working with communities to build capacities for resilience, and our focus on the possible roles for some of the key adaptive mechanisms. In addition, being able to focus on particular details, and flexible enough to allow for contingency, is important. Likewise, regional differences comprise some of the key factors variously influencing natural hazards, which are well worth noting in the management of possible disasters, but a focus on regions also affords an opportunity to make generalisations. Natural disasters tend to be localised in origin with impacts extending to create large and complex regional events that require national and international assistance. In recognition of the localised and regional nature of such disasters, recent research has turned to consider natural hazards in relation to ‘hotspots’ and ‘case studies’ (Arnold et al., 2005, 2006; Christianson et al., 2011; Thomas et al., 2011). Such work reveals that the large aggregated datasets underpinning national and international comparisons demand more attention to detail. For Arnold et al. (2006, p.xiv) ‘scale matters’ because geographic areas identified as vulnerable in a global analysis contain much internal, sub-national variation. As such, the merits of generic all-hazards approaches to disaster management remain, but benefits of alternative approaches, such as case studies, are also being explored (Wall, 2006). Case study approach Of the research approaches available, the use of case studies is deemed the most appropriate for this project as it allows for the comparison of similarities and the contrast of differences across regions. It also permits general claims to be made whilst exploring specific details. One of the strengths of case studies is that they allow
Planning,�building�and�insuring�����������213� �
particular instances or cases to be built so as to provide rich contextual detail and powerful examples (Flyvbjerg, 2006). Case studies have been wrongly seen as relativistic and subjective descriptions that are too particular to have broader application. The use of case studies in social science research (e.g. Yin, 2003) has, however, demonstrated that this approach to research is methodologically robust. It is a means of deploying both qualitative and quantitative methods, and combining interpretive and causal understandings to produce valid generalizations. For example, case-based comparisons are frequently used to gain purchase beyond the particularities of a particular location or issue (Byrne and Ragin, 2009). Case selection may be random but in seeking particular information can look to extreme, critical or paradigmatic cases, or cases with maximum range or variation (Flyvbjerg, 2006). The movement between the idiographic and nomothetic approaches in analysis of a number of singular cases is useful in natural hazards and disaster management research where the occurrence of events tends to be unique but demands that lessons be drawn for application elsewhere. The comparative insights here are valuable but problems can arise with comparisons made between more and less developed nations (Quarantelli, 1992, 1997) or between rural towns and metropolitan areas (Handmer, 2006). However, if attention is paid to the limitations of knowledge claims and how they are constructed, case studies provide valuable data and insights. For example, case studies and analogues have proven useful in climate change research focussing on human dimensions such as vulnerability (Ford et al., 2010).
Conclusion In this literature review we have covered key areas of understanding and knowledge that inform our approach to considering the role of insurance in climate change adaptation and risk mitigation, with a focus on bushfire hazards in the Tasmanian context. Bushfires are broadly defined and their geographical context in Australia generally, and Tasmania specifically have been introduced. Current management structures and initiatives have been described. We have canvassed the predicted impact of climate change on the occurrence of bushfires, highlighting that more extreme fire events are predicted and that losses can be expected to rise. As discussed, natural disaster management is evolving in light of climate change, with more emphasis being placed on planning and preparedness, specifically adaptation and mitigation. We draw attention to recognition in Australia and overseas that insurance has a significant role to play not only in recovery, but in preparedness. How insurance operates or may operate in disaster management is reviewed, and we include here a critique of current work that measures bushfire risk and loss in fiscal terms. Finally, we canvass two possible approaches to research in this area and conclude that a case study methodology is the most appropriate for this project.
214����������Planning,�building�and�insuring� �
7.2 Case Study: Bushfires in relation to Building and Property Insurance in Tasmania Introduction The role of insurance in climate change adaptation and natural risk mitigation is most commonly understood to be a measure associated with recovery rather preparedness. In Australia, it is building controls and land-use planning mechanisms, and not insurance, that are commonly identified as the key components of adaptation and mitigation (see e.g., Dovers, 2009; Handmer and Dovers, 2007). For example, in postbushfire reports planning and building issues dominate recommendations (see, e.g., Ellis et al., 2004; Esplin et al., 2003; Teague et al., 2009, 2010). However, these reports also point to the important role that insurance may play in bushfire management, including the need to address issues of non-insurance and underinsurance (Teague et al., 2010). Overseas, insurance is identified as a key mechanism for climate change adaptation and risk mitigation including in relation to wildfires in the USA (Berry and Carpenter, 2010; Talberth et al., 2006) and veldfires in South Africa (Forsyth et al., 2010).Yet in Australia, it appears that the role of insurance remains poorly understood, underdeveloped and hence under-utilised. In this report we engage with the perspectives and knowledge of key stakeholders to identify issues concerning the role of insurance in bushfire mitigation in the Tasmanian context. We discuss these issues also in relation to an emerging national and burgeoning international literature on the role of insurance in disaster mitigation and climate change adaptation. We subsequently present three key findings, nine subfindings, and sixteen associated recommendations. Due to the current limited knowledge regarding the role of insurance, particularly within an Australian context, a majority of recommendations that we make relate to the need for further research. We emphasise the significant role that the federal government has to play here, and the importance of collaboration amongst all levels of government and between community and private sector organisations as well as with households, businesses and individuals. As noted earlier, of all the natural hazards in Australia, fire events are notable for causing the greatest number of fatalities despite incurring the lowest of insured losses. Climate change scenarios suggest the occurrence of yet more frequent and extreme bushfire and firestorm events. Exploring how insurance has been used to date and in what ways it might need to be developed in this context is the main imperative of this project.
Methods Disaster management in most developed nations employs a generic or all-hazards approach. For example, such an approach is the prevailing paradigm in the UK, USA and New Zealand (see e.g., Britton, 2002; McEntire et al., 2002; Mileti, 1999; O’Brien and Read, 2005; Quarantelli, 1997) as well as in Australia (Handmer and Dovers, 2007; Middelmann, 2007). Efficiencies are derived from integration and benefits in extending community preparedness for one type of event to cover all possible Planning,�building�and�insuring�����������215� �
disasters. Yet recent research also places value on considering specific and localised disaster ‘hotspots’ and ‘case studies’ (Arnold et al., 2005, 2006). Such work emphasises the benefits of paying attention to detail in disaster management; in accounting for the environmental, social and economic variations that influence the occurrence of disasters, and response and recovery. Focusing on a particular case – as we do here with regard to the role of insurance in bushfire mitigation in Tasmania – provides an illuminating example with rich contextual detail, while allowing more generalised observations to be made through engagement with other case studies and research. In looking at the case study of bushfires in relation to building and property insurance in Tasmania we conducted 19 in-depth, open-ended, semi-structured interviews (1 to 1½ hours in duration) with 16 participants. Participants were selected from key stakeholders in the public and private sectors – the Department of Premier and Cabinet (Tasmanian Government), Tasmanian Fire Service, Department of Housing Tasmania, Southern Tasmanian Councils Association, Glenorchy City Council, Housing Industry Association, Master Builders Association, Property Council of Australia, FM Global Insurers and RAC Insurance. Most interviews were conducted in the stakeholder’s workplace, and audio-recorded for later transcription and analysis. Two telephone interviews were also conducted. Interview transcripts were analysed in relation to the latest disaster inquiries in Australia as well as findings from overseas. Comparison of bushfire and flood management has been made by others (e.g., Buxton et al. 2011 in relation to land-use planning) and we likewise compare insurance in flood and bushfire management. Extracts from the literature as well as from our interviews with research participants are used to inform, elucidate, substantiate and support the findings and associated recommendations made in the project.
KEY FINDINGS AND RECOMMENDATIONS Having insurance is not always a priority or even an option for all Significant rates of noninsurance and underinsurance The Victoria Bushfire Royal Commission states that it is difficult to identify the level of noninsurance and underinsurance associated with the Black Saturday bushfires, but cites evidence suggesting that about 13 percent of all property losses were not insured (Teague et al., 2010, p.383). It has also been estimated that between 27 percent and 81 percent of households were underinsured with regard to the Canberra bushfires in 2003 (ASIC, 2005). Whittaker et al. (2012) found, in relation to the East Gippsland region of Victoria, that although most residents had home and contents insurance, a significant number were uninsured or underinsured, particularly with regard to assets such as farm fences, livestock and outbuildings. The reasons for noninsurance and underinsurance include the contextual prioritisation of drought mitigation as a long-term and ongoing hazard over the low probability event of bushfire, and limited financial resources associated with drought and other pressures resulting from changes in the nature of farming and rural communities. It has been observed that the decisions people make regarding bushfire risk management takes place within the complex 216����������Planning,�building�and�insuring� �
“entwined nature of social and environmental tradeoffs” (Eriksen and Gill, 2010, p.822). Even those who can afford it do not necessarily purchase adequate or any insurance coverage. “For a lot of community members it [insurance] would come up when it needed to…. I guess if we approached them now it wouldn’t be a priority for them necessarily unless something actually happened and they had to think about it at that time” (Local government officer) It is widely acknowledged that consumers struggle to engage with low-probability, highloss events (Kunreuther and Pauly, 2004). For example, in the context of the United States, rates of noninsurance with regard to floods are significantly high. Take-up rates of insurance in high risk counties under the federally backed and administrated National Flood Insurance Program (NFIP) vary from 39 to 68 percent (Michel-Kerjan and Kousky, 2010, p.8). This is despite it being mandatory for those taking out a mortgage on a residence situated on a 100-year flood plain to purchase flood insurance at least to a minimum coverage level. By means of explaining why take-up rates of disaster related insurance can be low, Kunreuther and Pauly (2004) observe that prior to a natural disaster event people underestimate the chances of such a disaster occurring and perceive that the costs associated with finding out about the hazard and potential coverage outweigh expected benefits. The Samaritan’s dilemma has also been proposed by way of explanation. In offering assistance ex post (after hardship), any incentive for people to manage risk ex ante (before hardship occurs) is reduced if not removed. However, Kunreuther and Pauly (2009) argue that this proposition is not backed by empirical evidence. In fact, they cite evidence that suggests the opposite (e.g., Burby et al., 1991, cited in Kunreuther and Pauly, 2009, pp.17-18). Yet, most related research – including by Kunreuther and Pauly – maintains that moral hazard (the increase in the probability of loss caused by policyholder behaviours that have been influenced by expectations of ex post assistance) is a significant problem for risk management (see e.g., Kunreuther and Michel-Kerjan, 2009, p.9). In addition, substantial data indicate that the purchase of insurance is unrelated to risk measurement, such as any measure of seismic risk, even if the measure is familiar to households. It is past experience of disasters that plays the central role in decisions regarding the purchase of insurance (Palm, 1995, cited in Kunreuther and Pauly, 2009, p.19; Michel-Kerjan and Kousky, 2010, p.18). After purchasing insurance there is evidence that if residents have not made a claim in the subsequent few years that they are likely to cancel policies (Kunreuther, Sanderson and Vetschera, 1985, cited in Kunreuther and Pauly, 2009, p.19). Michel-Kerjan et al. (2011) report that people who experienced small flood claims tend to maintain their coverage for longer than people who have experienced large flood claims. In short, insurance is viewed by a significant proportion of the population as an investment rather than a protection or risk reduction measure (Kunreuther and Pauly, 2009, p.20).
Planning,�building�and�insuring�����������217� �
“The Queensland floods [are] interesting… Despite everyone getting a copy of their policy sent to them in the mail each year… people think they’re insured or they’re not insured and that they’re insured for everything or they’re not insured for everything. The nuances… go past most people. There are parallels with fire.” (Tasmanian Fire Services officer) Michel-Kerjan et al. (2011) postulate a range of other factors that may contribute to the limited tenure of many household insurance policies, including non-engagement, disinterest or lack of comprehension of probability data, and an attitude of ‘it will not happen to me’. Significant ambiguity exists here with no clear picture of the factors influencing insurance purchase and policy renewal. There is scope for more work in this area, particularly in the Australian context given the government’s role as insurer of last resort and the high rates of noninsurance. In addition, there appears to be little or no work looking at the high rates of underinsurance, why people may be underinsured and how this may be addressed. Often, for example, people think that they are adequately insured when they are not. The need to address an apparent mismatch between public expectations and insurance reality aligns with observations and recommendations made in the Natural Disaster Insurance Review (The Australian Government Treasury, 2011) and the Queensland Floods Commission Report (QFCI, 2012).
RECOMMENDATIONS 1. That further research is conducted into the contexts and processes informing people’s prioritisation in the purchase and maintenance of insurance policies, including their awareness of, and interest in, what these policies do and do not cover 2. That public expectations in relation to insurance are more closely aligned with the insurance reality through clearer insurance industry communications with customers and through government-driven education initiatives
Declining insurance availability and affordability in a changing climate The affordability of insurance can also be an issue in relation to noninsurance and underinsurance. Insurers generally, in spreading losses through premium pricing beyond the regions affected by hazards, have been able to maintain a premium pool adequate for covering severe low probability events and providing ongoing affordable insurance. However, the exacerbation of risks associated with climate change is likely to increase premiums. The responses of our interview participants and findings in the international literature (both discussed below) flag likely reductions in the availability of insurance coverage and complete withdrawals of it in places. Although the international literature refers to flood and hurricanes in the USA, it is drawn on here as relevant and useful given the limited research conducted to date in Australia. Kunreuther et al. (2011) have undertaken what they describe as a “first attempt to systematically measure the implications of future climate scenarios for the pricing of 218����������Planning,�building�and�insuring� �
catastrophe risk insurance, using the case of hurricane risk in the state of Florida, under various conditions of adaptation and reinsurance availability” (2011, p.14). They conclude that without adaptation and under a worst case climate change scenario that the price of insurance would increase to the extent that it would not be affordable for many Florida residents. They recommend that reinsurance and loss reduction measures (such as the enforcement of existing building codes and retrofitting existing properties) would maintain insurance availability and affordability under such a scenario. In addition it would allow insurers to cover a much larger percentage of losses in Florida (Kunreuther et al., 2011, p.14), and reduce uncertainty regarding the price of insurance. Such insights place the focus on risk mitigation measures rather than the regulation or manipulation of risk pricing and premiums as a means of managing losses. Recent flood events in Australia have led to unaffordable insurance premiums. In our interviews, expectations of insurance coverage becoming both more costly and less readily available were reinforced in comments made by insurance sector representatives. Several participants remarked on the positive effects of having insurance that accurately reflects new risks. Despite an expectation that higher risks and hence increased insurance costs would be reflected in lower land and property prices, the market was deemed by many to be an effective means to price and allocate risk. However a housing industry representative noted that higher premiums don’t necessarily equate to people avoiding high risk areas: “If they [insurers] get some clarity around where those high risks are they’ll increase their premiums according and that may or may not influence people but at the end of the day often those more remote and high-risk areas are probably, you know, cheaper and so I’m not sure how much impact that will necessarily have unless the premiums are prohibitively expensive, or uninsurable, and people can then start to question whether or not they want to build in that area.… Having said that, ... the appetite for risk is quite large on behalf of insurers.” (Housing industry representative). One respondent, an emergency services officer, stated: “We know the market’s a pretty crude driver for this … depending on individual companies and the policy settings.” One insurance industry agent made positive reference to the US practise of property buy-back under the compulsory National Flood Insurance Program (NFIP). It was considered by some participants, however, that there might be problems in Australia with similar initiatives – governments may neither be financially willing or able to engage in buy-back or retreat programs. It was acknowledged that rates of noninsurance and underinsurance would likely rise with a reduction in insurance availability and affordability.
RECOMMENDATION 3. That research to ascertain the likely changes in the costs and availability of insurance coverage and subsequent impacts on the built environment is undertaken in light of climate change with direct reference to bushfires and other natural hazards Planning,�building�and�insuring�����������219� �
Lack of affordability for low-income earners Even if insurance remains affordable for many, low income earners will continue to be faced with prohibitive costs. It is broadly acknowledged in the hazard insurance literature that it is necessary to make provision for supporting low income earners to purchase insurance. Not only does this reduce the demands upon government postdisaster, it also reduces the possibility of disadvantage becoming further entrenched following a disaster. Research on social housing and tenants in Australia highlights that people in social housing are hardest hit by natural disasters such as cyclones, floods and bushfires (Jacobs and Williams, 2009; Williams et al., 2009; Williams and Jacobs, 2011). This is supported by research in the UK (Pitt, 2008), the USA (Tierney, 2008), and in developing nations (e.g., Bosher, 2011; Warner et al., 2010). Poor risk management awareness and capacity, especially when coupled with a lack of insurance coverage in a context of environmental, social and economic vulnerability, is perceived to impact on resilience to recover from catastrophic events. “The homes that are probably most at risk are probably at the cheaper end of the market where these people [of lower socio-economic status] are going to be buying in and they’re going to be the ones that the insurance companies are going to slug.” (Housing industry representative) While need to make provisions for low-income earners to purchase insurance is well recognised, there is a tendency in some research to assume a lack of rational decisionmaking on the part of the uninsured. For example, in the USA, it has been argued that if people feel they cannot afford insurance, they should purchase a cheaper house that they could afford to insure (Kunreuther and Pauly, 2009). It has also been stated that some people who, in theory, are least able to afford insurance still do purchase it, insinuating that those other non-insured people are simply making irrational budgetary choices (Kunreuther and Michel-Kerjan, 2009). Such arguments and statements fail to take account of the complex factors that influence perceived and actual affordability and purchase (or not) of insurance. They can therefore fail to provide insightful and targeted suggestions for engaging with noninsurance and underinsurance associated with low-income. The issue of affordability is addressed in part by the Victoria Bushfires Royal Commission’s recommendation that the existing fire services levy is replaced by a property based levy. This proposed policy change is predicted to result in a substantial reduction in consumer insurance costs. For example, the cost of insurance would drop by 24% for a rural residence and 17% for an urban residence (Teague et al., 2010). The proposal is significant in levying the costs from property owners rather than the public in general, as it is property owners who directly benefit from the provision of such services and who are perhaps most able to undertake (or be held responsible for) related risk mitigation activities.
RECOMMENDATION 4. That mechanisms for providing affordable insurance to low-income earners are further investigated 220����������Planning,�building�and�insuring� �
Insurance has little role at present in encouraging climate change adaptation measures, including risk mitigation The role for insurance in adaptation and mitigation is currently understood in terms of recovery not prepredness Insurance is most commonly understood to be a recovery rather than a preparedness measure; it is understood as a backup after risk mitigation has been undertaken and following a natural disaster. As a risk manager from local government states: “If you put it down to its most base form… you put every other thing in place to make sure that you lower the consequences of something happening or you lower the chances of something happening… but your bottom-line is always insurance… you need to have that insurance as a backing.” Such an understanding of insurance is affirmed by the Victoria Bushfire Royal Commission (Teague et al., 2009, 2010), the National Disaster Insurance Review (The Australian Government Treasury, 2011) and the Queensland Floods Commission Report (QFCI, 2012). All approach insurance in terms of recovery, not in relation to preparedness. In this project, many stakeholders (mostly in the private sector and ranging from insurers through to property developers) intimated or stated that insurance has a role in risk management that is secondary to planning and building code requirements. “If we’ve got our planning right, we’ve got our building standards codes right, doing strategic thinking and policies … and you’ve got properties [affected] …then … the insurance company will come in at that stage.” (Public housing officer) In interview, participants frequently referred to other mechanisms (notably building regulations and planning systems) as being most significant for climate change adaptation, and underpinning any possible roles that already are or yet might be played by insurance. Representatives of the housing construction and property development sectors were adamant that the combination of a more streamlined planning processes and requirements to meet building regulations afforded insurance a minor, secondary role. Strategic and land-use planning were highlighted as critically important but underutilised here. “Industry preference is that you bypass the land-use planning approval process and just incorporate the bushfire [risk] at the building stage… The planning fraternity are going to have to … deal with subdivisions, new lots and those sorts of things and deal with those risks at that stage rather than transferring the risk to the home owner. … If you’re going to approve a house lot you should’ve taken into account before you approve that house lot all the sorts of the risks that are associated with it… We would prefer to see those risks taken into account at the subdivision stage … [with] decisions taken earlier in strategic planning” (Housing construction representative). In the public housing sector, property insurance is referred back to a state-based risk management fund. State housing officers likewise considered that the provision of risk management through planning schemes and building regulations pre-empts any Planning,�building�and�insuring�����������221� �
significant role for insurance in hazard mitigation and climate change adaptation. Conversely, one emergency services officer mentioned how different treatments to improve the built environment’s capacity to resist fire had been driven in large part by research funded through the insurance sector. Notably, emergency services personnel expressed the belief that an emphasis on the purchase of insurance contributes to the reduced participation of individuals and communities in risk mitigation activities for preventing hazards such as flood and bushfire. The role of insurance needs to be better developed if it is to drive preparedness as well as facilitate recovery from natural disasters. In this sense, insurance currently has limited value as a tool for the promoting climate change adaptation and risk mitigation.
RECOMMENDATIONS 5. That insurance is recognised and explored as a mechanism for promoting disaster preparedness as well as recovery with regard to climate change adaptation 6. That insurance is recognised as acting in concert with other mechanisms such as building codes and land use planning regulation
Limited interest in using insurance for climate change adaptation, including risk mitigation As highlighted by researchers such as Kunreuther et al. (2011), cost-effective adaptation measures have been shown to play a significant role in reducing catastrophe losses. For example, it has been calculated that losses from a hurricane with a 500-year return period in Florida would be reduced by more than 50 percent if all residential structures met the requirements defined by the Institute for Business and Home Safety (Kunreuther et al., 2011, p.312). “As far as pro-active stuff about the insurers coming to us and saying, ‘well you know, what are you going to do about mitigating your fire risk?’, before we get into a relationship with them as they’re providing insurance – no, that doesn’t happen. It doesn’t happen.” (Risk manager, local government) Despite evidence of the significant reduction in losses through the adoption of mitigation, the insurance industry appears reluctant to encourage the adoption of risk mitigation measures (Kunreuther and Michel-Kerjan, 2009, pp.22-23). The reasons postulated for this reluctance in the USA context, include: x
x
Premiums are often artificially low due to state regulation and hence insurers are reluctant to offer premium-related discounts to households in high risk areas that undertake mitigation because there is no economic incentive to do so; The costs incurred by households for adopting mitigation measures are often perceived as significant and as not offset by small premium discounts;
222����������Planning,�building�and�insuring� �
x
Insurers would need to assess mitigation measures and their effectiveness and the costs of this may negate any financial benefits associated with a reduction in losses (Kunreuther and Michel-Kerjan, 2009).
Although Australia has no state-run insurance as there is in parts of the USA, much of the experience there regarding insurer reluctance to encourage risk mitigation measures is reflected here in Australia. In fact, the industry’s international context was mentioned to us by several participants. One representative of the state’s housing construction industry commented that the insurance sector is driven by global players and interests, and that a few major reinsurers located elsewhere (such as AON, Munich RE and Swiss RE) set the terms and conditions for insurance. Participants in this project commented that there seemed to be little interest or capacity for insurers to devote attention to local matters. “With insurance … the drivers appear to be so global it’s irrelevant… The reinsurers pull the strings.” (Building industry representative) Insurers are seen by some respondents as external to the issues of climate change and risk mitigation: “What is the function of insurance? The insurance is to provide relief from large-scale losses; it doesn’t prevent them. Insurance is doing its work when it’s profitable - not when there aren’t losses” (Tasmanian Fire Service officer). Research participants from most sectors commented that insurance would not be an effective tool for implementing adaptation because it requires compliance which is difficult and costly to police. Several interviewees referred to how the purchase of deadlocks can entitle property-owners to a premium discount even though the deadlocks might never be fitted or used. Alternatively, there are penalties for noncompliance (particularly in commercial world) but residential properties rely more on a voluntary approach (e.g. to compliance with separation distances between a house and bushfire fuel). While it may be possible to mandate residents through certification, there is a sense that insurance fails to deliver any adaptation through either soft behavioural or hard structural changes due to the impossibility of pursuing enforcement. If it is to fall to residents to undertake adaptation and mitigation measures it should be noted that there is a raft of evidence that also demonstrates reticence or disinterest in risk mitigation on the behalf of people facing possible bushfire events. In the Australian context, Eriksen and Gill (2010) and Whittaker et al. (2012) identify competing priorities such as dealing with the issues associated with prolonged drought as one reason why rural residents don’t necessarily undertake bushfire mitigation. Other reasons included a lack of knowledge and experience of bushfires by newer rural residents, the cultural identification of bushfires as a male realm within which women feel disempowered to act, and lifestyle expectations about what it means to live in or near the bush (Eriksen and Gill, 2010). “Market-based solutions basically don’t really operate in the natural hazards space. People buy insurance rather than solutions … so insurance becomes a way of
Planning,�building�and�insuring�����������223� �
participating in mitigation without actually doing much. … natural hazards are somebody else’s job.” (Tasmanian Fire Services officer) In addition, Kunreuther and Michel-Kerjan (2009) cite a number of studies conducted in the US in the 1970s and 80s that found that only between 5 and 12 percent of respondents reported adopting measures in light of specified disasters in high risk areas. Even after the hurricane seasons that included Hurricane Katrina, Goodnough (2006) reported the results of a poll in which 83 percent of respondents stated that they had undertaken no subsequent steps to fortify their homes, 68 percent stated that they had no hurricane survival kit and 60 percent no family disaster plan. Kunreuther and Michel-Kerjan (2009, pp.21-22) have explained why property owners do not invest in mitigation measures despite the availability of information on the risks: x
x
x
x
While experts focus on likelihood and consequences with regard to risk, individuals “rarely seek out probability estimates in making their decisions” (Kunreuther and Michel-Kerjan, 2009, p.22). Even if this information is available or presented, it is commonly not factored into decision making; Individuals frequently do not understand what, for example, a 1 in 100,000 probability actually means, and require a context for comprehension of the likelihood of an event occurring and what it may mean for them; Evidence also suggests that individuals will ignore risk, taking an optimistic view when presented with the odds of a catastrophic event i.e. ‘it won’t happen to me’; Individuals’ accounting for risk and probability dissipates if the event looks like it will occur in the future, rather than more immediately, and as such they are more likely to invest in the here-and-now than in events that are perceived to be at some unspecified time (Kunreuther and Michel-Kerjan, 2009, pp.21-22).
As part of this project, a public housing officer identified capacity issues in relation to undertaking risk mitigation activities. Both personal financial constraints and the physical inability on behalf of residents to retrofit their home were identified as the key limiting factors. Jaffee et al. (2010) argue that reticence on the behalf of homeowners to undertake risk reduction measures (as well as other issues such as volatility in insurer earnings and uncertainty on the behalf of homeowners, and the prevalence of non-insurance or underinsurance) can be addressed through long-term property insurance as an alternative to annual policy renewal. These long-term insurance policies would be attached to specific property and would be renewed every five, ten or twenty years. Prices could be either fixed or variable. Jaffee et al. (2010) and Kunreuther and Michel-Kerjan (2009) also suggest that longterm insurance policies could be linked to home improvement loans for risk reduction measures that act to reduce premiums. As a result, households would have better coverage, and damage and loss may also be reduced significantly – benefiting insurers, households and the state.
224����������Planning,�building�and�insuring� �
Ou Yang (2010) supports the case for long-term insurance contracts, but cautions that annual premiums and the risk capital required may rise significantly as insurers incorporate additional premium risk. It is important to note that Jaffee et al. (2010) raise a number of questions with regard to the development of a market for long-term property insurance that require further explication. RECOMMENDATIONS 7. That a review is undertaken into the factors that impact on insurer activity in encouraging and incentivising climate change adaptation and associated risk mitigation measures 8. That further research is conducted into the public’s prioritisation of climate change adaptation and risk mitigation measures and the influence of this on possible roles afforded insurance 9. That government in collaboration with insurers investigate the viability of climate change adaptation initiatives such as the development of long-term insurance contracts
Evidence of emerging insurer engagement with climate change adaptation As already noted, the insurance industry is now responding to climate change, and it sees both opportunities and limitations. In our interviews we encountered some evidence of emerging insurer engagement with climate change adaptation. Notably one climate change adaptation project manager reported that, whilst insurers may not be proactive in relation to incentivising climate change adaptation and associated risk mitigation, some are accounting for climate change adaptation measures in audits of local government risk and doing so in ways that influence premium pricing: “As far as I am aware, all councils in our region use [a named insurance company] for their public liability and professional indemnity insurance. [This company] conduct biannual audits on its members which include organisational risk management. As part of that they assess the comprehensiveness of risk assessment and risk management that councils undertake. One risk area that is examined as part of the audit is climate change. My understanding is that [this company] uses the audit as a means to determine its level of risk in insuring each council and therefore there is an impact on the council's premium. Hence, if council does good risk management in the area of climate change there may be an impact on its premiums but that is only one of a number of 'risk areas' and factors that [this company] use in its calculations (a direct link is probably difficult to quantify but there is a definite benefit). The impression I get from our councils is that climate change is a relatively new area of risk that is examined in the [insurance company] audits and those that have been audited over the course of the [Regional Climate Change Adaptation Project] have been pleasantly surprised since they have, as a result of the project, scored well for climate change” (Climate change adaptation project manager, local government).
Planning,�building�and�insuring�����������225� �
RECOMMENDATION 10. That a review is conducted to examine how climate change adaptation and associated risk mitigation measures might be included in the determination of insurance coverage and premiums, and that opportunities and limitations, as well as instances of innovation are identified.
The capacity of insurance to have a role in climate change adaptation and associated risk mitigation is constrained by limitations in governance Tensions between the role of the community and the role of the individual in relation to insurance and risk Climate change adaptation is broadly acknowledged as requiring a community focus. As one participant stated: “Something like bushfire management requires everyone to participate... You need all members of the community in a vulnerable area to be doing their bit, otherwise the whole thing falls over” (Climate change adaptation project manager, local government). However, the role of insurance is usually framed around the individual and his or her sense of responsibility and choice: “There is always going to be that community expectation; I want to go and live by the beach or I want to go and live in the hills and the one thing that is going to drive those decision-making processes is going to be ‘can I get insurance for that?’ Because that is the biggest signal to a person that there is a risk here and then that might change their behaviour around whether or not they can accommodate that risk” (Climate change adaptation project manager, local government). The mixed messages here have implications for the provision of leadership, and what governance arrangements might be adopted in relation to the role of insurance in climate change adaptation. Examples of community-based insurance initiatives include the NFIP in the United States. This program started as a voluntary partnership between government and communities in which local governments implemented flood management regulations and property owners in participating communities thus became eligible for federal flood insurance (Michel-Kerjan and Kousky, 2010: 4).
RECOMMENDATION 11. That research is undertaken to assess how insurance operates at the individual, household, business and community levels to determine which one or combination of them offers the most opportunity for use in climate change adaptation.
226����������Planning,�building�and�insuring� �
Tensions between government and individual responsibility for risk In this project, one senior bureaucrat discussed the principles embedded in draft policy on the role of state government in relation to risk, and these principles clearly demonstrate tension between government and individual responsibilities for risk, including a shift towards an emphasis on the roles and responsibilities of the individual: 1. Private risks associated with natural hazards are the responsibility of individuals and businesses 2. Government should encourage public and private risks to be factored into investment decisions 3. Government, because of the position it is in, can support individuals and others to understand and mange their private risks through education, the provision of evidence and frameworks to facilitate collective action where individuals can’t reasonably act upon their own 4. Government should ensure that private investment minimizes unacceptable public risk 5. Government as a responsible corporate citizen should avoid investment regulation and policies that give rise to public and private risk (Senior emergency management officer, State Government) In addition, representatives of the housing construction and property development sectors, in particular, emphasised the suitability and effectiveness of the market as a mechanism for managing risk, and they emphasised consumer sovereignty for individuals and households. In discussions about regulation (and, in some cases, about a stated sense of over-regulation), interviewees reiterated how any decision to purchase insurance is a private matter of choice for individuals, households and businesses. “Insurance companies are probably the perfect model for private enterprise…” (Housing industry representative) McLennan and Handmer (2012) observe a broad shift in disaster related policy away from government responsibility for risk management and towards the individualization and privatization of risk. However, they observe that the Royal Commission into Victoria’s Black Saturday bushfires takes risk management in the near opposite direction: “The Royal Commission called for a shift towards greater government leadership and responsibility in Australian bushfire risk management. Underpinning this call was the view that government agencies have far greater capacity to identify bushfire risk and to manage important aspects of that risk under extreme and variable conditions” (McLennan and Handmer, 2012, p.13). The dynamics between government and the insurance industry in Australia exemplify a shift in governance arrangements which appears aligned with those of the Victoria Bushfire Royal Commission. Following eight official natural disasters in 2011 that included cyclones, floods and bushfires resulting in $5 billion losses and approximately 275,000 claims, relations between government and insurers have become openly strained (ABC, 2012). There has been a move by government to consider more stringent regulation for the insurance industry, particularly in light of public frustration regarding the number of unpaid and unresolved insurance claims. For example, the Planning,�building�and�insuring�����������227� �
National Disaster Insurance Review made recommendations stating, amongst other things: x x
x
Recommendation 1: That all home building insurance policies include flood cover; … Recommendation 13: That all insurers offering small business insurance be obliged to include flood cover on an opt-out basis, instead of an opt in/opt-out basis as at present, in all of their small business package policies; … Recommendation 32: That all home building insurance policies providing sum insured cover be modified by the end of 2014 so as to include replacement value cover in the event of total loss of the home … (The Australian Government Treasury, 2011, p.9, p.11, p.15)
The Queensland Floods Commission also made recommendations directly targeted at the operations of the insurance industry, including that: x
x
Insurers should review their existing system and processes and implement any improvements necessary to ensure that accurate and complete records of conversations with policy-holders are made; The Insurance Council of Australia should amend clause 3.4.3 of the General Insurance Code of Practice so that it requires insurers to inform policy-holders of their right to request a review of an insurer’s decision to refuse to provide access to information on which it relied in assessing claims (QFCI, 2012, p. 304, p.324).
x Participants representing the housing construction and property development sectors stressed a sense of over-regulation. Suggestions that insurance might be a useful addition to the usual approaches of land-use planning and building control in risk management were rejected by this sector. That insurance was seen as an option that is best left for individual consumers to purchase suggests a need as well as opportunity for government lead innovation in this area. Opportunities exist for public-private interactions regarding insurance other than those of a regulatory nature. There are a number of overseas initiatives that involve collaboration between government and the insurance sector in relation to disasters (see boxed examples following). They tend to focus on the role of insurance in recovery rather than preparedness. However, but they do illustrate that a range of opportunities – both regulatory and non-regulatory exist.
228����������Planning,�building�and�insuring� �
In developing regions and nations a range of innovative insurance partnerships between the public and private sectors are being explored and implemented (see e.g. Warner et al., 2009; Warner et al., 2010). For example, the Caribbean Catastrophe Risk Insurance Facility (CCRIF) has brought together Caribbean nations in partnership with the World Bank to create a notfor-profit insurance vehicle (Warner et al., 2010). A Board of Directors that includes representative from participates nations and technical experts, oversees governance and strategic decisions, while the operational and risk management functions are carried out be a private risk company. This includes modelling, calculation of parametric loss, and policy sales and premium collections. Reinsurance and Alternative Risk Transfer is placed in international markets via a Placement Broker. Key features of the CCRIF include: x
x
x
To trigger an insurance payout, CCRIF uses a catastrophe model to estimate the loss for any actual events, with the same model, calibrated against real historical events and losses, used to evaluate the risk and price the insurance contract; By pooling the risks of its members, CCRIF serves as a risk aggregator and can thus provide insurance coverage at a comparatively low premium; CCRIF member countries can decide on the level of coverage for each peril insured (Warner et al., 2010, p.20).
In the United States, Kunreuther et al. (2011) describe the intersection of public and private insurance in Florida, in the aftermath of the 2004 and 2005 hurricane seasons – which included Hurricane Katrina. In the aftermath insurers filed for an increase in insurance rates only a portion of which were approved by the state insurance regulator, adding to existing public-private tensions where the focus of the former is on insurance affordability and the latter on the market and insurer sustainability. In response, large insurers reduced the amount of coverage that they provided in high hurricane risk regions. At the same time, Citizens Property Insurance Corporation – a state-run insurance company – was permitted to charge lower, subsidized rates than its private competitors and consequently became the largest homeowner insurer in Florida. In addition, it is legislated that any deficit faced by Citizen in the aftermath of another major hurricane can be recouped from its private competitors in Florida. The private insurers will then have to levy this amount against their own policy holders. Kunreuther et al. (2011, p.15) sound a note of caution regarding the sustainability of such an approach, as they argue that Citizens’ premium pool is invariably not going to be able to meet catastrophic losses, and this private-public insurance hybrid thus has significant ramifications for the broader insurance sector.
Examples of role of government in insurance with regard to risk management
Historically intervention and regulation of the insurance industry in Australia regarding natural disasters has been less rigorous than in the USA. In some cases, insurers there have been restricted by legislation from cancelling policies as a means of ensuring that coverage continued. For example, in Florida following Hurricane Andrew in August 1992, legislation prohibited insurers from cancelling more than 10% of homeowner policies in any one county in one year and from cancelling more than 5% of property owner policies state wide for the next three years (Insurance Services Office, 1994, cited in Lecomte and Gahagan, 1998, p.111). In Australia, much of the public-private interaction has focused on dialogue between sectors regarding issues such as building standards, planning codes, government
Planning,�building�and�insuring�����������229� �
assistance in times of disaster and taxation reform (Wilkins, 2010). Given recent events and emerging trends this focus on dialogue may not remain the status quo. Regulation of the insurance industry and its setting of premiums may negatively affect market competitiveness and market-share. However, its effectiveness relies upon good governance, institutional capacity (on the parts of the insurers and government) and adequate legal and enforcement structures (not to mention political will). RECOMMENDATION 12. That government interventions into the insurance industry and insurance markets are considered and undertaken where appropriate in ways that reconcile the existing tensions between government and individual responsibility for risk. 13. That non-regulatory and regulatory approaches to the use of insurance in climate change adaptation and associated risk management are investigated with respect to collaboration between the public and private sectors. Inconsistencies in governance between agencies and between levels of government, and an associated lack of leadership Inconsistencies and mixed messages were also reported by participants as emanating from different levels of government and again reflected an apparent lack of leadership. For example, a state housing officer reported: “The insurance part of it can come in and work if you’ve got a regime of control that’s set up that allows and supports it, but if you don’t, I don’t think that you can direct it [adaptation] from the perspective of insurance, necessarily, on its own. To put a fire trail through that same area of land required a planning application to go the council to put in a fire trail. Even though the Tasmanian Fire Service was saying clearly that it’s a fire-prone area and it’s a risk, you weren’t in a position as an owner to be able to go in and put a fire trail in without getting permission from the council to do that because it necessitated cutting down some vegetation. If you were to link insurance requirements in to something like that where you’ve got this odd situation where regulatory bodies are not consistent… I don’t think it would work.” Problems with consistency and integration between the public and private sectors and amongst their various agencies and organisations were noted. In the wake of bushfires elsewhere, local councils were a target for criticism: “In the Victorian case … it’s quite clear that the implementation [of wildfire overlays] was hampered by the lack of uniformity in approach [across LGAs]” (Tasmanian Fire Service officer). While local government has taken a lead role to date in local planning and development, there is a sense that this trend will change. Several interviewees saw change as necessary as climate change requires a broader approach in governance. “What we’re probably going to see is more state government leadership on a lot of these issues and more state government control. Our friends in the local councils might not like this but to be perfectly honest, I don’t think they’ve demonstrated great leadership in this area already and if you look at the way urban development’s occurred, it’s been on a municipal basis rather than a regional basis. The needs of the community have been over-ridden somewhat by the needs of individual municipalities...” (Building industry representative). 230����������Planning,�building�and�insuring� �
“There needs to be consistency right at the very high level stuff. If we’re talking about requirements for building, planning or zoning or whatever that needs to be nation-wide. Not just locally. There needs to be high level stuff decided on” (Risk manager, local Government) Senior staff from local government agencies also expressed a desire for leadership from above and at both the state and federal levels. “We don’t have, and haven’t had, very strong leadership from the Australian Government or the State Government in terms of climate change. Councils are in a position where they have planning schemes that they have to implement, but those schemes are built on pre-existing data not on future data… I don’t think we can look at local government in isolation in terms of holding all that risk. We also need to be able to look and say councils are doing what they can with resources that they have available. Councils are reasonably well covered [for liability] at the moment, but there is a very big need for more leadership and policy setting from the State Government in assisting councils in being able to adequately respond to climate change” (Climate change adaptation project manager, local government). “It’s about time that the state took a leadership role.” (Building industry representative) A critical issue raised by a number of participants with regard to leadership, was the need for accurate, consistent and readily available information, including risk maps. “What we haven’t done in Tasmania is gained yet a handle on what these risks are and where they lie. We have maybe at a lower, superficial level, at a municipal level in some cases; we haven’t at a state level… That’s why, with this planning reform … we’ll be able to look at a GIS map at a state level … start to plan and … not build in bushfire prone areas, not build in landslip areas, not build in flood-prone areas, and all of a sudden those risks are mitigated … I think it’s a case of getting it right, doing the planning first, and avoiding the traps of building in those areas. Then, once you’ve done that…” (Building industry representative). The need for better information and mapping is particularly important if insurance is to be advanced as a mechanism in climate change adaptation and risk mitigation. Understanding the nature of risk in one area, for example, will allow insurance-related mechanisms to be targeted and locally relevant. RECOMMENDATION 14. That more effective linkages are fostered between the various, relevant agencies and organisations across public and private sectors, including those in the insurance and reinsurance industries. 15. That greater leadership on climate change issues, including in relation to how insurance might operate as a key mechanism of adaptation, is demonstrated by government at both state and federal levels. 16. That a comprehensive program is undertaken at multiple scales across states and territories to update data sets and produce and make widely available risk maps and related information that render different hazards more meaningful to a range of stakeholders in the context of climate change adaptation. Planning,�building�and�insuring�����������231� �
Conclusion It is clear that insurance is currently playing a substantial, though partially understood role in disaster recovery. However, its role in preparedness remains poorly understood, under-developed and hence, under-utilised. It is apparent that insurance could be playing a more significant role in this regard. A word of caution is required, however, when turning to insurance as a mechanism for climate change adaptation regarding risk mitigation. There are limitations to what insurance can achieve. Insurance, on its own, for example, is no solution to climate change and no panacea for some of the dire effects of climate change. It will only be effective if it is linked in with international, national, regional and community initiatives to reduce greenhouse gas emissions, explore and implement multi-layered adaptation strategies and foster ongoing awareness and knowledge of both climate change and associated risks. In such a context, insurance can be an effective part of a wider response to risk mitigation under a climate change scenario. It can be used to maximise incentives for disaster risk reduction (Warner et al., 2009, p.13), and can be a creative and adaptive mechanism in reducing and spreading losses – economic, social and environmental losses. In this project we have identified three key themes concerning the role of insurance in climate change adaptation and risk mitigation: insurance is not a priority or option for all; insurance is currently playing a limited role in adaptation and mitigation; and the capacity of insurance is constrained by limitations in governance. Each of these areas requires further explication if insurance is to play a meaningful and decisive role. Due to the fledging nature of knowledge regarding this role, particularly within an Australian context, a majority of recommendations that we make relate to the need for further research. Most of the work to date – and as cited in this report – comes from the US and focuses on flooding and not other hazards such as bushfires. As such, we emphasise that to progress insurance as a mechanism federal leadership is required both in terms of initiating further research and in forging collaboration in this research with the community, across tiers of government, between agencies, and with the insurance sector. Interagency, intergovernmental and public/private sector collaboration is required to more fully comprehend the usefulness and versatility of insurance as a mechanism in climate change adaptation and risk mitigation. There is room for significant innovation here.
i.
Summary of Findings and Recommendations:
KEY FINDING Having insurance is not always a priority or even an option for all. SUBFINDINGS Significant rates of non-insurance and underinsurance Declining insurance availability and affordability in a changing climate 232����������Planning,�building�and�insuring� �
Lack of affordability for low-income earners RECOMMENDATIONS 1. That further research is conducted into the contexts and processes informing people’s prioritisation in the purchase and maintenance of insurance policies, including their awareness of, and interest in what these policies do and do not cover. 2. That public expectations in relation to insurance are more closely aligned with the insurance reality through clearer insurance industry communications with customers and through government-driven education initiatives. 3. That research to ascertain the likely changes in the costs and availabilities of insurance coverage and subsequent impacts on the built environment is undertaken in light of climate change with direct reference to bushfires and other natural hazards. 4. That mechanisms for providing affordable insurance to low-income earners are further investigated. KEY FINDING Insurance has little role at present in encouraging climate change adaptation measures, including risk mitigation SUBFINDINGS The role for insurance in adaptation and mitigation is currently understood in terms of recovery not preparedness Limited interest in using insurance for climate change adaptation, including risk mitigation Evidence of emerging insurer engagement with climate change adaptation RECOMMENDATIONS 5. That insurance is recognised and explored as a measure for promoting disaster preparedness as well as recovery with regard to climate change adaptation. 6. That insurance is recognised as acting in concert with other mechanisms such as building codes and land use planning regulation. 7. That a review is undertaken into the factors that impact on insurer activity in encouraging and incentivising climate change adaptation and associated risk mitigation measures. 8. That further research is conducted into the public’s prioritisation of climate change adaptation and risk mitigation measures and the influence of this on possible roles afforded insurance. 9. That government in collaboration with insurers investigate the viability of climate change adaptation initiatives such as the development of long-term insurance contracts. Planning,�building�and�insuring�����������233� �
10. That a review is conducted to examine how climate change adaptation and associated risk mitigation measures might be included in the determination of insurance coverage and premiums, and that opportunities and limitations, as well as instances of innovation are identified. KEY FINDING The capacity of insurance to have a key role in climate change adaptation and associated risk mitigation is constrained by limitations in governance SUBFINDINGS Tensions between the role of the community and the role of the individual in relation to insurance and risk mitigation. Tensions between government and individual responsibility for risk. Inconsistencies in governance amongst agencies, between levels of government, and an associated lack of leadership. RECOMMENDATIONS 11. That research is undertaken to assess how insurance operates at the individual, household, business and community levels to determine which one or combination of them offers the most opportunity for use in climate change adaptation. 12. That government interventions into the insurance industry and insurance markets are considered and undertaken where appropriate in ways that reconcile the existing tensions between government and individual responsibility for risk. 13. That non-regulatory and regulatory approaches to the use of insurance in climate change adaptation and associated risk management are investigated with respect to collaboration between the public and private sectors. 14. That more effective linkages are fostered between the various, relevant agencies and organisations across public and private sectors, including those in the insurance and reinsurance industries. 15. That greater leadership on climate change issues, including in relation to how insurance might operate as a key mechanism of adaptation, is demonstrated by government at both state and federal levels. 16. That a comprehensive program is undertaken at multiple scales across states and territories to update data sets and produce and make widely available risk maps and related information that render different hazards more meaningful to a range of stakeholders in the context of climate change adaptation.
234����������Planning,�building�and�insuring� �
8. INTEGRATION AND DISCUSSION 8.1 Discussion Planning, building and insuring are co-dependent elements of the built environment. From the householder or resident point of view they generally occur in the order in which we have referred to these processes in this report, but each is an entirely separate activity. Each of planning, building and insuring is an activity of a separate profession. These professions are bound by their own bodies of knowledge, qualifications, expertise, purpose and practice. There is relatively little transfer of expert personnel between these professions, such that there is some degree of isolation of each process from the others. The separateness of these sectors is given substance by the professional bodies that oversee and define each profession. This separation is exacerbated by the guidelines, codes and legislation within which each of the planning, building and insuring sectors operate. It then extends further into governance where different government departments, statutory bodies and boards have responsibilities for those guidelines, codes and legislation. Adaptation of the built environment to natural hazards that are exacerbated by climate change is not a single or even a concerted process. It must take place at multiple levels, from Federal government, through state governments to local government councils, and companies, organisations and households. This vertical segregation of adaptation then occurs within the sectors of the built environment; planning, building and insurance are three of the major sectors, but there are others such as transport, energy, and service providers. The diagram in Figure 8.1.1 (below) illustrates the diversity of these levels of governance and the built environment. The built environment is in fact much more complex than just the sectors that have been indicated in this model, but the point of the model is to show how this research has focussed on some sectors, each of which is connected with others that we have not been able to address in the project, simply because of the sheer size and complexity of our settlements. The adaptation model is further complicated by a range of natural hazards that are both seasonal and subject to trends and fluctuations, including those of climate change. People have accepted decadal fluctuations of El Nino/La Nina and there is generally a broad acceptance of the existence of climate change (Reser et al 2011). Some of these hazards can occur simultaneously such as cyclones and floods, and one type of hazard may contribute to the vulnerability of another; for example floods enable the subsequent build-up of fuel material that contributes to bushfires in another season. Natural hazards that impact upon the built environment, especially large and complex cities, frequently generate secondary hazards in areas of public health, pollution, transport and chemical hazards, for example.
Planning,�building�and�insuring�����������235� �
Figure 8.1.1: Sectors of the Built Environment and Levels of Governance
Planning, building and insuring are co-dependent elements of a built environment that is a great deal larger and more complex than each of these sectors alone. This research is necessarily about the top down approach from government and institutions, but as this diagram illustrates there are multiple levels of governance. Our emphasis has been very much at the middle levels of state and local government responsibility, within which there are many departments and sometimes conflicting policies and agendas. Having made that qualification, this research project focused on what are clearly core sectors of the built environment, and those which are capable of providing the most direct leadership and response to a changing hazard environment. Hazard mitigation actions are worthwhile and necessary processes, except if they lead to what is termed "the safe development paradox" (Burby 2006) - where the achievement of greater safety in one area may be counter-productive or ineffective in another. Each sector may adapt in isolation to this changing environment, but changes made in one part of the built environment will impact upon all other sectors. In some cases this leads to maladaptation (for example, the negative impact of levees at Cairns Airport on flood levels at Machans Beach: see Machans Beach case study, Appendix (pp.269-298). The disaster events of 2011 brought climate change firmly into public awareness. The media linked the floods and cyclones to climate change, and members of the public talked of the events as consequences of climate change. The Bureau of Meteorology on the other hand categorised 2011 within the range of extremes of a La Niña year and compared 2011 to 1974. Both of these viewpoints seem to us to be relevant. Clearly the climate is changing, as reported through the Intergovernmental Panel on Climate Change (IPCC 2012). At the same time the range of extremes in the Australian climate is greater than the average of the projected rate of climate change. It is likely that climate change induced hazards may not necessarily exceed the range of extreme events that have been observed over the last 50 years, until the middle of this century. 236����������Planning,�building�and�insuring� �
The extreme events of 2011 are an analogue for climate change scenarios, but they are clearly immediate as well. Adaptation of the built environment will be in response to extreme events that have already happened, and will occur again in the near future. Adaptation of the built environment is also a part of the larger response to medium term climate change. This is a key research finding. The policy and legislative response to extreme events is the same as that needed to adapt to climate change. In terms of adaptation of the built environment, the research results reported in this monograph show progress is uneven in each of the planning, building and insuring sectors. Hazard building codes have been in place for several decades and are shown to be effective. (Other engineering protective mitigators of natural hazards, such as levees, seawalls, drainage easements and dams have also existed for several decades, but some of these have been shown during the process of this research to be problems in themselves). Planners have reached a crisis in land-use zoning practice which is necessitating a re-evaluation that must encompass planning for natural hazards. Insurers have made limited progress towards adaptive change by raising premiums, despite their acknowledgement of the reality of climate change and adjustment of risk probability. Building codes were developed in Australia during the 1970s to make houses more resilient to severe cyclones. This change followed cyclone Althea in Townsville in 1971 and the extensive destruction of Cyclone Tracy in Darwin in 1974. The Cyclone Testing Station played a pivotal role in research and the development of building codes and standards since that period. A classification of the nation's cyclone vulnerability defined where those codes would be applied. Flood events of the same period also encouraged the construction of dams and levees. In particular, it was the construction of Wivenhoe Dam following the Brisbane flood of 1974 that generated the safe development paradox that contributed to extensive floodplain developments in that city. It is not an overstatement to say that the construction of Wivenhoe dam contributed to the crisis in land-use planning that occupies some of this report and that the kind of flood event that occurred in 2011 will be repeated. The priority in planning is to ensure a long term solution to predictable severe flood events. Before 1980 engineering solutions, hazard knowledge and warnings dominated approaches to natural hazards. The primary role of emergency managers was dominated by response. Relatively little attention was paid to community awareness, preparedness and the process of recovery after an event. Emergency managers were recruited particularly from the defence and police forces and saw disaster response as the main part of their job. The gradual change towards greater emphasis on community engagement, education and awareness, and community recovery assistance, made emergency managers much more dependent upon the actions and decisions of other professions. The United Nations International Decade for Natural Disaster Reduction throughout the 1990s advanced that shift towards the hazard impact mitigation roles of emergency management. In a sense this culminated in the COAG review of natural hazard mitigation in 2002. It was this first review that put responsibility for hazard mitigation onto all sectors, government departments, institutions and communities.
Planning,�building�and�insuring�����������237� �
Planning Land-use planners were particularly targeted as being responsible for public safety. Planning legislation had already shifted towards much greater flexibility in Queensland with the introduction of the Integrated Planning Act in 1997 and in other states with similar processes. However neither the Integrated Planning Act nor its successor, the Sustainable Planning Act (2009) made direct reference to the need to mitigate the impact of natural hazards. Instead, hazard mitigation was addressed through a State Planning Policy in 2003. The weakness of this planning policy and the lack of reference to hazard mitigation in planning legislation have been illustrated extensively in this monograph. The disasters of 2011 will undoubtedly see a shift to the planning sector towards much greater levels of responsibility for hazard mitigation through land-use planning and hazard zoning. Throughout the last two decades, emergency managers nationwide have drawn attention to the lack of a planning sector response to hazard mitigation. Planners have retorted that they are constrained by weak legislation. However they have also been constrained by a dearth of adequate mapping. While the Flood Commission of Inquiry Report calls for comprehensive flood mapping, the process of natural hazards mapping has in fact been under way for all of the last decade. There is considerable irony in a detailed and comprehensive hazard mapping process being so recent, as nearly all of the settlements and population of Australia are in vulnerable, or hazard-prone locations already. Land use planners are engaged in planning for new developments, so that at least the latter may be sited more appropriately. This still leaves the mass of the population in places where hazards were not considered at the beginning of European settlement. Many criticisms directed at planners reflect these past decisions. Planning responses that are made now will shape communities of the future but cannot do much for those that are already in place. As with building codes, new legislation will not be retrospective. Most cyclone damage occurred to structures built before the building codes were imposed. We can see the positive impact of that decision now, but older structures, and existing settlements, must still grapple with the imperative to protect, retrofit, accommodate, or in the worst case, retreat from hazardous locations. The beachside case studies reported in this monograph (Part 6, and Appendix D) examined the history of settlement in vulnerable locations, including those in beach suburbs of North Queensland which experienced severe storm surge in 2011. Communities grew up on cheap land in beautiful places, for recreational or retirement purposes. They were casual and unplanned, established at a time when North Queensland was still very much a pioneer place. People had awareness of their local hazards but regarded them as something to endure, as part of the seasonal pattern. In the case of the Brisbane suburbs there has been a similar attitude of progressive settlement in the face of the flood hazard. Floods are part of Brisbane’s history. However, the building of Wivenhoe dam may have contributed to complacency and unwise redevelopment of riverside locations; the ‘safe development paradox’ identified by Burby (2006). Many of the places that were impacted by the 2011 floods were subject to infill and increasing urban density. 238����������Planning,�building�and�insuring� �
Household surveys in hazard-impacted communities reveal a stoicism that sees people determined to stay in place, to rebuild and recover. There is a widespread rejection of the idea of retreating or abandoning the community. People opt for various strategies of accommodation while demanding more engineering protection – levees, seawalls or dams. The argument that these things may be counterproductive in the longer term is not accepted by most residents. This attitude converts into a political agenda that promises protective solutions rather than abandonment or retreat. However, it is clear from interviews in communities and post disaster surveys that many people have already left disaster impacted places, and many more communicated an intention to leave if repeated disasters occurred. The Grantham relocation was a policy exception in moving a disaster-impacted community. The research indicates that this response is likely to generate many complex issues, socially and administratively. It may potentially be an appropriate solution in the long term, particularly when examined alongside the North Queensland reconstruction response within the storm surge zone. The main differences between the Lockyer Valley and Cyclone Yasi events were the loss of life and the lack of prior warning, not the difference in hazard risk, which has a far greater probability of return on storm surge prone coasts, than the type of severe flash flood that occurred in Toowoomba and the Lockyer Valley. Logically it is communities in cyclone surge prone locations that have the greatest priority to retreat or relocate. However, household surveys showed that people are primarily in favour of remaining at their current locations, demanding protective measures such as dams, levees and sea defences. Adaptation to climate change with its increased frequency of severe hazards, will require an acceptance that protective measures will not work in the long term and that strategic retreat will have to be planned and administered to remove people from hazard vulnerable locations. Building The building section of the report (Part 7) reviews the main weather-related hazards that damage houses, in the context of regulatory mechanisms (i.e. building codes and standards). Houses were categorized according to their location, age, and construction methods. The report also discusses the ability of regulations to respond to projected climate change scenarios, particularly those related to windstorms. Methods for assessing vulnerability using engineering-based reliability techniques are discussed and used in case studies to investigate the resilience of two house types used in cyclonic regions. The case studies consider a range of different upgrade options to strengthen the capacity of critical connections of existing houses, and address the effect of higher wind loading caused by increased internal pressure that develops if a dominant opening occurs in the building envelope. This work can be used to assist with future studies on adaptation measures for housing subjected to increased wind speeds that may be caused by climate change. The review shows building regulations and design standards can be revised to meet societal needs to balance an acceptable level of risk against implementation cost. Design codes with respect to wind loading, flooding and bushfires have all been
Planning,�building�and�insuring�����������239� �
revised after recent events such as Tropical Cyclone Yasi, the Brisbane floods and the Victorian bushfires. To design for resistance to wind storms, the current wind loading standard specifies design wind speeds that are based on estimates of both the intensity and frequency of extreme winds. Recent studies have shown that there is no evidence of an increasing trend in peak gust wind speeds measured in Australia, and hence it is unknown to what extent the changing climate will influence wind speeds. Nevertheless structural adaptation or strategies for older housing and for houses built in non-cyclonic regions post-1980 can significantly improve their resilience to windstorms. In cyclonic regions, pre-1980s houses are significantly weaker than housing built since the early 1980s. Structural upgrading is effective in reducing the vulnerability of the older houses. Upgrading of critical roofing connections may be carried out effectively when the roof cladding is being replaced as access to the roof space is available. Protecting building envelope openings from wind-borne debris impact will reduce the possibility of creating a dominant opening that generates large internal pressure, thus also improving the resilience of houses. Education and awareness of the consequences of making counter precautionary design assumptions, and of faulty construction (e.g. damage to property and risk to life) is required at every step of the building process (regulation, design, construction, certification and maintenance) and by all parties (designer, builder, certifier, and owner). This study presents possible adaptation strategies that could be used to improve the resilience of housing to wind loading caused by severe wind events. It also recommends that probabilistic vulnerability modelling is conducted in conjunction with economic analysis to investigate relative costings for the different upgrade options. This will allow the optimum adaptation measures (i.e. those where the benefits outweigh the costs for a range of possible climate change scenarios) to be identified. Insuring The insurance research considered the impact on insurer behaviour and risk acceptance. Engineers queried how insurance might facilitate uptake of codes but insurers stated that it was too small a detail with far too great a cost to roll out and police. There has been a process of privatisation of risk, shifting responsibilities to individuals and households. In any case, insurance encourages risk acceptance. There are no solid figures on bushfire insurance uptake by households but about 13% of losses from the Black Saturday fires were not insured. Following the Canberra fires of 2003 estimates suggest between 27% and 81% were underinsured. Lack of insurance coverage in Australia is not necessarily an issue for insurance companies, which are primarily answerable to shareholders and which are in any case focussing on increasing their markets elsewhere (in particular in Asia). An increase in losses currently seems to be due to a shift in demographics – ‘sea change’ and ‘tree change’ for example - as well as affluence and increases in contents and house size. The demographic shift places new residents into vulnerable locations 240����������Planning,�building�and�insuring� �
where people lack knowledge and awareness of the local hazards. The research revealed some challenges in mitigation, adaptation and resilience. People are not necessarily ‘building back better’ after an insurance settlement following a disaster loss. A great deal of responsibility for this failure to improve and to build on resilience may be attributed to be actions of insurance companies covering direct rebuilding or replacement. People may be willing to improve upon their resilience and mitigation of future hazard impact, but are not encouraged to do so. Insurance coverage may generate a sense of complacency, the same as the safe development paradox, where “people buy insurance rather than solutions” (Tasmanian Fire services Officer). A key finding of the research was that insurance has a limited role in encouraging climate change adaptation measures, but this does not mean that the system has no capacity to advance adaptation. It is not a concern of insurance companies to engage in climate change adaptation, but they have clearly monitored climate change very closely and are adjusting their premiums in relation to probability of risk. Therefore, there is an opportunity for government regulation of insurance or other factors that contribute to insurance. For example land use planning and building codes are areas that directly contribute to risk and therefore influence insurance premiums. It is therefore critical that the insurance industry work with the building and planning sectors. In terms of regulation it is the role of government to define flood coverage through such things as comprehensive flood mapping. Compulsory flood or fire insurance may be equally as justifiable as compulsory third-party car insurance. In particular, there is a need to make available insurance for people on low incomes. Government will need to play a leading role here. More work needs to be done in the area of regulation – our recommendations include a call for non-regulatory and regulatory approaches to the use of insurance in climate change adaptation and associated risk management to be investigated through collaboration between the public and private sectors. There are many options for government and insurer collaborative arrangements. In terms of adaptation there are examples where community and government collaboration is an incentive. Housing construction and insurance sector representatives saw limited opportunities for innovation at the household level. However, some local governments did realise (albeit retrospectively) that rewards of reduced premiums had been initiated for them by insurance companies for good practices demonstrably reducing risk. In terms of the retreat strategy there is evidence of an insurance withdrawal from some hazard vulnerable zones. For example, some insurance companies have withdrawn insurance coverage from flood prone communities, unless councils build protective structures, such as levees. Apart from the fact that such actions fail to encourage real adaptation, the lack of insurance coverage for some places may create ghettoes and disadvantaged communities where vulnerability increases over decades. Declining insurance availability is a very real social problem. Low income households and disadvantaged communities are especially at risk and will rely on government intervention either in facilitating an insurance scheme or in driving a different kind of adaptation.
Planning,�building�and�insuring�����������241� �
In summary, having insurance is not always a priority or even an option for all. In addition to significant rates of noninsurance and underinsurance, there is expectation of declining insurance availability and affordability in a changing climate. This will especially impact low-income earners. Insurance has little role at present in encouraging climate change adaptation measures, including risk mitigation. The role for insurance here is currently understood in terms of recovery not preparedness. There is limited interest in using insurance to initiate innovation in climate change adaptation, notwithstanding some engagement by insurers with the issues. The capacity of insurance to have a key role in climate change adaptation and associated risk mitigation is constrained by limitations in governance. Tensions over the roles and responsibilities for managing risks exist between the community and individuals, and between the public and private sectors. Inconsistencies amongst agencies and different levels of government are exacerbated by a lack of public sector leadership and vision. Conclusion The research was conducted in three separate inter-related projects. This reflects the quite different sectors of the built environment, with their own professions, practice, legislation and governance. Yet these sectors form a whole – our cities, towns, and communities. At the city or settlement level all sectors of the built environment are completely co-dependant. Each influences the other sectors and all rely upon a consistent approach to issues such as hazard mitigation and climate change adaptation. Building codes were modified for cyclonic winds three decades ago and the positive benefits of the codes can be seen and measured. Adaptation to climate change will most likely require an extension of codes southwards, but there are also further building modifications and codes that may need to be developed for bushfires, floods and storm surges. These adaptive changes will be formulated through legislative standards. Planning has more recently been directed towards hazard mitigation, but remains constrained by a lack of comprehensive all-hazard mapping. As it becomes possible for councils to impose development constraints or conditions the planning legislation must be strengthened to ensure that appropriate development is enforced. Insurance also needs regulatory strengthening, as it is essentially conservative in practice. If planning and building provisions are weak, insurance assesses the risk and adjusts, or even withdraws, coverage. Where people and structures are not insured, the costs of a disaster are usually transferred to government and the whole community. However, a concurrent danger that must be anticipated is the safe development paradox, where people and organisations assume they are protected, and do nothing further to adapt to the changing environment. In accepting the probability of increased risks and impacts of climate change in Australia, we conclude that mitigation and adaptation cannot be left to voluntary uptake or good practice. Good governance will need to drive the delivery of a more resilient
242����������Planning,�building�and�insuring� �
nation by variously engaging individuals, households, communities, businesses, organisations and all levels of government. The research found that even in the absence of increased risk due to climate change, predictable extreme weather events are under-considered in planning, building and insurance sector responses. We note further than appropriate sector and policy responses to climate change look very like an improved consideration of foreseeable extreme weather events (i.e. based on historical predictors, not climate-change induced). Policy makers and sectoral specialists facing uncertain political and constituent engagement with climate change debates have sufficient historical data on extreme weather events to engage confidently with the adaptation strategies canvassed here. One effective line of approach is to provide professional planners, builders and insurers with some new and very clear policies, codes and laws that will structure their activities to bring about an evolving built environment that is more adaptive to both extreme and increased intensity of natural hazards.
Planning,�building�and�insuring�����������243� �
8.2 Recommendations The following recommendations include the key findings that are summarised in the executive summary. These recommendations are intended as areas that may be developed as policy. Planning 1. The recommendations about land use planning contained in the report of the Queensland Floods Commission of Inquiry are sound and sensible contributions to many of the changes that are necessary in order to enhance the capacity of planners and councils to mitigate natural hazard impacts and adapt to extreme weather events and to the greater impacts that may result from climate change. Some recommendations are straightforward and will not be contested or controversial, but this research has indicated several areas where change will be much more complex. 2. The first step to an overhaul of land use planning in hazard vulnerable areas is detailed knowledge and mapping of all hazard zones, within which it is essential to model changes that may be expected from extreme events and climate change. All hazard zones – flood, bushfire, storm surge, flash flood, landslide – must be mapped in sufficient detail to inform planning development assessments and decisions. We note that this process has been ongoing for at least the last decade and that much work remains to be completed. The FCI recommended the completion of comprehensive flood studies, ideally in whole catchments, but at least in all urban areas. “Along with detailed mapping, flood studies typically have two main components: a) a hydrologic study aimed at determining rainfall and associated stream flows in a range of scenarios; b) a hydraulic analysis that estimates the behaviour of flood flow (that is, flow rate, velocity, depth and extent of inundation) as it passes through the floodplain.” (QFCI 2012) This definition implies that fine detail and accurate information must be available down to the property level – i.e. LiDAR type information rather than large scale contour intervals. 3. The Queensland State Planning Policy 1/03 has not been effective in guiding land use planning in vulnerable locations. It is currently under review, but clearly must be made much stronger in its scope, its requirements and its reporting/referral procedures. It must be shown to be compulsory not optional. Ideally the primary planning legislation should directly identify hazard mitigation planning under the act, so that it is central to planning rather than an add-on through a state planning policy. This will require a significant rewriting of the Sustainable Planning Act (or a new act) in Queensland, and most probably in other states as well. Issues of public safety have to be compulsory, not an option of best practice. Planning legislation that recognises hazard mitigation as an integral part of the planning process will not need to be overridden or supplemented by temporary policies or emergency legislation. 4. There is a lack of agreement or consensus amongst planners in response to FCI recommendations concerning: a) Land swaps and buybacks of properties in highly hazard vulnerable locations; b) Retreat or relocation strategies; 244����������Planning,�building�and�insuring� �
c) The use and usefulness of defined flood levels such as the Q100; d) Regulation and construction of hazard protection measures such as levees; e) The level of government responsibility and funding for hazard mitigation and related activities. 5. Four groups of significant issues found consensus amongst planners: a) Whole of catchment flood mapping, b) Climate change adaptation as part of hazard mitigation, c) Zones of limited or constrained development, and d) Flash flooding. 6. These consensual recommendations, derived from the Flood Inquiry recommendations, reinforce earlier conclusions and were stated as follows. a) Local government councils should be responsible for the development of a floodplain management plan. b) Floodplain management plans should adhere to best practice guidelines. c) Comprehensive flood studies should be carried out in all local government areas in Queensland. d) Comprehensive flood studies must take into account the likely impacts of climate change on future floods. e) Comprehensive flood studies should be carried out within the context of the whole catchment. f) Planning schemes should be amended immediately as better flood information becomes available, or if development results in a change to flood risk hazard zones. g) All areas of future urban growth should be mapped for three or more levels of flood risk. h) All local government area flood mapping should be accessible to members of the public on a web site or as printed maps. i) The flood risk to all individual properties and parcels of lands should be made available to the public. j) Queensland Planning Provisions should define a zone of limited development, or constrained land, areas subject to high risk of flooding, in order to impose severe restrictions on urban development in high risk areas. k) Detailed flood advice affects property values, but if property values are affected by detailed flood advice, councils should not be responsible for compensating property owners for any loss of value. l) Councils are not liable for flood impact damage as long as the council has carried out reasonable mitigation and provided the most up to date information to the general public and property owners. m) State Development areas must take account of flood risk and should be constrained in the same manner as any other development application. n) Construction works and fill in low lying flood prone areas should not be permitted if they increase local flooding or reduce flood storage capacity. o) Community infrastructure must be able to function effectively immediately after a flood or any other kind of natural disaster. p) Planning schemes should contain flood and stormwater policy that sets out information to be provided in development assessments. q) Because overland flow paths are primarily conduits for flash floods these must be mapped as part of overall flood risk assessment. Planning,�building�and�insuring�����������245� �
Building 7. The resilience of houses to natural hazards such as windstorms, floods and bushfires can be improved by revising regulations (BCA) and design standards. Revisions to design and construction standards have resulted in post-80s houses being more resilient to windstorms compared to pre-80s houses. 8. Structural upgrading is effective in reducing the vulnerability of pre-80s houses throughout Australia. 9. The provision of building envelope protection against windborne debris will also reduce the vulnerability of post-80s houses, especially in non-cyclonic regions. This is an adaptation strategy that would also be effective for shift in cyclone boundaries or increases in wind loads that result from climate change. 10. Education to improve the house building-process (regulation, design, construction, certification and maintenance) and for all parties (designer, builder, certifier, and owner) will also enhance community resilience. Insuring 11. That further research be conducted into the contexts and processes informing people’s prioritisation in the purchase and maintenance of insurance policies, including their awareness of, and interest in what these policies do and do not cover. 12. That public expectations in relation to insurance be more closely aligned with the insurance reality through clearer insurance industry communications with customers and through government-driven education initiatives. 13. That research to ascertain the likely changes in the costs and availabilities of insurance coverage and subsequent impacts on the built environment be undertaken in light of climate change with direct reference to bushfires and other natural hazards. 14. That mechanisms for providing affordable insurance to low-income earners be further investigated and implemented. 15. That insurance be recognised, explored and implemented as a mechanism for promoting disaster-preparedness as well as recovery with regard to climate change adaptation. 16. That insurance be recognised and implemented as acting in concert with other mechanisms such as building codes and land use planning regulation. 17. That a review be undertaken into the factors that impact on insurer activity in encouraging and incentivising climate change adaptation and associated risk mitigation measures. 18. That further research be conducted into public prioritisations regarding climate change adaptation and risk mitigation and related mechanisms 19. That government in collaboration with insurers investigate and implement appropriate climate change adaptation mechanisms such as the development of long-term insurance contracts. 20. That research be undertaken to identify, develop and implement instances of innovation regarding the role of insurance in climate change adaptation and risk mitigation.
246����������Planning,�building�and�insuring� �
21. That research assess how insurance best operates as a climate change adaptation mechanism across individual, household, business and community levels. 22. That government interventions into the insurance industry and insurance markets reconcile existing tensions between government and individual responsibility for risk. 23. That non-regulatory and regulatory approaches to the use of insurance in climate change adaptation and risk mitigation be investigated and implemented. 24. That more effective linkages be fostered between the various, relevant agencies and organisations across public and private sectors, including those in the insurance and reinsurance industries. 25. That state and federal governments demonstrate greater leadership on the investigation and implementation of the role of insurance in climate change adaptation. 26. That comprehensive hazard data sets and risk maps be made available to all stakeholders and compliance implemented.
Planning,�building�and�insuring�����������247� �
9. REFERENCES ABC 2012 Radio National: AM with Tony Eastley 23/2/12, Australian Broadcasting Corporation, http://www.abc.net.au/radionational/programs/breakfast/2012-0223/3846628 ABCB 2011 Draft Standard for construction of buildings in flood hazard areas. Version 6, Australian Building Codes Board, Canberra. Abel, N, Gorddard, R, Harman, B, Leitch, A, Langridge, J, Ryan, A & Heyenga, S 2011, Sea level rise, coastal development and planned retreat: analytical framework, governance principles and an Australian case study, Environmental Science & Policy, Vol. 14, pp 279-288. ABI 2009, Assessing the Risks of Climate Change: Financial Implications. Association of British Insurers, London. ACT Government. 2003, Report of the Bushfire Recovery Taskforce: Australian Capital Territory, October 2003. ACT Government, Canberra. Adejuwon J, Azar C, Baethgen W, Hope C, Bruce J, Moss R, Leary N, Richels R & Van Ypersele J P 2001, Overview of Impacts, Adaptation, and Vulnerability to Climate Change. (In Climate change 2001: impacts, adaptation, and vulnerability, 75. (eds Schneider S, Sarukhan J) Adger, W N, Huq, S, Brown, K, Conway, D, Hulme, M 2003, Adaptation to climate change in the developing world, Progress in Development Studies, Vol. 3, pp 179-195. Adger, W N, Hughes, T P, Folke, C, Carpenter, S R & Rockström, J 2005, Social Ecological Resilience to Coastal Disasters, Science, Vol. 309, No. 5737, pp 1036– 1039. AFAC 2010, Position paper on bushfires and community safety. Australian Fire Authorities Council, Melbourne, http://knowledgeweb.afac.com.au/Industry_Positions_and_Policies/documents/Bushfire s_and_Community_Safety_15_SEPT_2010.pdf Apan, A, Keogh, D U, King, D, Thomas, M, Mushtaq, S & Baddiley, P 2010. The 2008 Floods in Queensland: A Case Study of Vulnerability, Resilience and Adaptive Capacity, Published NCCARF, Griffith university, Queensland. Arnold, M, Chen, R S, Deichmann, U, Dilley, M, Lerner-Lam, A L, Pullen, R E, & Trohanis, Z 2006, Natural Disaster Hotspots: Case Studies. Disaster risk management series 6. World Bank, Washington DC, USA. ARR 1987, Australian Rainfall and Runoff 1987 The Institution of Engineers, Australia, Barton, ACT. AS 3959 2009, Construction of buildings in bushfire-prone areas, Standard Australia, NSW, Sydney.
248����������Planning,�building�and�insuring� �
AS 4055 2006, Wind Load for Housing, Standard Australia, Sydney, NSW. AS/NZS 1170.0 2002, Structural Design Action Part 0: General Principles, Standard Australia, Sydney, NSW. AS/NZS 1170.2 2011, Structural Design Action Part 2: Wind Action, Standard Australia, Sydney, NSW. Ashe, B, McAneney, KJ & Pitman, AJ 2009, Total cost of fire in Australia, Journal of Risk Research 12(2), 121-136. ASIC 2005, Getting Home Insurance Right: A Report on Home Building Underinsurance. Australian Securities and Investment Commission, Gippsland, Victoria. Attorney-General's Department (AGD) 2009, Emergency Management in Australia [Online]. Australian Government. http://www.ag.gov.au/EmergencyManagement/Pages/default.aspx viewed 20/12/12 Australian Bureau of Statistics (ABS) 2008, Population Projections, Australia, 20062101. Australian Government Attorney General’s Department, 1998, Australian Emergency Management Glossary – Manual 3, Emergency Management Australia, Canberra Australian Government Bureau of Meteorology (2011), Australian Government Bureau of Meteorology, Canberra, viewed 18 April, http://www.bom.gov.au/hydro/flood/qld/fld_history/brisbane _history.shtml Australian Government Department of Climate Change 2009) Climate Change Risks to Australia’s Coast-A First Pass National Assessment, Commonwealth of Australia, Canberra, A.C.T. Ayers, J & Huq, S 2008, The value of linking mitigation and adaptation: A case study of Bangladesh, Environmental Management, Unpublished. Balcombe, L 2009, Bushfires at the urban-rural interface. In: King, D and Cottrell, A 2009 (Editors). Communities Living with Hazards, Centre for Disaster Studies, James Cook University: Townsville. Bates, G 2006, Environmental Law in Australia, 6th edn, Lexus Nexus Butterworths, Chatswood. Bernard, H R 2002, Research Methods in Anthropology: Qualitative and Quantitative Methods, 3rd edn, AltaMira Press, California. Berry, A & Carpenter, R 2010, In the line of fire managing growth at the forest’s edge: Protecting lives, ecosystems and taxpayer dollars, Sonoran Institute, Bozeman, Montana, USA, www.sonoran.org/component/docman/.../883-in-the-line-of-fire.html
Planning,�building�and�insuring�����������249� �
Bird, D, King, D, Haynes, K, Box, P, Okada, T, & Nairn, K 2011, Investigating Factors that Inhibit and Enable Adaptation Strategies Following the 2010/11 Floods: A Report for the National Climate Change Adaptation Research Facility Synthesis and Integrative Research Program, Risk Frontiers, Macquarie University, Centre for Disaster Studies, James Cook University, NCCARF, Griffith University Blanchi, R & Leonard, J 2008, Property safety – judging structural safety. In Handmer, J.W. and Haynes, K. (Editors). Community Bushfire Safety, CSIRO Publishing, Canberra. Blanchi, R, Leonard, J & Leicester, RH 2006a. Lessons learnt from post-bushfire surveys at the urban interface in Australia, Forest Ecology and Management 234S, S139. Blanchi, R, Leonard, J & Leicester, RH 2006b, Bushfire risk at the rural/urban interface, Bushfire CRC, Melbourne, http://www.bushfirecrc.com/research/downloads/Bushfire%20risk%20at%20the%20Rur al%20Urban%20interface%20-%20Brisbane%202006.pdf Blanchi, R, Leonard, J & Maughan, D 2004, Towards new information tools for understanding bushfire risk at the urban interface, Bushfire CRC, Melbourne, http://www.bushfirecrc.com/research/downloads/Bushfire-adelaide-2004-blanchi1.pdf Blong, R 2003, A new damage index. Natural Hazards 30, 1-23. Blong, R 2004, Residential building damage and natural perils: Australian examples and issues, Building Research and Information 32(5), 379-90. Blong, R 2005, Natural Hazards Risk Assessment: An Australian Perspective, Issues in Risk Science. Issue 4. Benfield Hazard Research Centre: London. BoM n.d., Australia’s three climate zones, Bureau of Meteorology, Canberra, ACT, http://www.bom.gov.au/climate/environ/design/climzone.shtml Bosher, L 2011, Household and governmental perceptions of risk: Implications for the appropriateness of housing provision in South India, Housing Studies, 26(2), 241-257. Boughton, GN, Henderson, DJ, Ginger, JD, Holmes JD, Walker GR, Leitch, CJ, Somerville LR, Frye, U, Jayasinghe NC & Kim, PY 2011, Tropical Cyclone Yasi – Structural damage to buildings, James Cook University Cyclone Testing Station Technical Report TR57 Braun, K. 2006, Wildland fire risk: integrating community resilience or community vulnerability attributes and hazard assessments, to provide a comprehensive risk model, Forest Ecology and Management 234S, S29. Briggs, P, Taberner, J, Voros, M & Bilski, A 2010, Climate change litigation to flood planning and development in coastal areas, Freehills International Law Firm, Sydney, http://www.freehills.com/5789.aspx.
250����������Planning,�building�and�insuring� �
Brisbane City Council 2008, Subdivision and Development Guidelines Part A Hazard Management Chapter 1 Flood Affected Land, Brisbane City Council, Brisbane. Brisbane City Council 2011a, Flooding in Brisbane – Challenges and Implications, Brisbane City Council Ͳ 2011b, Queensland Floods Commission of Inquiry Initial Submission 11 March 2011, Brisbane City Council, Brisbane. Ͳ Ͳ Ͳ Ͳ Ͳ
2011c, Joint Task Force Report March 2011, Brisbane City Council, 2011. 2011d, 20 Years of Urban Renewal Brisbane, Queensland Planner, vol. 51, no. 2, pp. 13-15. 2011e, Queensland Floods Commission of Inquiry Submission Three, 8 April 2011, Brisbane City Council, Brisbane.
Ͳ
2011f, Floods Fact Sheet - Advice for Residents – Approvals for Repairing, Rebuilding or Renovating Flood Affected Houses, Brisbane City Council, Brisbane.
Ͳ
2001g, South Brisbane Riverside Renewal Strategy, Brisbane City council, Brisbane.
Ͳ
2011h, Brisbane Land Use Planning Triggered by Flood Events, Brisbane City Council
Britton, NR 2002, A new emergency management for the new millennium? Australian Journal of Emergency Management, 16, 44-54. Burby RJ 2006, Hurricane Katrina and the Paradoxes of Government Disaster Policy: Bringing About Wise Governmental Decisions for Hazardous Areas, The ANNALS of the American Academy of Political and Social Science March 2006 vol. 604 no. 1 171191 Burby, R J 1998, Cooperating with nature – confronting natural hazards with Land-Use Planning, Joseph Henry Press, Washington D.C. Bureau of Infrastructure, Transport and Regional Economics, (BITRE), 2008, About Australia’s regions. Bureau of Infrastructure, Transport and Regional Economics: Canberra Bureau of Meteorology BoM 1974, Brisbane Floods - January 1974, Australian Government Publishing Service, Canberra, A.C.T. Bureau of Meteorology 2011, Brochure - Flood Warning System for the Brisbane River below Wivenhoe Dam to Brisbane City, Bureau of Meteorology, Brisbane, viewed 30 May, 2011, http://www.bom.gov.au/hydro/qld/brochures/Brisbane_lower/Brisbane_lower.shtml
Planning,�building�and�insuring�����������251� �
Bureau of Transport and Regional Economics (BTRE) 2002, Benefits of flood mitigation in Australia. Report 106, Bureau of Transport and Regional Economics: Canberra Bureau of Meteorology Burmester, J 2009, Compensation questions over Belongil, Byron News, APN News and Medial LTD 2008, Byron. Burton, I, Huq, S, Lim, B, Pilifosova, O, & Schipper, EL 2002, From impact assessment to adaptation priorities: the shaping of adaptation policy, Climate Policy, Vol. 2, pp 145159. Bushnell, S & Cottrell, A 2007, Increasing community resilience to bushfire – implications from a north Queensland community case study. Australian Journal of Emergency Management 22(2), 3-22. Bushnell, S, Balcombe, L & Cottrell, A 2007, Community and fire service perceptions of bushfire issues in Tamborine Mountain: what’s the difference? Australian Journal of Emergency Management, 22(3), 3-9. Butler, WH, & Goldstein, BE 2010, The US Fire Learning Network: Springing a Rigidity Trap through Multi-scalar Collaborative Networks, Ecology and Society. Vol 15, No 3: 21 Byrne J 2011, ‘Beyond Engineering Solutions’, Urban Design Forum, vol. 93, March 2011, p.1. Byrne, D & Ragin, CR 2009, The Sage Handbook of Case-Based Methods, Sage, London, UK. Camilleri. P, Healy, C, McDonald, E, Nicholls, S, Sykes, J, Winkworth, G, & Woodward, M 2007, Recovering from the 2003 Canberra bushfire: A work in progress, Australian Catholic University, Canberra, http://www.preventionweb.net/files/2948_RecoveryCanberra2003July2007.pdf Cardwell Shire Council 2011, Cardwell Shire Council Planning Scheme, Viewed 13 August 2011, http://www.csc.qld.gov.au Carroll, S 2010, Buildings in Bushfire-prone areas after Black Saturday, Third Quarter, ProQuest Career and Technical Education. CFA 2002, Building in a Wildfire Management Overlay: Applicant’s kit, Country Fire Authority, Melbourne, http://www.latrobe.vic.gov.au/WebFiles/Council%20Services/Planning/wmo_applicants _kit%5B1%5D.pdf Chapin, FS, III, PA Matson, and PM Vitousek 2011, Principles of Terrestrial Ecosystem Ecology, 2nd edition. Springer, New York Chen, K & McAneney, J 2005, The bushfire threat in urban areas, Australian Science 26(1), 14-16. 252����������Planning,�building�and�insuring� �
Chen, K & McAneney, KJ 2004, Quantifying bushfire penetration into urban areas in Australia, Geophys. Res. Lett., 31, L12212, doi:10.1029/2004GL020244 Christianson, A, McGee, T & Jardine, C 2011, Canadian wildfire communication strategies, Australian Journal of Emergency Management 26(3), 40-51. City Postcodes 2011, City Postcodes, Brisbane, viewed 30 August 2011, http://www.citypostcodes.com.au/Brisbane_postcode/West_End/Postcodes/19065 Council of Australian Governments (COAG) 2004, Natural Disasters in Australia. Reforming Mitigation, Relief and Recovery Arrangements, A report to the Council of Australian Governments by a high̻level officials’ group, August 2002, Department of Transport and Regional Services, Canberra. COAG 2009, National Strategy for Disaster Resilience: Building our nation’s resilience to disasters. Council of Australian Governments, Canberra. http://www.coag.gov.au/coag_meeting_outcomes/2011-0213/docs/national_strategy_disaster_resilience.pdf accessed 27/5/12 Coates, L 2011, Floods and land-use planning – a brief Australian history of town relocations, Risk Frontiers Quarterly Newsletter Vol 11, Issue 2. Coffman, LS, 2001, Low Impact Development creating a storm of controversy, Water Resources Impact, vol. 3, no. 6 pp. 7-9. Core Logic 2011, Core Logic, viewed 19 July 2011, http://www.rpdata.com Cottrell, A 2005, Communities and Bushfire Hazard in Australia: More questions than answers, Global Environmental Change Part B 6(2), 109-114. Cottrell, A & King, D 2007, Planning for more bushfires: implications of urban growth and climate change, Queensland Planner 47(4), 23-26. Crichton, D 1999, The risk triangle. In Natural disaster management (ed. J. Ingleton), pp. 102–103.London, UK: Tudor Rose. Crichton, D 2007, What can cities do to increase resilience? Philosophical Transactions of the Royal Society A 365, 2731-2739. Crompton, R & McAneney, J 2008a, The cost of natural disasters in Australia: the case for disaster risk reduction, The Australia Journal of Emergency Management Vol 23 (4) November 2008. Crompton, RP & McAneney, KJ 2008b, Normalised Australian insured losses from meteorological hazards: 1967-2006, Environmental Science and Policy 11, 371-378. Crompton, RP, McAneney, KJ, Chen, K, Leigh, R & Hunter, L 2008, Property losses due to natural hazards, In: Newton, P.W. (Editor), Transitions: Pathways to Sustainable Urban Development in Australia. Springer: Dordrecht, Holland.
Planning,�building�and�insuring�����������253� �
CSIRO 2011, Climate Change: Science and Solutions for Australia, Viewed 23 May 2011, http://www.csiro.au/resources/Climate-Change-Book.html CSIRO and Bureau of Meteorology 2010, State of the Climate. Commonwealth of Australia Cutter, SL, Boruff, BJ & Shirley, WL 2003, Social Vulnerability to Environmental hazards, Social Science Quarterly, Vol. 84, pp 242-261. Cyclone Testing Station & Queensland Reconstruction Authority 2011, Planning for a stronger, more resilient North Queensland, Part 1 - Rebuilding in Storm Tide Prone Areas: Tully Heads and Hull Heads, Queensland Government De Vaus, D 2002, Analysing Social Science Data – 50 Key Problems in Data Analysis, Sage, London. Department of Climate Change 2009, Climate Change Risks to Australia’s Coast: A First Pass National Assessment, Department of Climate Change, Commonwealth of Australia. http://www.climatechange.gov.au/publications/coastline/~/media/publications/coastline/ 6-chapter.pdf Department of Climate Change 2011, Australia’s coasts and climate change, Viewed 18 April 2011, http://www.climatechange.gov.au/en/climate-change/australias-coastsand-climate-change.aspx Department of Environment & Resource Management 2011, State Coastal Plan, 2001, Viewed 24 May 2011, http://www.derm.qld.gov.au/environmental_management/coast_and_oceans/coastal_m anagement/state_coastal_management_plan/ Dlugolecki, A 2009, The climate change challenge. Risk Management SC1, The Geneva Association, Geneva, Switzerland, http://www.genevaassociation.org/PDF/Risk_Management/RM_SC1.rev.pdf Dorman, C. 1983, Extreme wind speeds in Australia excluding tropical cyclones, Aust Civil Engg Transactions, CE25: 96-106 Doss, K 2011, Brisbane, Planning, and the Floods of January 2011, Queensland Planner, vol. 51, no. 1, p. 16. Dovers, S 2009, Normalising adaptation, Global Environmental Change, 19, 4-6. DPAC 2010, Review of construction and development control in bushfire prone areas, Department of Premier and Cabinet, State Government of Tasmania, Hobart, http://www.dpac.tas.gov.au/__data/assets/pdf_file/0015/133170/Construction_in_Bushf ire_Prone_Areas_-_Final_Report.pdf Drabek, TE 1986, Human System Responses to Disaster: An Inventory of Sociological Findings, Springer-Verlag, New York. 254����������Planning,�building�and�insuring� �
Eburn, M 2009, Canberra bushfires litigation: NSW v West [2008] ACT Court of Appeal 14 (5 September 2008). Fire Update 28, 1-4. El Raey, KD & El Hattab, M 1999, Adaptation to the impacts of sea level rise in Egypt, Climate Research, Vol. 12, pp 89-124. Ellingwood, BR, MacGregor, JG, Galambos, TV & Cornell, CA, 1982, Probability based load criteria – load factors and load combinations J. Struct. Div. ASCE, 108, 978-997. Ellingwood, BR, Rosowsky, DV, Li, Y & Kim, JH 2004, Fragility Assessment of LightFrame Wood Construction Subjected to Wind and Earthquake Hazards, Journal of Structural Engineering 130(12): 1921-1930. Ellis, S, Kanowski, P, Whelan, R 2004, National Inquiry on Bushfire Mitigation and Management, Commonwealth of Australia, Canberra. Emergency Management Australia 1999 Managing the Floodplain. Australian Emergency Management Manual Series Part III Emergency Management Practice Volume 3 – Guidelines. Guide 3, Emergency Management Australia: Canberra Emergency Management Australia 2002 Planning Safer Communities Land Use Planning For Natural Hazards.Australian Emergency Management Manual Series Part II Approaches to Emergency Management Volume 2 - Mitigation Planning Manual 1, Emergency Management Australia: Canberra. Emergency Management Australia 2004a, Emergency Planning, Australian Emergency Manual Series: Manual 43, Emergency Management Australia, Canberra. Emergency Management Australia 2004b, Emergency Management in Australia: Principles and concepts, Australian Emergency Manual Series: Manual 1, Emergency Management Australia, Canberra. Emergency Management Australia 2004c, Emergency Management in Australia Concepts and Principles, Australian Emergency Management Manual Series Manual 1, Emergency Management Australia: Canberra. Emergency Management Australia, 2008, EMA Disasters Database [Online], Australian Government. Available: http://www.em.gov.au/Pages/default.aspx [Accessed 17 May 2012]. Emergency Management Australia 2009, Australian Emergency Management Arrangements, The Attorney-General’s Department: Victoria Emanuel, K 2005, Increasing destructiveness of tropical cyclones over the past 30 years, Nature, Vol. 436, pp 686-688. Eriksen, C & Gill, N 2010, Bushfire and everyday life: Examining the awareness-action: ‘gap’ in changing rural landscapes, Geoforum, 41, 814-825. Esplin, B, Gill, A & Enright, N 2003, Report of the Inquiry into the 2002-2003 Victorian Bushfires, State Government of Victoria, Melbourne.
Planning,�building�and�insuring�����������255� �
Federal Environmental Management Agency 2011, Federal Environmental Management Agency, Washington, viewed 8 October 2011, http://www.fema.gov/ Flyvbjerg, B 2006, Five misunderstandings about case-study research, Qualitative Inquiry, 12(2), 219-245. Folke, C, Colding, J & Berkes, F 2002, Synthesis: building resilience and adaptive capacity in social-ecological systems, Cambridge University Press, Cambridge. Ford, JD, Keskitalo, ECH, Smith, T, Pearce, T, Berrang-Ford, L, Duerden, F & Smit, B 2010, Case study and analogue methodologies in climate change vulnerability research, Wiley Interdisciplinary Reviews: Climate Change, 3 (1), 374-392. Forsyth, GG, Kruger, FJ & Le Maitre, DC 2010, National veldfire risk assessment: Analysis of exposure of social, economic and environmental assets to veldfire hazards in South Africa, CSIR Report No: CSIR/NRE/ECO/ER/2010/0023/CS, CSIR Natural Resources and the Environment, Stellenbosch, http://forestry.daff.gov.za/webapp/Documents/Veldfire_Risk_Report_v11.pdf Fraser, A 2011, ‘River City architect Michael Rayner washed away, now looking for new ways to stay dry’, The Australian, 22 January, p. 6. Ganewatta, G, Grahlmann, L & Handmer, JW 2006, An economic analysis of bushfires management programs, International Association of Agricultural Economists Conference, Gold Coast, Queensland, 12-18 August 2006, http://ageconsearch.umn.edu/bitstream/25278/1/pp062651.pdf Ganewatta, GJ & Handmer, JW 2006, Bushfire management: why, where and how economics matter? Australasian Bushfire Conference, Brisbane, Queensland, 6-9 June 2006, http://www.griffith.edu.au/conference/bushfire2006/pdf/bushfire-management.pdf Ganewatta, GJ & Handmer, JW 2009, The cost-effectiveness of aerial fire-fighting in Australia, Centre for Risk and Community Safety, RMIT University, Melbourne http://www.bushfirecrc.com/research/downloads/The-Cost-Effectiveness-of-Aerial-FireFighting-in-Australia.pdf Geneva Association 2009, The insurance industry and climate change: contribution to the global debate, The Geneva reports risk and insurance research no. 2, The Geneva Association, Geneva, Switzerland, http://www.genevaassociation.org/PDF/Geneva_Reports/Geneva_report[2].pdf Gentle, N, Kierce, S & Nitz, A (2001). Economic cost of natural disasters in Australia, Bureau of Transport Economics, Canberra, http://www.em.gov.au/Documents/Economic_costs_of_natural_disasters_in_Australia. pdf Geoscience Australia 2007, Natural Hazards in Australia - Identifying risk analysis requirements, by Geoscience Australia, DOTARS, Bureau of Meteorology and CSIRO.
256����������Planning,�building�and�insuring� �
Geoscience Australia 2010, National Hazards Committees, [Online] Updated November 24 2010. http://www.ga.gov.au/hazards/governance/national-committeeshazards.html Accessed December 8, 2010. Geoscience Australia, (GA) 2010, Natural Hazards Home [Online] http://wwwa.ga.gov.au/hazards/ Accessed December 10, 2010 Gilbert J & Vellinga P 1991, Coastal zone management in Misdorp R Dronkers J and Spradley J R eds Climate change: the IPCC response strategies WMO/UNEP Island Press, Washington DC 131–59 http://www.ipcc.ch/ipccreports/far/wg_III/ipcc_far_wg_III_chapter_05.pdf Gill, AM 2005, Landscape fires as social disasters: An overview of the bushfire problem. Global Environmental Change Part B: Environmental Hazards 6(2), 65-80. Ginger JD (ed.) 2011, Extreme windspeed baseline climate investigation project, Report to the Department of Climate Change and Energy Efficiency, James Cook University Cyclone Testing Station, Bureau of Meteorology, Geoscience Australia and JDH Consulting, April 2011. Godschalk, D R, Kaiser, E J & Berke, P R 1998, Integrating Hazard Mitigation and Local Land Use Planning, Joseph Henry Press, Washington D.C. Gomes, L & Vickery, BJ 1976, On thunderstorm wind gusts in Australia, Aust Civil Engg Transactions, CE18: 33-39 Goodnough, A 2006, As hurricane season looms, states aim to scare, The New York Times, http://www.nytimes.com/2006/05/31/us/31prepare.html?_r=1 Green, D, Alexander, L, McInnes, K, Church, J, Nicholls, N & White, N 2010, An assessment of climate change impacts and adaptation for the Torres Strait Islands, Australia, Climate Change, Vol. 102, pp 405-433. Grigg, T 2011, ‘Mitigating Flood Hazard’, Queensland Planner, vol. 51, no.1, pp. 21-22. Grothmann, T & Patt, A 2005, Adaptive capacity and human cognition: The process of individual adaptation to climate change, Global Environmental Change, Vol. 15, pp 199-213. Gurran, N 2005, Planning at the conservation frontier, Australian Planner 42(1), 31-8. Gurran, N, Blakely, EJ and Squires, C 2007, Governance responses to rapid growth in environmentally sensitive areas of coastal Australia, Coastal Management 35, 445-65. Hackett, S 2011, January 2011 Brisbane River Flood – Why an Interim Response?, paper presented at a Brisbane City Council information evening, Brisbane, 20 June. Hakim, C 1987, Research Design: Strategies and Choices in the Design of Social Research, Routledge, London.
Planning,�building�and�insuring�����������257� �
Handmer, J 2006, American exceptionalism or universal lesson? The implications of Hurricane Katrina for Australia, Australian Journal of Emergency Management, 21(1), 29-42. Handmer, JW and Dovers, S 2007, The Handbook of Disaster and Emergency Policies and Institutions, Earthscan, London, UK. Harper, BA, Stroud, SA, McCormack, M & West, S 2008, A review of historical tropical cyclone intensity in northwestern Australia and implications for climate change trend analysis, Australian Meteorological Magazine 57:121-141. Haynes, K, Handmer, J, McAneney, J, Tibbits, A and Coates, L 2010, Australian bushfire fatalities 1900-2008: Exploring trends in relation to the ‘Prepare, stay and defend or leave early’ policy, Environmental Science and Policy 13, 185-194. HB132.1 1999, Structural upgrading of older houses - Part 1 :Non-cyclone areas, Standards Australia, Sydney, NSW. HB132.2 1999, Structural upgrading of older houses - Part 2 :Cyclone areas, Standards Australia, Sydney, NSW. Hecht, SB 2008, Climate change and the transformation of risk: Insurance matters, UCLA Law Review, 55, 1559-1620. Henderson, DJ and Ginger, JD 2007, Vulnerability model of an Australian high-set house subjected to cyclonic loading, Wind & Structures 10(3): 269-285. Henderson, D and Harper BA, 2004 Detailed Modelling of the Vulnerability of Domestic Housing to Tropical Cyclone Winds. Proc. Intnl Conf on Storms and AMOS 11th Annual Conf, Brisbane, 182-183, July,. Henderson, DJ, Ginger, JD, Leitch, C, Boughton, G and Falck, D 2006, Tropical Cyclone Larry – Damage to buildings in the Innisfail area, James Cook University Cyclone Testing Station, Technical Report TR51. Henderson, DJ, Leitch, C, Frye, U, Ginger, JD, Kim, P and Jayasinghe, NC 2010, Investigation of Housing and Sheds in Proserpine, Midge point, and Airlie Beach, Following Tropical Cyclone Ului, Cyclone Testing Station, James Cook University, Townsville.TR 56. Hennessy, K, Fitzharris, B, Bates, BC, Harvey, N, Howden, SM, Hughes, L, Salinger, J and Warrick, R 2007, Australia and New Zealand. In: Parry, M.L., Canziani, O.F., Palutikof, J.P., van der Linden, P.J. & Hanson, C.E. 2007 (Editors) Climate Change 2007: Impacts, Adaptation and Vulnerability: Contribution of Working Group II to the Fourth Assessment Report of the Intergovernmental Panel on Climate Change, Cambridge University Press: Cambridge Hennessy, K, Lucas, C, Nicholls, N, Bathols, J, Suppiah, R, Ricketts, J 2005, Climate Change Impacts on Fire-Weather in South-East Australia, CSIRO, Aspendale.
258����������Planning,�building�and�insuring� �
Herald Sun 2011, Herald Sun, Melbourne, viewed 8 October 2011, http://www.dailytelegraph.com.au/business/our-disaster-prone-budget/story-e6frez7r1226032979031 Herweijer, C, Ranger, N and Ward, RET 2009, Adaptation to climate change: Threats and opportunities for the insurance industry, The Geneva Papers on Risk and Insurance, 34, 360-380. Holmes, JD, 1985 Wind loads and limit states design, Civ. Eng. Trans., IE Aust., CE27, 21-25. Holmes, JD 2002 A re-analysis of recorded extreme wind speeds in Region A, Australian Journal of Structural Engineering Vol 4 No. 1 (2002) 29-40 Holmes JD 2008, Impact of Climate Change on Design Wind Speeds in Cyclonic Regions, AHBCB, June 2008 Holmes, PR 1996, Building capacity for environmental management in Hong Kong, Water Resources Development, Vol. 12, pp 461-472. http://www.em.gov.au/Publications/Australianemergencymanualseries/Pages/default.as px [Accessed 17 May 2012]. Hudson, P 2011, ‘Julia Gillard Faces Battle on Levy Ahead of May 10 Budget’, Herald Sun, 28 January, p.5. Hughes, R & Mercer, D 2009, Planning to reduce risk: The wildfire management overlay in Victoria, Australia, Geographical Research, 47(2), 124-141. Hurl, R 2011, Temporary Local Planning Instrument 01/1 - Brisbane Interim Flood Response, paper presented at a Brisbane city council information evening, Brisbane, 20 June. Intergovernmental Panel on Climate Change (IPCC) 1995, IPCC Second Assessment Report, Viewed 18 July 2011, http://www.ipcc.ch/pdf/climate-changes-1995/ipcc-2ndassessment/2nd-assessment-en.pdf Intergovernmental Panel on Climate Change (IPCC) 2001, IPCC Third Assessment Report, Viewed 12 July 2011, http://www.grida.no/publications/other/ipcc_tar/?src=/climate/ipcc_tar/ IPCC, 2012: Managing the Risks of Extreme Events and Disasters to Advance Climate Change Adaptation. A Special Report of Working Groups I and II of the Intergovernmental Panel on Climate Change [Field, CB, V Barros, TF Stocker, D Qin, DJ Dokken, KL Ebi, MD Mastrandrea, KJ Mach, G-K. Plattner, SK Allen, M Tignor, and PM Midgley (eds.)]. Cambridge University Press, Cambridge, UK, and New York, NY, USA, 582 pp. ISDR 2008, Climate Change and Disaster Risk Reduction: weather, climate and climate change, Briefing Note 01. Geneva.
Planning,�building�and�insuring�����������259� �
Jacobs, K and Williams, S 2009, Natural Disaster Preparation and Response: Issues for State Housing Authorities, AHURI Final Report 131, Australian Housing and Urban Research Institution, Melbourne. Jaffee, D, Kunreuther, H & Michel-Kerjan, E 2010, Long-term property insurance, Journal of Insurance Regulation, 28(2), 167-187. James Cook University 2004, HI3280: Local History and Terrain Natural Resource Management, Conservation in the Mission Beach Area: Settlement to 1950, Cairns, QLD. James Cook University 2011, Centre for Disaster Studies (CDS), Townsville, QLD. Jayasinghe, NC 2012, The distribution of wind loads and vulnerability of metal clad roofing structures in contemporary Australian houses, PhD Thesis, James Cook University, Townsville. Jayasinghe, NC and Ginger, JD 2011, Vulnerability of Roofing Components to Wind Loads, Wind & Structures 14(4): 321-335. Johnston, D 2009, Draft Coastal Zone Management Plan – make an informed decision, Byron Shire Council, Media Release, Byron Bay. King, D & Cottrell, A 2009, (Editors) Communities Living with Hazards, Centre for Disaster Studies, James Cook University, Townsville. Klein RJT. & Nicholls, RJ 1999, Assessment of Coastal Vulnerability to Climate Change, Ambio, Vol. 28, pp 182-187. Klein, RJT, Nicholls, RJ, Ragoonaden, S, Capobianco, M, Aston, J & Buckley EN 2001, Technological Options for Adaptation to Climate Change in Coastal Zones, Journal of Coastal Research, Vol. 17, No. 3, pp 531-543. Kleindorfer, PR 2009, Climate Change and Insurance: Integrative Principles and Regulatory Risks, Working paper #2009-08-01, Risk Management and Decision Processes Center, The Wharton School, University of Pennsylvania, Philadelphia, USA. Kousky, C 2010, Managing the Risk of Natural Catastrophes: The role and functioning of state insurance programs, Resources for the Future: Washington DC. Kunreuther, H 2006, Disaster mitigation and insurance: Learning from Katrina, Annals of the American Academy of Political and Social Science, 604, 208-227. Kunreuther, H & Michel-Kerjan, E 2009, Managing Catastrophes through Insurance: Challenges and Opportunities for Reducing Future Risks, Working paper #2009-11-30, Risk Management and Decision Processes Center. The Wharton School, University of Pennsylvania, Philadelphia, USA. Kunreuther, H & Pauly, M 2004, Neglecting disaster: Why don’t people insure against large losses, The Journal of Risk and Uncertainty, 28(1), 5-21.
260����������Planning,�building�and�insuring� �
Kunreuther, H & Pauly, M 2009. Insuring Against Catastrophes, Working paper #200904-13, Risk Management and Decision Processes Centre. University of Pennsylvania, Philadelphia, USA. Kunreuther, H, Michel-Kerjan, E, Doherty, NA, Grace, MF, Klein, RW & Pauly, MV 2011, At War with the Weather: Managing Large-scale Risks in a New Era of Catastrophes, MIT Press, Cambridge, Massachusetts, USA. Lecomte, E & Gahagan, K 1998, Hurricane insurance protection in Florida. In: Kunreuther, H and Roth, RJ 1998 (Editors). Paying the Price: The Status and Role of Insurance Against Natural Disasters in the United States, Joseph Henry Press: Washington DC, USA. Leicester, R & Handmer, J 2008, Bushfire, In: Newton, P.W. 2008 (Editor). Transitions: Pathways to Sustainable Urban Development in Australia, Springer: Dordrecht, Holland. Leicester, RH & Reardon, GF 1976, A Statistical Analysis of the Structural Damage by Cyclone Tracy, The institution of Engineers Australia. Leicester, RH, L Pham, & PW Kleeman 1985, Use of reliability concepts in the conversion of codes to limit states design, Civ. Eng. Trans., IE Aust., CE27, 1-6. Leitch, C, Ginger, J, Harper, B, Kim, P, Jayasinghe, N & Somerville, L 2009, Performance of Housing in Brisbane Following Storms on 16 November 2008, James Cook University Cyclone Testing Station Technical Report TR55 Leonard, JE, Blanchi, R & Leicester, RH 2004, On the development of a risk-model for bushfire attack on housing, Risk 2004 National Conference, 7-10 November 2004, Melbourne, www.bushfirecrc.com/research/downloads/Risk2004-Jleonard.pdf Linnerooth, M & Mechler, R 2006, Insurance for assisting adaptation to climate change in developing countries: a proposed strategy, Climate Policy, Vol. 6, pp 621-636. Loh, E 2009, Victorian bushfires royal commission. Fire Update 31, 1-4. London, JB, Dyckman, CS, Allen JS, Wood, CC, Jackson, SR 2009, An assessment of Shoreline Management Options Along the South Carolina Coast, Office of Ocean and Coastal Resource Management, South Carolina Department of Health and Environmental Control Lucas, C, Hennesey, K, Mills, G & Bathols, J 2007, Bushfire Weather in Southeast Australia: Recent Trends and Projected Climate Change Impacts, CSIRO, Aspendale. Madill, A, Jordan, A & Shirley, C 2000, Objectivity and reliability in qualitative analysis: Realist, contextualist and radical constructionist epistemologies, British Journal of Psychology, Vol. 91, pp 1-20. Marshall, MN 1996, Sampling for Qualitative Research, Family Practice, vol. 13, no. 6. pp. 522-526.
Planning,�building�and�insuring�����������261� �
Marton, R and Phillips, SK 2005, Modernising policy for public value: Learning lessons from the management of bushfires, Australian Journal of Public Administration 64(1), 75-82. Maynard, T 2008, Climate change: impacts on insurers and how they can help with adaptation and mitigation, The Geneva Papers, 33, 140-146. McAneney, KJ 2005, Australian bushfire: Quantifying and pricing the risk to residential properties, Proceedings of the Symposium on Planning for Natural Hazards – How Can We Mitigate the Impacts? University of Wollongong, 2-5 February 2005, http://www.riskfrontiers.com/RFfrontimages/Fire_Wollongong.pdf McAneney, KJ, Chen, K & Pitman, A 2009, 100-years of Australian bushfire property losses: Is the risk significant and is it rising? Journal of Environmental Management 90, 2819-2822. McAneney, KJ, Chen, K, Crompton, R and Pitman, A 2007, Australian Bushfire Losses: Past, Present and Future, 4th International Wildland Fire Conference, Seville, 13-17 May 2005, http://www.riskfrontiers.com/publicationgraphics/Bushfire%20_Seville_final.pdf McBride, JL 2010, Climate change impacts on tropical cyclones: the current state of knowledge, 14th Australasian Wind Engineering Workshop, Geosciences Australia, Canberra. McConnell, A and Drennan, L 2006, Mission impossible? Planning and preparing for crisis, Journal of Contingencies and Crisis Management, 14(2), 59-70. McEntire, DA, Fuller, C, Johnston, CW & Weber, R 2002, A comparison of disaster paradigms: The search for a holistic policy guide, Public Administration Review, 62(3), 267-281. McGranahan, G, Balk, D & Anderson, B 2007, The rising tide: assessing the risks of climate change and human settlements in low elevation coastal zones, Journal of Environment and Urbanisation, Vol. 19, pp 17-37. McLennan, B and Handmer, J 2012, Reframing responsibility-sharing for bushfire risk management in Australia after Black Saturday, Environmental Hazards. 11(1), 1-15. Meecham, D, Surry, D, & Davenport, AG, 1991, The magnitude and distribution of wind-induced pressures on hip and gable roofs, Journal of Wind Eng. and Ind. Aerodynamics, 38, 15 Melchers, RE, 1985, Reliability calculation for structures, Civ. Eng. Trans., IE Aust.,. CE27, 124-129 Metz, B, Davidson, O, Martens, J, Van Rooijen, S, & Van Wie Mcgrory, L (Eds.) 2000, Methodological and Technological Issues in Technology Transfer. IPCC Special Report. Cambridge University Press, UK. pp 432 http://www.ipcc.ch/ipccreports/sres/tectran/index.php?idp=299
262����������Planning,�building�and�insuring� �
Michel-Kerjan, E & Kousky, C, 2010, Come rain or shine: Evidence on flood insurance purchases in Florida, The Journal of Risk and Insurance, 77(2), 369-397. Michel-Kerjan, E, Lemoyne de Forges, S and Kunreuther, H 2011, Policy tenure under the US National Flood Insurance Program (NFIP), Risk Analysis, http://onlinelibrary.wiley.com/doi/10.1111/j.1539-6924.2011.01671.x/full Middelmann, MH (Editor) 2007, Natural Hazards in Australia-Identifying Risk Analysis Requirements, Geoscience Australia, Canberra. Mileti, D 1999, Disasters by Design: A Reassessment of Natural Hazards in the United States, Joseph Henry Press, Washington DC, USA. Mills, E 2009a, From Risk to Opportunity: 2008 Insurer Responses to Climate Change, Ceres, Boston, Massachusetts, USA. Mills, E 2009b, A global review of insurance industry responses to climate change, The Geneva Papers, 34, 323-359. Morecroft MD 2012, Adapting conservation to a changing climate, Journal of Applied Ecology 2012, 49, 546 National Climate Change Centre 2011, An Extremely Wet End to 2010 Leads to Widespread Floods across Eastern Australia, Special Climate Statement 24, Melbourne, 17 January. NCC 2012, National Construction Code Series - Volume One - Building Code of Australia Class 2 to Class 9 Buildings; Volume Two - Building Code of Australia Class 1 and Class 10 Buildings, ABCB, Australian Government, Australia Nelson, V, Lamboll, R & Arendse, A 2008, Climate Change Adaptation, Adaptive Capacity and Development Discussion Paper, DSA-DFID Policy Forum. Nicholls, R J, Wong, PP, Burkett, V, Codignotto, J & Hay, J 2007, Coastal systems and low-lying areas, Faculty of Science – Papers, University of Wollongong. Nott, J, Smithers, S, Walsh, K & Rhodes, E 2009, Sand beach ridges record 6000 year history of extreme tropical cyclone activity in Northeastern Australia, Quaternary Science Reviews Vol. 28, pp 1511-1520. O’Brien, G and Read, P 2005, Future UK emergency management: new wine, old skin? Disaster Prevention and Management, 14(3), 353-361. O’Donnell, D 1989, A History of Clermont and District, Clermont Belyando Shire Council. Ou Yang, C 2010, Managing catastrophic risk by alternative risk transfer instruments, Penn Dissertations Paper 220, University of Pennsylvania, Pennsylvania, USA, http://repository.upenn.edu/edissertations/220
Planning,�building�and�insuring�����������263� �
Pearce, L 2003, Disaster management and community planning, and public participation: How to achieve sustainable hazard mitigation, Natural Hazards, 28, 211228. Pelling M 2011, Adaptation to Climate Change: From Resilience to Transformation, Routledge, Oxford Perry, RW and Lindell, MK 2003, Preparedness for emergency response: guidelines for the emergency planning process, Disasters 27(4), 336-50. Pew Center 2009, Climate Change 101: Understanding and Responding to Global Climate Change, Pew Center on Global Climate Change, Viewed 28 April 2001, www.pewclimate.org Pham, L, 1985, Load combinations and probabilistic load models for limit state codes, Civ. Eng. Trans., IE Aust., CE27, 62-67 Pham, L, JD Holmes, & RH Leicester, 1983 Safety indices for wind loading in Australia, Wind Eng. Ind. Aerodyn. , (1983) 14, 3-14 Pinelli, J-P, Simiu, E, Gurley, K, Subramanian, C, Zhang, L, Cope, A, Filliben, JJ and Hamid, S 2004, Hurricane Damage Prediction Model for Residential Structures, Journal of Structural Engineering 130(11): 1685-1691. Pitman, AJ, Narisma, GT and McAneney, J 2007, The impact of climate change on the risk of forest and grassland fires in Australia, Climatic Change, 84, 383-341. Pitt, M 2008, Learning Lessons from the 2007 Floods, HM Government, London, UK. Pittock, AB & Jones, RN 2000, Adaptation to what and why?, Environmental Monitoring and Assessment, Vol. 61, pp 9 – 35. PMSEIC Independent Working Group 2007, Climate Change in Australia: Regional Impacts and Adaptation – Managing the Risk for Australia, Report Prepared for the Prime Minister’s Science, Engineering and Innovation Council, Canberra, June. QFCI/Queensland Floods Commission of Inquiry 2012 Queensland Floods Commission Report: Final Report. Queensland Floods Commission of Inquiry, Brisbane. QRA/Queensland reconstruction Authority. 2011, Planning for a stronger, more resilient North Queensland: Part 1 Rebuilding in storm tide prone areas Part 2 Wind resistant housing, CTS, Australian Government BoM, Queensland Government. Quarantelli, EL 1992, Patterns of sheltering and housing in US disasters, Disaster Prevention and Management, 4(3), 43-53. Quarantelli, EL 1997, Ten criteria for evaluating the management of community disasters, Disasters, 21(1), 39-56.
264����������Planning,�building�and�insuring� �
Queensland Floods Commission of Inquiry 2011, Interim Report August 2011, Queensland Floods Commission of Inquiry, Brisbane, viewed 1 August 2011, http://www.floodcommission.qld.gov.au/data/assets/pdf-file/0006/8781/QFCI-InterimReport-Auguust-2011.pdf. Queensland Government 2006, Design Guidelines for Queensland Public Cyclone Shelters, Department of Public Works, Queensland Government Queensland Government 2011, Queensland Government, Brisbane, viewed 8 October 2011, http://www.qld.gov.au/floods/ Queensland Government Department of Community Safety 2003, State Planning Policy 1/03: Mitigating the Adverse Impacts of Flood, Bushfire and Landslide, Queensland Government, Brisbane. Queensland Government Department of Local Government and Planning 2009, SEQ Climate Change Management Plan 2009a, Queensland Government, Brisbane. Queensland Reconstruction Authority 2011, Planning for a stronger, more resilient North Queensland - Part 1: Rebuilding in storm tide prone areas: Tully Heads and Hull Heads, Queensland Government, Australia. Queensland Coastal Plan 2012, Environment Planning. Department of Environment and Resource Management, State of Queensland (Department of Environment and Resource Management) Queensland-Home-Building-Code 1981, Queensland-Home-Building-Code Appendix 4, Queensland Government, Australia. Ramsay, GC & Rudolph, L 2003, Landscape and Building Design for Bushfire Prone Areas, CSIRO, Melbourne. Reardon, GF, Walker, GR & Jancauskas, ED 1986, Effects of Cyclone Winifred on Buildings TR27, Cyclone Testing Station. James Cook University, Townsville. Reser, JP, Pidgeon, N, Spence, A, Bradley, GL, Glendon, AI & Ellul, MC 2011, Public Risk Perceptions, Understandings, and Responses to Climate Change in Australia and Great Britain: Interim Report, National Climate Change Adaptation Research Facility, Gold Coast, 84pp. Ribot, JC, Magalhaes, AR & Panagides, SS (eds). 1996, Climate variability, climate change and social vulnerability in the semi-arid Tropics, Cambridge University Press, Cambridge. Rosowsky, DV and Ellingwood, BR 2002, Performance-Based Engineering of Wood Frame Housing: Fragility Analysis Methodology. Journal of Structural Engineering 128(1): 32-38. Sato, M and Seki, M 2010, Sustainable business, sustainable planet: A Japanese insurance perspective, The Geneva Papers, 35, 325-335.
Planning,�building�and�insuring�����������265� �
Schauble, J 2004, The Australian Bushfire Safety Guide: The essential survival guide for every home, Harper Collins, Pymble. Seale, C (ed.) 2004, Researching Society and Culture, 2nd edn, Sage Publications, London. Seneviratne, SI, N Nicholls, D Easterling, CM Goodess, S Kanae, J Kossin, Y Luo, J Marengo, K McInnes, M Rahimi, M Reichstein, A Sorteberg, C Vera, & X Zhang, 2012, Changes in climate extremes and their impacts on the natural physical environment. In: Managing the Risks of Extreme Events and Disasters to Advance Climate Change Adaptation [Field, CB, V Barros, TF Stocker, D Qin, DJ Dokken, KL Ebi, MD Mastrandrea, KJ Mach, G-K. Plattner, SK Allen, M Tignor, & PM Midgley (eds.)]. A Special Report of Working Groups I and II of the Intergovernmental Panel on Climate Change (IPCC). Cambridge University Press, Cambridge, UK, and New York, NY, USA, pp. 109-230. SEQ Water 2011, January 2011 Flood Event Report on the Operation of Somerset and Wivenhoe Dam, 2 March 2011, p. iv. Smit B, I Burton, RJT Klien, & R Street 1999, The Science of Adaptation: A Framework for Assessment, Mitigation and Adaptation Strategies for Global Change 4: 199–213, 1999 http://www.uq.edu.au/u21/docs/papers/C%20Change%20Asees%20Framework%2019 99%20Smit%20et%20al.pdf Smit, B & Wandel, J 2006, Adaptation, adaptive capacity and vulnerability, Global Environmental Change, Vol. 16, pp 282-292. Smith, DE & Handmer, J (eds) 2002, Residential Flood Insurance – The Implications for Floodplain Management Policy, The Water Research Foundation of Australia, Canberra, ACT. Smolka, A 2006, Natural disasters and the challenge of extreme events: Risk management from an insurance perspective. Philosophical Transactions of the Royal Society A, 364, 2147-2165. Stake R 1995, The art of case study research, Sage publications, London Stevens, M, Song, Y & Berke, P 2010, New Urbanist developments in flood-prone areas: safe development, or safe development paradox? Nat Hazards (2010) 53:605– 629 Stewart, MG. & Wang, X 2011, Risk Assessment of Climate Adaptation Strategies for Extreme Wind Events in Queensland, Published by CSIRO, Canberra, May 2011. ISBN 978 0 643 10431 0 Sustainable Planning Act 2009, Sustainable Planning Act 2009 No. 36 of 2009, Queensland State Government, Brisbane
266����������Planning,�building�and�insuring� �
Talberth, J, Berrens, RP, McKee, M & Jones, M 2006, Averting and insurance decisions in the wildland-urban interface: implications of survey and experimental data for wildfire risk reduction policy, Contemporary Economic Policy, 24(2), 203–223. Tan, Z & Midgeley, S 2009, A stochastic model for assessing bush fire attack on the buildings in bush fire prone areas, 18th World IMACS/MODSIM Congress, 13-17 July 2009, Cairns. Teague, B, McLeod, R & Pascoe, S 2009, Victorian Bushfire Royal Commission: Interim Report, Parliament of Victoria, Melbourne. Teague, B, McLeod, R & Pascoe, S 2010, Victorian Bushfire Royal Commission: Final Report, Parliament of Victoria, Melbourne. TFS 2005, Guidelines for development in bushfire prone areas in Tasmania, Tasmanian Fire Service, Hobart. The Australian Government Treasury 2011, National Disaster Insurance Review: Inquiry into Flood Insurance and Related Matters, Commonwealth of Australia, ACT. Thomas, M, King, D, Keogh, DU, Apan, A & Mushtaq, S 2011, Resilience to climate change impacts: A review of flood mitigation policy in Queensland, Australia, Australian Journal of Emergency Management 26(1), 8-17. Tibbitts, A, & Whittaker, J 2007, Stay and defend or leave early: policy problems and experiences during the 2003 Victorian bushfires, Environmental Hazards 7, 283-90. Tierney, K 2008, Hurricane Katrina: catastrophic impacts and alarming lessons, In: Quigley, J.M. & Rosenthal L.A. (Eds) Risking House and Home: Disasters, Cities, Public Policy, Berkeley Public Policy Press, Berkeley CA, USA: 119–136. Titus, JG 1991 Greenhouse Effect and Coastal Wetland Policy: How Americans Could Abandon An Area The Size of Massachusetts at Minimum Cost, Environmental Management Vol 15 (1) pp39 - 58 Tol, RSJ, Fankhauser, S & Smith, JB 1998, The scope for adaptation to climate change: what can we learn from the impact literature?, Global Environmental Change, Vol. 8, No. 2, pp 109-123. Tol, RSJ., Klein, RJT. & Nicholls, RJ 2008, Towards Successful Adaptation to SeaLevel Rise along Europe’s Coasts, Journal of Coastal Research, Vol. 24, No. 2, pp 432-442. Tolhurst, KG, Chong, DM & Strandgard, MN 2006, Wildfire risk management model for strategic management, Forest Ecology and Management 234S, S211. Tolhurst, KG, Shields, B & Chong, D 2008, Phoenix: Development and application of a bushfire risk management tool, Australian Journal of Emergency Management 23(4), 47Ǧ54. U. S. EPA 2009, Synthesis of Adaptation Options for Coastal Areas, Washington D.C. U.S. Environmental Protection Agency, Climate Ready Estuaries Program. Planning,�building�and�insuring�����������267� �
Unanwa, CO, McDonald, JR, Mehta, KC & Smith, DA 2000, The development of wind damage bands for buildings, Journal of Wind Engineering and Industrial Aerodynamics 84(1): 119-149. Victorian Bushfires Royal Commission 2010, Final Report of the 2009 Victorian Bushfires Royal Commission, Parliament of Victoria. Walker, G 2003, Pricing catastrophe risk. In: Britton, N.R. 2003 (Editor) Catastrophe Risks and Insurability, Proceedings of conference sponsored by Aon Re Australia Ltd, Gold Coast. (Queensland Climate Change and Community Vulnerability to Tropical Cyclones – Cyclone Hazards Assessment with: Queensland State Government’s Department of Natural Resources and Mines and the Department of Emergency Services, 2003, Cyclone Testing Station in association with Systems Engineering Australia, TS 582. See reference to Walker (2003). Walker, GR 1975, Report on Cyclone Tracy-Effect on buildings- Dec 1974, Australian Dept of Housing and Construction Walker, GR 1995, Wind Vulnerability curves for Queensland houses, Alexander Howden Reinsurance Brokers (Australia) Ltd.,Sydney. Walker, GR 2011, Modelling the vulnerability of buildings to wind — a review, Canadian Journal of Civil Engineering 38(8): 1031-1039. Wall, M 2006, The case study method and management learning: making the most of a strong story telling tradition in emergency services management education, Australian Journal of Emergency Management 21(2), 11-16. Walsh, KJE, Betts, H, Church, J, Pittock, AB, McInnes, KL, Jackett, DR & McDougall, TJ 2004, Using Sea Level Rise Projections for Urban Planning in Australia, Journal of Coastal Research, Vol. 20 (2), pp 586-598. Walsham G 1993, Interpreting Information Systems in Organizations, Wiley, Chichester. Warner, K, Ranger, N, Surminski, S, Arnold, M, Linnerooth-Bayer, J, Michel-Kerjan, E, Kovacs, P & Herweijer, C 2009, Adaptation to Climate Change: Linking Disaster Risk Reduction and Insurance, United Nations International Strategy for Disaster Reduction Secretariat, Geneva, Switzerland. Warner, K, Zissener, M, Kreft, S, Höppe, P, Bals, C, Linnerooth-Bayer, J, Haas, A., Gurenko, E, Loster, T & Burton, I 2010, Solutions for Vulnerable Countries and People: Designing and Implementing Disaster Risk Reduction and Insurance for Adaptation, United Nations University, Institute for Environment and Human Society, Bonn, Germany. Wehner, M, Sandland, C, Holmes, JD, Kim, P, Jayasinghe, NC & Edwards, M 2010, Development of a software tool for quantitative assessment of the vulnerability of Australian residential building stock to severe wind, 14th Australasian Wind Engineering Workshop, Geosciences Australia, Canberra.
268����������Planning,�building�and�insuring� �
White, CJ, Sanabria, LA, Grose, MR, Corney, SP, Bennett, JB, Holz, GK, McInnes, KL, Cechet, RP, Gaynor, SM & Bindoff, NL 2010, Climate Futures for Tasmania: Extreme Events Technical Report, Antarctic Climate and Ecosystems Cooperative Research Centre, University of Tasmania, Hobart. Whittaker, J, Handmer, J & Mercer, D 2012, Vulnerability to bushfires in rural Australia: A case study from East Gippsland, Journal of Rural Studies, 28(2), 161-173. Wilkins, M 2010, The need for a multi-level approach to climate change – an Australian insurance perspective, The Geneva Papers on Risk and Insurance, 35(2), 336-348. Williams, AJ, Karoly, DJ & Tapper, N 2001, The sensitivity of Australian fire danger to climate change, Climatic Change, 49, 171-191. Williams, S and Jacobs, K 2011, Introduction: Disaster, housing, actuarialism and the securitization of risk, Housing Studies, 26(2), 185-195. Williams, S, Jacobs, K, Newman, P & Blakeley, EJ 2009, Disaster Preparation and Response: A Guide for State Housing Authorities, AHURI Positioning Paper No. 113. Australian Housing and Urban Research Institution, Melbourne. Wills, I 2006, Economics and the Environment, 2nd edn, Allen and Unwin, Sydney. Winkworth, G, Healy, C, Woodward, M & Camilleri, P 2009, Community capacity building: Learning from the Canberra Bushfires, Australian Journal of Emergency Management 24(2), 5-12. Yin, R 2003, Case Study Research: Design and Methods. Sage, Thousand Oaks, California, USA. Young, M 2009, Analyzing the effects of the MY Safe Florida Home Program on Florida Insurance Risk – RMW Special Report, PDF file located at: http://www.rms.com/publications/rms_msfh_report_may_2009.pdf Your home n.d. Australia’s climate zones technical manual: Design for lifestyle and the future, Commonwealth of Australia, http://www.yourhome.gov.au/technical/fs10.html
Planning,�building�and�insuring�����������269� �
10. APPENDICES – 10.1 Project Workshop: NCCARF Climate Change Adaptation Research Grants Program - Adaptation of Built Environment to Climate Change Induced Increased Intensity of Natural Hazards
(Photo: Marianne Jago-Bassingthwaighte) L-R Name, David Henderson, Nandana (Chana) Jayasinghe (off-camera), Peter Kim, Trish Davis, Lindsay Groat, Mark Edwards, Steward Williams
270����������Planning,�building�and�insuring� �
(Photo: Marianne Jago-Bassingthwaighte) Cam Leitch, Yetta Gurtner, Alison Cottrell, David King Attendance Stakeholders: Lindsay Groat (Executive Manager - Technical Services, Townsville City Council), Mark Edwards (GeoScience Australia), Trish Davis (Coordinator Asset Planning and Development, Housing Tasmania), Robert Preston (Project Manager, Policy & Legislative Reform Branch, Strategic Policy Division, Department of Community Safety) NCCARF: David George CDS: David King, Alison Cottrell, Yetta Gurtner, Marianne Jago-Bassingthwaighte, (Adjunct research fellow) CTS: John Ginger, David Henderson, Cam Leitch, Nandana (Chana) Jayasinghe, Peter Kim UTas: Stewart Williams Apologies: Dr Linda Anderson-Berry, Manager, Disaster Mitigation Policy and Emergency Management Coordination Weather and Ocean Services Policy Branch, Bureau of Meteorology Mark Chladil, Fire Management Planning Officer, Tasmania Fire Service, Professor Keith Jacobs, HACRU, UTas
Planning,�building�and�insuring�����������271� �
A.
SOME MAIN POINTS FROM WORKSHOP
This is a brief summary of the main points and associated discussions/comments for each section of the workshop. (i) Project Overview Presentation by David King Want feedback from the Stakeholders Stakeholders to give input on how to get parts of study out to industry Hazards - Drought excluded Link practice to policy Insurance as an under-utilised regulatory mechanism (encourages "Bad" planning) (ii) CDS Lit Review – Presentation by Yetta Gurtner Flood - Water where it is not wanted Flash Flooding (Short duration, high discharge, dangerous) - a gap in planning Planning policy is driven by Federal regulations, States have regulatory power (State Planning Acts), Local governments implement Roles and responsibilities unclear and co-ordination is limited. Capacity and resources at Local Level are limited and there are legal liability issues for Local Governments. Risk mapping needed for floods (need data) If development approved (i.e. existing) - cannot apply retrospective conditions Adaptation Strategies - Two of Do Nothing (Reactive) or Planned (Proactive) Structural mitigation is normal response Query from David George: Any economic studies? Yetta: Not really, but try to integrate financial? Question topics: x
Examination of storm surge and flooding.
x
Devaluation of property.
x
Integration of economics and planning.
x
The issue of compensation or acquisition.
x
Involvement of or discussion with lawyers.
272����������Planning,�building�and�insuring� �
Discussion on planning issues: x
Definition of the urban footprint and its use as a mitigation tool.
x
The option to avoid intensification of the urban area.
x
Did this study consider bushfire? This raised the importance of making a link in terms of hazard zones i.e. flood or bushfire vulnerable zones are addressed in similar ways by planning legislation.
x
There is a trade-off between building codes and planning decisions i.e. don’t use building codes to justify development in vulnerable areas.
x
Community resilience needs to be examined in relation to buildings – codes and land uses.
x
The issue of the Q100 flood level was discussed; there are new zones and it was further suggested that this may also suggest a surge and wind
x
Also a number of questions about legal liability in relation to the Planning Act.
David King’s Comment: Planning gives security of tenure - cannot retrospectively acquire or force change once approved. (iii) CTS Lit Review – Presentation by John Ginger Wind climate is probabilistic Design wind data for four regions in Aust, Regions A, B (Non-cyclonic), C and D (Cyclonic) have values set based on Bureau of Meteorology records (Gumbel Distribution) Future Design Wind Speeds: Climate Change (Opposing effects of IPPC Predictions: increased intensity but likely reduce frequency. Therefore maybe NO change to risk? Robert’s Comment: Risk Frontiers did a risk map around Brisbane Discussion on Planning Issue versus Building Issue: How can costs and benefits for different issues (Hazards) be balanced? Robert Preston’s Queries: x
How should costs caused by older housing that does not comply with current standards (i.e. older housing is not as strong as contemporary housing and more likely to fail) be balanced in the community?
x
Floods seem to have a greater risk (100 years return period) compared to wind (500 years). Therefore question wisdom of accepting this higher risk for floods than for wind?
Planning,�building�and�insuring�����������273� �
x
What is best addressed by planning rather than building? Should make early Planning decision (e.g. Not go ahead because of risk) rather than build stronger.
Mark Edwards’ Comment: I think that the BCA addresses life safety but considers floods from strength and suitability of material affecting stability of building and hence life safety Lindsay Groat’s Comment: The TCC is undertaking Constraints Mapping to cover flooding, landslip and fire risks. This feeds into Land Use planning. Robert Preston’s Comment: For high risk areas should not stop development but at least “Slow it down”. For flood should have three flood zones. Comment on Insurance Costs: It appears that the cost of insurance for winds (with a 500 year return period) is less than the cost of insurance for flooding using a 100 year flood design value. Issues raised in Questions: x
losses to non cyclonic and cyclonic designed houses.
x
Implementation of Bushfire housing standards since the 1990s.
x
Building construction modifications. Issue of retrofitting houses, economic liability and when to retrofit.
x
Exposure to multiple hazards.
x
How to balance costs and benefits. Costs to the community other than just house/household costs.
x
It was noted that building codes include building materials, as does retrofitting ie materials were more wind or water safe.
x
Can older houses be retrofitted adequately? This may be an area for further research
(iv) UTas Lit Review – Presentation by Stewart Williams Bushfires need a community response Insurance is used in recovery process, but not at start of process for adaptation Householders tend to be underinsured Research Question: What are the role of insurance in risk mitigation and its possible future roles in climate change adaptation? 274����������Planning,�building�and�insuring� �
x
What is the role of insurance in mitigation?
x
For insurance and climate change adaptation the emphasis is on industry/government.
Discussion Mark Edwards’ Comment: Remember if try to get incentives for insurers to offer discounts if we adapt but the insurers need to go back to the re-insurers. Alison Cottrell’s Comments: x Lloyds does not insure at Cungalla (beachside area near Townsville) x Issue of “Moral Hazard”: Government gives “Handout” to people without insurance. x Who were the house insurers? (v) CDS Case Studies on Planning – Presentation by Alison Cottrell Focus on Qld Live in an uncertain environment, climate change adds more uncertainty Looked at flood areas in Bris and cyclone and surge impact at Mission Beach (David King looked at Grantham, he will report separately) Adaptation has three choices: Protect, Accommodate or Retreat (4th one of “Do Nothing” not considered) Protect example –build levee banks. Did this for airport near Cairns, but put nearby Machan’s Beach at more risk Accommodate example – raise house (floor height above flood level). Have a problem if capacity of protective structure is exceeded Retreat: Land use and planning: do not build in high risk areas. Problem is that people have an attachment to the area, so people opt for protection rather than retreat (va) CDS Case Study on Grantham – Brief Presentation by David King Grantham has been suggested as a model for adapting (whereby a township is moved, from flood risk in this example) In Lockyer Valley, 19 people killed: Qld Reconstruction Authority (QRA) said re-location In Hull Heads/Tully Heads/Mission Beach, no-one killed (but risk is more severe): QRA helped develop guidelines to re-build
Planning,�building�and�insuring�����������275� �
Why were Tully heads residents encouraged to re-build and Grantham residents encouraged to move? Appears that the Public has a Zero Tolerance for deaths in hazards Problems: In Grantham – QRA has over-ridden existing town plan by allowing urban footprint to expand beyond the planning boundary. State planning policy is flawed because the QRA overrode normal planning. Once Lockyer Valley council has to “re-absorb” this special case back into sustainable development plan, there will be a conflict. Problem is that excess land put aside for this case is not needed and so may be used for future development, but does not fit the Sustainable Planning Act development scheme. (vi) CTS Case Studies on Building – Presentation by David Henderson Do standards actually work? Damage surveys give only one point on the damage curve However, Larry, Brisbane Storms and Yasi damage surveys show that current standards (for Post 80s housing) are working. All of these events had less than the current design wind speed. CTS working with GeoScience Aust (GA) and are developing an engineering mathematical model for various house types to predict level of damage with increasing wind speed. Model used on older Pre-1980s house shows that can get an improvement in strength (i.e. more resilient) if retrofit stronger connections to roof. Models also show that if can protect the openings (e.g. Fit debris resistant screens to house to minimize risk of full internal pressure), get a reduction in amount of damage. For non-cyclonic areas (Wind Region B), housing is not designed for the worst case of full internal pressure and so does not have same reserve as that in cyclonic regions as cyclonic regions Beneficial effect of protecting the openings also applies for houses in noncyclonic areas. This is a good option to consider as providing both an improvement in the resilience to the current climate and as an adaptation response to potential wind speed increases due to climate change. (vii) UTas Case Study on Insurance– Presentation by Stewart Williams Findings reported as nineteen recommendations under five sections, for example: Insurance primarily for recovery, not preparedness 276����������Planning,�building�and�insuring� �
Inconsistencies in governance amongst agencies (e.g. to reduce fire load, want to remove fuel and cut down trees, but not allowed to because of regulations to prevent this). x
Insurance has little impact in encouraging climate change adaptation.
x
Insurance probably does not increase community resilience.
x
What is the public and private interaction?
x
Insurance aids recovery not preparedness or adaptation, but insurance may be used as a tool to drive adaptation.
x
What is the best management practice for insurance at the household/community level?
x
There is a need for consistency of information and communication about insurance
Discussion: Alison Cottrell’s Comment: Re-insurers set limits/standards on what is insured and levels of risk. There is a “Tension” between Community Good and unfettered marketplace. Other Comments: x
Insurance transfers risk from householder to (insurance) company
x
Does insurance improve community resilience?
x
Insurance helps with recovery but not adaptation.
x
Moral hazard??
Planning,�building�and�insuring�����������277� �
B. COMMENTS AND FEEDBACK FROM STAKEHOLDERS (i) Comments from David George (NCCARF) GENERAL Adhere to Contract Policy makers want to use results, so squeeze out results from the research Consider Cost Benefits Report in by end of May (Three Final sections from each group) Final report put together (with Synthesis of all three sections by end of June) For CTS (Building) Include some basic costings, esp. for upgrade for Pre80s housing For UTas (Insurance) Suggest break Recommendations into: Households Govt Insurers (ii) Comments from Stakeholders x
Mark Edwards advised he had made comments during the day
x
Trish Davis advised a risk map would be useful, particularly for Fire
Resource from David George 1. Development and analysis of Climate Sensitivity and Climate Adaptation opportunities indices for buildings Original Research Article Building and Environment, Volume 55, September 2012, Pages 141-149 Christopher R. Pyke, Sean McMahon, Larissa Larsen, Nicholas B. Rajkovich, Adam Rohloff 2.3.1.1 Highlights - Illustrate connections between green building and climate change resilience. Ź Demonstrate a climate impacts and adaptation screening system for buildings. Ź Create new metrics based on widely used LEED prerequisites and credits. Ź Adapting the LEED weighting framework to incorporate climate change adaptation.
Note: Stakeholders then left the workshop and research participants stayed on to discuss tasks to be completed and the final report as a Research Group Debrief.
278����������Planning,�building�and�insuring� �
RESEARCH GROUP DE-BRIEF 1. TASKS x
Review Contract to check the actual deliverables (need to make sure Final Report meets the contractual requirements). Do this ASAP.
x
Finalise budget expenditure by mid May 2012 (Project books have to be closed by end of June 2012, but need to allow for processing of finances.)
2. INDIVIDUAL CONTRIBUTIONS TO REPORT Four main sections: Literature Review Methodology Case Study Recommendations Notes for Individual Sections Follow the Style Guide from NCCARF Use Harvard referencing
3. MAIN REPORT (CDS to put together) Format Agreed (as per Meeting Notes 3 April 2012) x
Executive Summary
x
Intro to the Project (Write last, but need to ensure that meets Project brief)
x
Literature Reviews (Intro, then for the three centres, Plan, Build, Insure, then conclusion & synthesis of themes)
x
Methods – sections from each sub-project – stressing mixed method approach.
x
Case Studies (& discussion) in order of Plan, Build, Insure
x
Synthesis and discussion, findings and themes of projects (CDS to do, with input/assistance from each group) – focussing on adaptation
x
Recommendations – largely to be incorporated into best/good practice guides
x
References
x
Appendices – which may include best/good practice guides to industry/policy makers. Planning,�building�and�insuring�����������279� �
At the meeting, the group agreed that the synthesis should include a guide to "Good" practice, as the contract schedule specifies that “A monograph will integrate all three study areas into a best practice guide that will be designed for publication on the internet through the Centres’ websites” Final Wrap up Challenge to summarise each sub-project in a phrase: Planning – change - to practice and legislation Building – extension - of the cyclone zone Insurance –build better – facilitate through insurance
280����������Planning,�building�and�insuring� �
Planning Case Study 1. Storm Surge Adaptation Survey Questionnaire 1. How long have you lived at this address? o 2. If you have lived here for less than a year, do you know the reason for the previous owner/tenants vacating the premises? o 3. In your opinion where you adversely affected by storm surges associated with either Tropical Cyclone Larry in 2006 and/or Yasi earlier this year? o Yes o No 4. If you answered “Yes” to Question 2, in what way were you affected? (you can circle more than one) o
Inundation
o
Loss of Income
o
Temporary Evacuation
o
Beach Sand Displacement
o
Property Erosion
o
Insurance Implications
o
Household Structural Damage
o
Property Devaluation
o
Motor Vehicle Damage
o
Household Contents Damage
o
Other:
5. Why did you/your family decide to move to the Mission Beach area? o
Employment
o
Retirement
o
Coastal Scenery/Lifestyle
o
Other – Please specify:
6. Prior to residing in the Mission Beach area, were you aware of the dangers that storms/cyclones posed, in particular, storm surges and coastal erosion? o
Yes
o
No
7. How do you feel about the following statement? “Storm Surge events, produced during Tropical Storms and Cyclones pose a significant threat to the livelihoods of coastal residents through property destruction, loss of income and potential loss of life.” o
Strongly Disagree Planning,�building�and�insuring�����������281� �
o
Somewhat Disagree
o
No Strong Opinion
o
Somewhat Agree
o
Strongly Agree
8. Did you consider the implications of storm surge and coastal erosion prior to renting/buying your esplanade property? o
Yes
o
No
9. Prior to tropical cyclone Larry/Yasi where you aware that surges, under the right conditions can easily exceed high tide and king tide indicators? o
Yes
o
No
10. Did storm surges experienced during tropical cyclone Yasi alter you or your family’s opinion on you coastal lifestyle? o
Yes
o
No
o
If “Yes”, in what way?
11. Having experienced the destructive power of a major coastal hazard, given your time over would you still choose to live in the Mission Beach area? o
Yes
o
No
12. Do you now consider storm surge events to be a significant threat to your livelihood, knowing that climate change will bring increases in both intensity and occurrence of this phenomenon? o
Yes
o
No
13. Do you believe there will be another major storm surge event within the next 10 – 20 years? o
Yes
o
No
14. How do you feel about the following statement? “Community adaptation is an appropriate and highly necessary step in reducing the adverse affects on a coastal community, thus reducing the vulnerability of residents.” o
Strongly Disagree
o
Somewhat Disagree
o
No Strong Opinion
282����������Planning,�building�and�insuring� �
o
Somewhat Agree
o
Strongly Agree
15. What things do you think could be done to make your property safer from storm surges? o o o o 16. There are a number of things residents can do to reduce or negate the impact of storm surges on their property. How important do you think these things are? A) Property Height Very
Important
Uncertain
Important Raising
Not very
Not at all
Important
Important
o
o
o
o
o
o
o
o
o
o
o
o
o
o
o
o
o
o
o
o
Household height Higher new house slabs Placing meter box higher Main living on second floor Which of these are you likely to do?
Structural Strengthening Very
Important
Uncertain
Important
Not very
Not at all
Important
Important
Stronger Walls
o
o
o
o
o
Storm surge
o
o
o
o
o
Well drained yard
o
o
o
o
o
Water sealable
o
o
o
o
o
barriers (fences)
doors/windows
Planning,�building�and�insuring�����������283� �
Anchor objects to
o
o
o
o
o
the ground Which of these are you likely to do?
B) Avoidance Very
Important Uncertain
Important Build further back
Not very
Not at all
Important
Important
o
o
o
o
o
o
o
o
o
o
o
o
o
o
o
o
o
o
o
o
from the coast Retreat development from coast Property buy-back schemes Sell property and vacate the area Which of these are you likely to do?
1. There are lots of things Planners, Cassowary Coast Regional Council and Emergency Managers suggest as strategies to reduce the impact of storm surges. How important do you think these are? A) Planning Very
Important Uncertain
Important Coastal building
Not very
Not at all
Important
Important
o
o
o
o
o
o
o
o
o
o
o
o
o
o
o
restrictions No building in low lying areas Building with regards to
284����������Planning,�building�and�insuring� �
increasingly frequent storm events Changes to land
o
o
o
o
o
use zoning laws B) Structures Very
Important Uncertain
Important Storm Surge
Not very
Not at all
Important
Important
o
o
o
o
o
Sea Walls
o
o
o
o
o
Limiting coastal
o
o
o
o
o
o
o
o
o
o
o
o
o
o
o
Levee Banks
o
o
o
o
o
Drainage
o
o
o
o
o
Barriers
infrastructure Sand replenishment Coastal vegetation plantation (minimising erosion)
infrastructure C) Council & Emergency Management Very
Important Uncertain
Important
Not very
Not at all
Important
Important
Property Buy-backs
o
o
o
o
o
Vulnerability
o
o
o
o
o
o
o
o
o
o
o
o
o
o
o
o
o
o
o
o
maps/layouts Flood evacuation centres Education and awareness campaigns Increased communications
Planning,�building�and�insuring�����������285� �
and warnings Individual
o
o
o
o
o
o
o
o
o
o
responsibility and awareness Emergency evacuation plans 18. Do you believe the social benefit of living directly adjacent to the coastline outweighs the negative effects of tropical storms and cyclones? o
Yes
o
No
19. IF given the opportunity to relocate would you do so based on your recent experience with intense coastal hazards? o
Yes
o
No
20. If local and state governments approached you with a reasonable property buy back scheme what would be your level of interest? o
Not Interested
o
No strong Opinion
o
Somewhat Interested
o
Strongly Interested
21. In the near future are you likely to relocate in order to decrease or negate you or your family’s vulnerability to coastal hazards like storm surge? o
Yes
o
No
22. Do you believe the construction of infrastructure such as storm surge barriers, sea walls, increased drainage and the plantation of extensive coastal vegetation will alter your enjoyment of your beach lifestyle? o
Yes
o
No
23. Which of the following do you believe best represents what a 1 in 100 year storm event is (e.g Category 5 cyclone)? o
That a storm/cyclone event of this magnitude will only occur once every 100 years.
o
That there is a 1 percent chance of a storm/cyclone of this magnitude occurring every year.
24. Do you believe climate change will have an effect on your coastal lifestyle? o
Yes
286����������Planning,�building�and�insuring� �
o
No
o
Don’t know
25. To what degree are you concerned about Climate Change, especially living so close to a North Queensland coastline? o
Not Concerned
o
Slightly Concerned
o
No Strong Opinion
o
Relatively Concerned
o
Extremely Concerned
26. Do you believe your financial situation will restrict your ability to prepare your property to future storm surge events? o
Yes
o
No
27. Do you have building insurance or Home and Contents Insurance? o
Yes
o
No
28. Have the recent surges made you consider changing your insurance options? o
Yes
o
No
29. Number of Household Members (Please Circle): o
1
o
2
o
3
o
4
o
5
o
6
o
7
o
8+
30. What is your sex? o
Male
o
Female
31. What is your age group? o
18–30
o
31–40
o
41–50
o
51–60 Planning,�building�and�insuring�����������287� �
o
61–70
o
71–80
o
81+
32. Do you rent, own or currently have a mortgage on your home? o
Rent
o
Own
o
Mortgage
o
Share Accommodation
288����������Planning,�building�and�insuring� �
Planning Case Study 2. Strategies for Reducing Flood Impacts in Brisbane. Household Questionnaire. 1. Were you impacted by the recent flood event? o Yes o No In what way were you affected? o 2. Do you rent, own or have a mortgage on your house? o Rent o Own o Mortgage 3. Will you be staying or leaving your current residence as a result of the recent flood event? o Staying o Leaving o Leaving for other reasons 4. If leaving, will you be moving within Brisbane or going elsewhere? o Brisbane o Elsewhere 5. Do you have building insurance? o Yes o No 6. Do you have contents insurance? o Yes o No 7. If you have building insurance, are you covered for riverine flood? o Yes o No o Don’t know 8. If no, would you consider taking out flood insurance? o Yes o No 9. What are 3 things you think could be done to make your home safer from floods? o o o 10. What is the most likely thing you would do? o 11. Strengthening
Stronger walls
Very Important
Important
Uncertain
Not very Important
Not at all Important
o
o
o
o
o
Planning,�building�and�insuring�����������289� �
Have a well drained garden
o
o
o
o
o
Floodproofing windows and doors
o
o
o
o
o
Anchor water tanks to the ground
o
o
o
o
o
Flood barriers
o
o
o
o
o
o 12.
Other options Avoidance Very Important
Important
Uncertain
Not very Important
Not at all Important
Build farther back from the river
o
o
o
o
o
Slope land away from the house
o
o
o
o
o
Spaces between houses for water runoff
o
o
o
o
o
o 13. o o
Other options Would you be likely to make any of the above changes to your residence? Yes No
290����������Planning,�building�and�insuring� �
If yes, why, and which ones? If no, why not? o 14. There are a number of things Planners, the Building Council of Australia, the Brisbane City Council and Emergency Managers, business and the community suggest as strategies to reduce the impact of floods. How important do you think these are? Very Important
Important
Uncertain
Not very Important
Not at all Important
Not building near the ocean
o
o
o
o
o
Not building in flood prone areas
o
o
o
o
o
Building above the 1 in 100 year flood level
o
o
o
o
o
Changes to land use zoning laws
o
o
o
o
o
Spaces between houses for water runoff
o
o
o
o
o
Denser population settlement in flood free areas
o
o
o
o
o
Upstairs flood proof rooms
o
o
o
o
o
Important
Uncertain
Not very Important
Not at all Important
o 15.
Other options Structures Very Important
Planning,�building�and�insuring�����������291� �
More dams
o
o
o
o
o
Levee banks
o
o
o
o
o
Limiting infrastructure on the river
o
o
o
o
o
More storm water drains
o
o
o
o
o
Flood gates
o
o
o
o
o
More urban drainage lines
o
o
o
o
o
Collection reservoirs
o
o
o
o
o
o 16.
Other options Brisbane City Council Very Important
Important
Uncertain
Not very Important
Not at all Important
Build 0.5m higher
o
o
o
o
o
Buyback of vulnerable houses
o
o
o
o
o
Flood proofing
o
o
o
o
o
292����������Planning,�building�and�insuring� �
access roads
Make flood maps better known
o
o
o
o
o
Flood evacuation centre
o
o
o
o
o
Better communication about warnings
o
o
o
o
o
Contingency funds
o
o
o
o
o
Better hazard and risk maps
o
o
o
o
o
Awareness campaigns at the start of the wet season
o
o
o
o
o
o 17.
Other options Emergency managers, business and the community Very Important
Important
Uncertain
Not very Important
Not at all Important
Community emergency evacuation plans
o
o
o
o
o
Neighbourhood flood
o
o
o
o
o
Planning,�building�and�insuring�����������293� �
committees
Insurance liability changes
o
o
o
o
o
More use of social media
o
o
o
o
o
Individual s taking more responsibility themselves
o
o
o
o
o
o Other options 18. Do you have any other comments on planning for floods? o 19. How long have you lived at this address? o 20. How long have you lived in Brisbane? o 21. Were you in Brisbane during the 1974 flood event? o Yes o No 22. Were you impacted by the 1974 flood event? o Yes o No In what way? o 23. Do you think there will be another major flood event in Brisbane in the next 50 years? o Yes o No Do you know what a 1 in 100 flood means? o Yes o No Please describe what it means in your own words 24. When choosing where to live in Brisbane did you consider whether the address was safe from flooding? o Yes 294����������Planning,�building�and�insuring� �
o No How did you find out? o 25. When choosing where to live in Brisbane, did you consider whether the address was safe from flooding? o Yes o No 26. What is your gender? o Male o Female 27. What is your age? o 18-25 o 26-35 o 36-45 o 46-55 o 56-65 o Over 65 28. What is the household type at this address? o Couple with children o Couple without children o One parent family o Other family o One person o Group 29. What is your occupation? o Not currently employed o Trades and technical o Labourer o Professional and Management o Administrative and Clerical o Transport o Other 30. Type of dwelling o House o Unit 31. Level of formal education completed? o Primary o Secondary o Technical o Tertiary
Planning,�building�and�insuring�����������295� �
10.2 Planning Case Study 3 - Planner Survey Questionnaire: The impact of natural hazards on land use planning Researchers at the Centre for Tropical Urban and Regional Planning at James Cook University are investigating the impacts of natural hazards on urban and regional landuse planning practices and legislation. This is part of a larger research project that is funded by the National Climate Change Adaptation Research Facility that is investigating changes that may be required in terms of planning, building codes and insurance in the built environment. This survey is based on many of the recommendations that have been made in the Queensland Flood Commission of Inquiry final report, which emphasises issues of land use planning. The report and this survey make particular reference to the Sustainable Planning Act 2009, and the state planning policy SPP1.03 on mitigating the impacts of natural hazards. We are seeking your reaction as a planner, to aspects of the changes that may be required in practice or in legislation, in order to reduce flood and other hazard risk in various parts of Queensland. This survey is not specifically concerned with the location in which you practise, but we acknowledge that local knowledge and experience may guide your answers. It is for this reason that we are only requesting that you indicate the broad region within Queensland in which you work. This survey is not intended, in any way, to be an evaluation of the commission's report. We had planned to carry out a similar survey of planners’ attitudes to hazard mitigation during the early part of 2011. However, the disasters of that period and the subsequent inquiry necessitated a delay until the inquiry had been completed. Consequently this survey is developed from the findings and recommendations of the inquiry. We have adapted certain of the inquiry recommendations, and aspects of their explanation, into a number of statements for which we seek your opinion. Most statements are followed by an opinion scale. 1. Q100 was the defined flood level in SPP1.03. The inquiry report suggests that Q100 levels in Brisbane and Ipswich were not based on a comprehensive flood study. It further suggests that Brisbane has moved away from the use of the term Q100. In places in which you have had recent planning responsibility, to what extent is Q100 used as the primary definition for flood zones (in the way in which it is laid out in SPP1.03)? a) exclusively b) in most jurisdictions c) in combination with other flood measures d) Q100 is not used e) a comprehensive local flood study has defined flood levels
296����������Planning,�building�and�insuring� �
2. Q100 is an effective and useful mechanism for defining flood risk. Strongly Disagree
Disagree
Ambivalent
Agree
Strongly Agree
No comment or no knowledge
3. Members of the general public understand what is meant by Q100 or a 1 in 100 year flood event. Strongly Disagree
Disagree
Ambivalent
Agree
Strongly Agree
No comment or no knowledge
4. Comprehensive flood studies should be carried out in all local government areas in Queensland. Strongly Disagree
Disagree
Ambivalent
Agree
Strongly Agree
No comment or no knowledge
5. Comprehensive flood studies are standardised and use comparable measures and definitions of flood and flood risk. Strongly Disagree
Disagree
Ambivalent
Agree
Strongly Agree
No comment or no knowledge
6. Comprehensive flood studies must take into account the likely impacts of climate change on future floods. Strongly Disagree
Disagree
Ambivalent
Agree
Strongly Agree
No comment or no knowledge
Planning,�building�and�insuring�����������297� �
7. Comprehensive flood studies should be carried out within the context of the whole catchment. Strongly Disagree
Disagree
Ambivalent
Agree
Strongly Agree
No comment or no knowledge
8. Instead of using the Q100, Councils should adopt a risk-based approach to flood management. Strongly Disagree
Disagree
Ambivalent
Agree
Strongly Agree
No comment or no knowledge
9. Local government councils should be responsible for flood studies, either by hiring qualified experts or by doing it themselves. Strongly Disagree
Disagree
Ambivalent
Agree
Strongly Agree
No comment or no knowledge
10. Local government councils should be responsible for the development of a floodplain management plan. Strongly Disagree
Disagree
Ambivalent
Agree
Strongly Agree
No comment or no knowledge
11. Floodplain management plans should adhere to best practice guidelines. Strongly Disagree
Disagree
Ambivalent
298����������Planning,�building�and�insuring� �
Agree
Strongly Agree
No comment or no knowledge
12. Floodplain management plans are best prescribed by legislation. Strongly Disagree
Disagree
Ambivalent
Agree
Strongly Agree
No comment or no knowledge
13. Q100 should be replaced by a range of AEPs such as one in 200 year events down to one in 20 or one in five year floods. Strongly Disagree
Disagree
Ambivalent
Agree
Strongly Agree
No comment or no knowledge
14. Historical flood map should be used as defined flood levels in planning schemes. Strongly Disagree
Disagree
Ambivalent
Agree
Strongly Agree
No comment or no knowledge
15. All areas of future urban growth should be mapped for three or more levels of flood risk. Strongly Disagree
Disagree
Ambivalent
Agree
Strongly Agree
No comment or no knowledge
16. All local government area flood mapping should be accessible to members of the public on a web site or as printed maps. Strongly Disagree
Disagree
Ambivalent
Agree
Strongly Agree
No comment or no knowledge
Planning,�building�and�insuring�����������299� �
17. The flood risk to all individual properties and parcels of lands should be made available to the public. Strongly Disagree
Disagree
Ambivalent
Agree
Strongly Agree
No comment or no knowledge
18. EMQ (or the Department of Community Safety) should be a referral agency under SPA for development in any defined hazard zone (flood, bushfire, landslide, storm surge etc). Strongly Disagree
Disagree
Ambivalent
Agree
Strongly Agree
No comment or no knowledge
19. The existing role of EMQ/DCS in assessing planning scheme compliance with SPP1.03 is a sufficient safeguard for hazard mitigation, and does not require EMQ/DCS to be a referral agency. Strongly Disagree
Disagree
Ambivalent
Agree
Strongly Agree
No comment or no knowledge
20. Temporary SPP2.11 Planning for Stronger More Resilient Flood plains has effectively advanced development of flood management plans following the 2011 floods. Strongly Disagree
Disagree
Ambivalent
300����������Planning,�building�and�insuring� �
Agree
Strongly Agree
No comment or no knowledge
21. Queensland Planning Provisions should define a zone of limited development, or constrained land, areas subject to high risk of flooding, in order to impose severe restrictions on urban development in high risk areas. Strongly Disagree
Disagree
Ambivalent
Agree
Strongly Agree
No comment or no knowledge
22. SPA should be amended to require flood risk to be incorporated into regional plans. Strongly Disagree
Disagree
Ambivalent
Agree
Strongly Agree
No comment or no knowledge
23. SPP1.03 is an inadequate mechanism for guiding planning in flood risk areas. Strongly Disagree
Disagree
Ambivalent
Agree
Strongly Agree
No comment or no knowledge
24. Flood risk is adequately addressed in the Queensland Planning Provisions through local government planning schemes. Strongly Disagree
Disagree
Ambivalent
Agree
Strongly Agree
No comment or no knowledge
25. Planning schemes should be amended immediately as better flood information becomes available, or if development results in a change to flood risk hazard zones. Strongly Disagree
Disagree
Ambivalent
Agree
Strongly Agree
No comment or no knowledge
Planning,�building�and�insuring�����������301� �
26. Detailed flood advice affects property values. Strongly Disagree
Disagree
Ambivalent
Agree
Strongly Agree
No comment or no knowledge
27. If property values are affected by detailed flood advice, councils should be responsible for compensating property owners for any loss of value. Strongly Disagree
Disagree
Ambivalent
Agree
Strongly Agree
No comment or no knowledge
28. Councils are not liable for flood impact damage as long as the council has carried out reasonable mitigation and provided the most up to date information to the general public and property owners. Strongly Disagree
Disagree
Ambivalent
Agree
Strongly Agree
No comment or no knowledge
29. Amendments to a planning scheme in updating and improving the flood risk overlay maps make the council liable to pay compensation for any decrease in property values. Strongly Disagree
Disagree
Ambivalent
302����������Planning,�building�and�insuring� �
Agree
Strongly Agree
No comment or no knowledge
30. State Development areas must take account of flood risk and should be constrained in the same manner as any other development application. Strongly Disagree
Disagree
Ambivalent
Agree
Strongly Agree
No comment or no knowledge
31. Community infrastructure should be sited in areas that are at least risk of flooding ie higher standards of risk avoidance should be applied to community facilities than to residential development. Strongly Disagree
Disagree
Ambivalent
Agree
Strongly Agree
No comment or no knowledge
32. Community infrastructure must be able to function effectively immediately after a flood or any other kind of natural disaster. Strongly Disagree
Disagree
Ambivalent
Agree
Strongly Agree
No comment or no knowledge
33. Commercial properties are responsible for their own risk minimisation. Strongly Disagree
Disagree
Ambivalent
Agree
Strongly Agree
No comment or no knowledge
Planning,�building�and�insuring�����������303� �
34. Commercial and industrial land uses should be permitted in areas of higher risk of flooding than residential dwellings. Strongly Disagree
Disagree
Ambivalent
Agree
Strongly Agree
No comment or no knowledge
35. Construction works and fill in low lying flood prone areas should not be permitted if they increase local flooding or reduce flood storage capacity. Strongly Disagree
Disagree
Ambivalent
Agree
Strongly Agree
No comment or no knowledge
36. Public drainage works should not be exempt developments under SPA. Strongly Disagree
Disagree
Ambivalent
Agree
Strongly Agree
No comment or no knowledge
37. Levee construction should be regulated as assessable development under SPA. Strongly Disagree
Disagree
Ambivalent
Agree
Strongly Agree
No comment or no knowledge
38. If levees cannot be constructed to the level of a maximum possible flood, they should not be permitted. Strongly Disagree
Disagree
Ambivalent
304����������Planning,�building�and�insuring� �
Agree
Strongly Agree
No comment or no knowledge
39. Levees should only be constructed to protect existing properties. Strongly Disagree
Disagree
Ambivalent
Agree
Strongly Agree
No comment or no knowledge
40. New developments should not be permitted inside existing levee protected zones. Strongly Disagree
Disagree
Ambivalent
Agree
Strongly Agree
No comment or no knowledge
41. Planning schemes should contain flood and stormwater policy that sets out information to be provided in development assessments. Strongly Disagree
Disagree
Ambivalent
Agree
Strongly Agree
No comment or no knowledge
42. Evacuation plans should not be specified as the primary or sole condition for approval of a development application in areas liable to flooding. Strongly Disagree
Disagree
Ambivalent
Agree
Strongly Agree
No comment or no knowledge
43. Residential dwellings may be permitted in flood prone areas as long as at least the main habitable rooms are at above the defined flood level. Strongly Disagree
Disagree
Ambivalent
Agree
Strongly Agree
No comment or no knowledge
Planning,�building�and�insuring�����������305� �
44. Because overland flow paths are primarily conduits for flash floods these must be mapped as part of overall flood risk assessment. Strongly Disagree
Disagree
Ambivalent
Agree
Strongly Agree
No comment or no knowledge
45. Properties in high risk flood zones should be purchased compulsorily by the State government. Strongly Disagree
Disagree
Ambivalent
Agree
Strongly Agree
No comment or no knowledge
46. Voluntary buyback schemes of high flood risk vulnerable properties should be funded by the State government. Strongly Disagree
Disagree
Ambivalent
Agree
Strongly Agree
No comment or no knowledge
47. Local councils should take responsibility for buying back high flood risk vulnerable properties. Strongly Disagree
Disagree
Ambivalent
Agree
Strongly Agree
No comment or no knowledge
48. Land that is purchased in a buyback scheme should be zoned only for open space recreation or drainage easements etc. Strongly Disagree
Disagree
Ambivalent
306����������Planning,�building�and�insuring� �
Agree
Strongly Agree
No comment or no knowledge
49. Property buyback schemes of highly flood vulnerable properties should not be considered as an option either by State government or local councils. Strongly Disagree
Disagree
Ambivalent
Agree
Strongly Agree
No comment or no knowledge
50. Residents in settlements that are destroyed or severely damaged by hazards, such as floods or storm surge, should not be permitted to rebuild on the same block, but should be offered alternative land in a hazard free area. Strongly Disagree
Disagree
Ambivalent
Agree
Strongly Agree
No comment or no knowledge
51. Please indicate the region of Queensland in which you work. North & Far North
Central
Western
SEQ
Other
Various
52. Please indicate the sector of the profession in which you work. Local State Federal Private Education Other or Government Government Government Company various
53. Please add any further comments you wish to make.
End Questionnaire. Planning,�building�and�insuring�����������307� �
10.3 Planning Case Study 3: Planner Survey Questionnaire - The impact of natural hazards on land use planning - Answers to Open Ended Question. “If you would like to make any further comments please use the space provided below”: 1. Flash flooding is not easy to map in the areas between Cardwell and Mossman where there are steep mountains and flash flooding can occur as a consequence of any local storm. Until the Sustainable Planning Act provisions regarding compensation for backzoning are removed, there is limited ability for planning to be proactive in terms of reducing inappropriate development in flood areas. Many of the questions asked in the first few sections, did not allow for expanded responses. It would be very appropriate to back this survey up with interviews with local councils to get an understanding of how Q100, Q20, local flood reports are used. The obvious place to implement local flooding policy is through the planning scheme, however the responsibility for the planning, and the studies lies with state and local government. Particularly when catchments are across council areas, and where backzoning is not cost effective due to the SPA provisions. 2. I did not think your first question was clear and therefore did not answer? Options or opportunities need to be provided for interim land uses with a view to a long-term change in flood plain areas under planning schemes. For example, planning schemes are only intended to have a 5-8 year life. The planning scheme zone may still permit development in flood prone areas, if flood matters are resolved sufficient to the satisfaction of Council. However, then the Strategic plan can then indicate that the long-term goal is to revert the land to open space. However, if a planning scheme restricts development in flood prone areas, it needs to be supported by policies such as a buy back or land swap scheme. Not all landowners will want to sell or swap. What government's will need to focus on, is not only the ""lands value"" but an equivalence of development rights or opportunities that may now be lost. And governments also need to also recognise people have made financial commitments on past zoning requirements. If land was not previously known to flood and then did so, no blame can be attributed. In these instances, people may want to swap with for an equivalently sized & amp; zoned flood free land as the development rights and opportunities may be the same. However if land had previously flooded and the landowner bought it knowing it did so they may be more interested in resale. Therefore, each case will need to be look at on its merits and government's need to work cooperatively to resolve this ongoing problem, as it is neither a state or local government issue but rather a governance matter in relation to land. As for the construction of levees and weirs – is this not against the idea of sustainable development? If we continue to protect flood prone land and properties, people will continue to think that it is the government’s responsibility ""to fix it"", rather than take individual responsibility for their decision or choice. People are willing to take a level of responsibility if they know the risks. It is the responsibility of governments to make individuals risk aware. I suggest changes to the property law should also be considered as 308����������Planning,�building�and�insuring� �
part of any reform process, so that when purchasing land in known high hazard prone areas that the prospective purchaser must be made aware. This could apply to other hazards as well, not just flood. In addition, the government corporations should not be exempt from the same requirements of other developers. Large tracts of land in flood prone areas should not be opened up and filled for development regardless of the entity developing it. In particular, I consider the Caloundra South project a poor choice by the State government for this very reason. Also the State government does not appear to have taken these matters in considered during the development regional plans. In particular, for major or priority development areas on the coast such as Mackay (as MDA it will continue to be affected by flooding and storm surge). Perhaps 20-40 year plans need to be reconsidered as well. 3. Surveys of affected residents indicate that buy backs and planned retreat are unpopular options. Building houses higher is considered the best option but as too expensive. Residents continue to return to affected residential areas despite risk. All infrastructure e.g sewerage & amp; electricity plants need to be built above the PMF line. Emergency generators should not be on ground floors of multi-storey development. Maximum Building heights should be allowed to 9.5 metres in flood prone areas to allow non-habitable rooms to be built underneath for overland flow. 4. I found this survey somewhat biased. It appears that some questions have been written by persons without sufficient knowledge of the entire development process...such as question 4.4. Development in flood prone areas may be possible, viable and desirable if engineering solutions adequately address the risk and do not adversely affect other property owners. The issues facing Queensland in relation to flooding are extremely emotive at the moment. At one point during 2011 2/3rds of Queensland was flood affected. Is the author of this survey suggesting that 2/3rds of the existing development in Queensland is inappropriate? Are the existing towns protected by flood levees expected to prohibited from future development? Should they be denied the opportunities for growth and prosperity that the rest of us desire? Should existing towns, especially small rural communities not be permitted to be protected by new levees? What would the authors opinion be of the development of the Netherlands? I believe that the flooding in Brisbane was exacerbated by the Wivenhoe Dam being used for a purpose it was not built or designed for. I understood it was built as a flood amelioration device, not as a drinking water supply. I believe that as a community we are entitled to determine what risk level we will accept. Q100 has been that for a long time and has generally been appropriate. Flood planning is an inexact science and is influenced by many external factors, including ongoing management of drainage systems. We choose the level of risk we want for our health insurance, car insurance, standard of our childrens’ education. Before planners dictate what a new level of risk management should be, it should be done in consultation with the public, local, state and federal governments, insurance bodies, property Council, UDIA, etc. I believe that as planners we need to ensure that sufficient work is being done to deliver all facets of community facilities and safety. If a growing city such as Brisbane needs another drinking water supply, then so it should be Planning,�building�and�insuring�����������309� �
delivered in the most sustainable way, with EQUAL weight given to social, environmental and economic consideration. Government in Australia, and Queensland especially, has been devoid of equal weighting of sustainability measures for some time. No new dams have been built on mainland Australia for decades. We need to change this. Water recycling needs to be improved. Existing communities at flood risk need support and protection, not mapping and alienation. we need some consistency across planning at all levels...The latest flood mapping for Townsville identifies half the city will be inundated by 2100, yet the government is planning to spend $1b expanding the port. If the city will be inundated, wouldn’t the money be more wisely spent resuming existing land and expanding the port inland? This is typical of the quandary planning is experiencing in Qld. Qld is in desperate need of some coordination between agencies instead of the powerplays and empire building that has been occurring for at least the last 6-10 years. 5. There needs to be a more consistent legislation that covers all areas of QLD, as there are differing levels of flooding (i.e. SEQ - FNQ). State and Council's should get tougher with allowing areas to rebuild after an event (like Grantham). Why let them rebuild in a floodprone area – Brisbane river, Ipswich, Tully Heads, certain parts of Cairns, etc....... Surely this opens up liability issues for State and Local Governments allowing development to happen in floodprone areas????? Good luck with this project and I hope you can have some influence with your study. Thanks for the opportunity. 6. Flooding is not a new risk. The risk of flooding has been around since before development ever commenced. A Planning Scheme should not be a document that beyond doubt details whether a site is flood prone (to a defined event) or immune. The formal identification of levels does not change the actual level of risk a properly is subject to from inundation. Localised flooding also occurs from human error, not just rising waters. Debris can dam at bridges or small culverts or poor levee location or illegal earthworks. No amount of overlay within a Planning Scheme can prevent or identify this. However, the impacts of such a flood are the same on the affected property owner. There is a degree's of flooding and degrees of tolerance, some major urban areas arguably are subject to high risk of flooding, yet this is an annual risk. Some small towns flood every year. Highways are cut every year as a consequence of flooding. Individuals should be more responsible for their own choices - not expecting governments to compensate. Whilst broad flood mapping and overlays should be included with a scheme the exact extent should be subject to detailed study (if necessary) at the development application stage. Flooding is a catchment issue, most Local Governments only make up a part of a catchment. To fully understand flooding, mapping should be undertaken at catchment levels. 7. Ensure future policy approach is focused on risk appetite of communities. Historic land use patterns and decisions by individual local governments strongly influences the outcomes of policy on the ground (policy arguments versus outcomes arguments). Risk appetite is higher in some communities than others. A common methodology for flood mapping, communication to 310����������Planning,�building�and�insuring� �
communities and risk assessments is a good ground to work from. Further, State-wide mandatory policy is a much harder thing for local governments to accept if the State removes itself from implementation responsibilities, but then wants to assess development applications as well. 8. This is an interesting topic and the research is needed. Hopefully a lot more research is done to refine the results than will be presented by this survey. It is a little disappointing that a university research project has loaded several of the questions in such a way that it is difficult to answer in the format provided many of the questions generate provisos in planners' minds when they come to answer them eg the answer is not as clear cut as clicking one button or another as it depends on the circumstances. Many of the questions would have been much better understood by the survey creators if there had been a box like this one at the bottom of each page to enable the surveyee to provide the professional clarification needed to explain the answers. I am feeling a little uncomfortable about several of my answers because I have not had this opportunity. As a former JCU student, I would have hoped that a better process had been developed. Meanwhile, I await the results of the research and hope that a better understanding of the impact of floods and climate change is reached. Suffice it to say that we still do not yet know how each "cut" impacts the health of our urban areas each time we build anything - death by a thousand cuts is an old metaphor but true. We blame Councils when things go wrong but who is to say that building done years ago was not appropriate for that time, without a) the benefit of further current research, b) the impact of major infrastructure often miles away and c) the change in our political and environmental standards. 9. It is sometimes the Q20, Q50 event that make more damage 10. Some of these questions are difficult to give a definite answer as I work mainly on remote Indigenous schemes. Most remote Indigenous communities are highly constrained, in particular Wujal Wujal. They are a very small DOGIT constrained not only by flood, bushfire hazard etc, most of the DOGIT is World Heritage rainforest - they have very little land for expansion/growth. Additionally DOGIT communities are not rates based - Councils are limited in the funds studies, etc are expensive and some of the questions in the survey do not account for the vast differences in these communities (this applies to remote rural communities also). I HIGHLYdisagree with a blanket approach and feel that all planning, risk mitigation measures, methods, etc...MUST start to appreciate the extraordinary differences between mainstream councils and other. Build to the conditions, NOT restrict where there are very little, or in some cases in the Far North, no choices. 11. The question is will the Federal Government and insurance companies correct past mistakes to ensure people are compensated for past decisions due to flooding standards? The mining royalties could be used to do this. If houses and commercial/retail building re-built in Q100 flood areas they need to be designed better to reduce future damage and possible loss of life. 12. I believe survey was too hard and too detailed for planners to answer. more Planning,�building�and�insuring�����������311� �
appropriate for the engineers. planners are aware of flooding and aim to design planning outcomes that are unaffected by these impacts. but the engineers and others are responsible for the detail behind the scenes and provide advice/recommendations accordingly. 13. State development areas and other state development MUST comply to the same requirements as private development. Private residents and developers should not be burdened by relaxations granted to state and their implications. A lot of the questions really depend on the situation. Smaller local government areas may have very significant flood risk and should not be required to invest in extremely expensive flood modelling and plans. 14. Storm surge levels need to be immediately reassessed to include paleoevidence from both sand ridge and stalactite data (NOTT) 200 years is not enough time, nor is the present assessment reliable. It will be too late and who will be responsible if those living higher than 5 m drown during a cyclone?
312����������Planning,�building�and�insuring� �
10.4 Planning: Machans Beach Case Study. ACHIEVING COMMUNITY RESILIENCE AGAINST NATURAL DISASTERS WITHIN PHYSICAL VULNERABLE LOCATIONS: A CASE STUDY OF MACHANS1 BEACH This research examined community resilience at Machans Beach in Far North Queensland, a location which is vulnerable to disasters, in order to gain an appreciation of the role of the land use planning and community factors in reducing vulnerability and increasing resilience. The Cairns suburb was identified as a case study site because Granger (1999) described it as the Cairns suburb most at risk from multiple natural hazards. This research further examines the relationship between land use planning, policies and strategies and their role in reducing natural hazard vulnerability. It adopts the concepts of resilience and adaptive capacity in relation to four key components recognised throughout resilience and natural hazards literature, specifically Social Cohesion, Community Networks, Risk, and Knowledge and Understanding. Levels of individual respondent resilience and experience are analysed to determine in turn the level of existing community resilience. Information gained from this research can be used to inform both emergency services responses and future land use design in tropical coastal areas. This single case study examines the level of social resilience that exists within a community (here, Machans Beach) that is vulnerable to storm tide inundation. Flyvberg (2001) maintains that the use of a single case study is a necessary and sufficient method for specific social science research tasks. The use of a single case study allows for an in-depth understanding because researchers can place themselves within the direct context or field that is being studied. Only in this way can researchers fully understand the viewpoints and behaviours that characterise specific social actors (Flyvberg 2006). Case study findings often challenge preconceived views, assumptions, and concepts. Case studies also challenge research assumptions, frequently causing researchers to revise their hypotheses (Campbell 1975) (Ragin 1992) (Flyvberg 2001). The case study used here has allowed a close examination of how a community can be resilient within a physically vulnerable location. This research is described as Information-Orientated Selection. The latter is a form of sampling that maximises the utility of information from small samples and single cases. Cases are selected on the expectation that their predicted content will provide an indepth understanding of phenomena. This case study is further identified as a ‘Critical Case’ that permits logical deductions from the data obtained (Flyvberg 2006). Machans Beach provides an ideal case study of community adaptation to a coastal hazard. Selecting the case study site Machans Beach (Figure 1), the first beach suburb to the north of the Cairns CBD, is identified as one of the most physically vulnerable areas in Far North Queensland (Granger 1999). The area is vulnerable because of its position along the Barron delta which is traversed by the Barron River, as well as two neighbouring river channels ������������������������������������������������������������ 1
There is no possessive apostrophe in the name Machans Beach.
Planning,�building�and�insuring�����������313� �
which surround both sides of the community. The Barron River poses a significant flood threat to the immediate Cairns region. During inundation all northern beach suburbs are isolated from the city centre as both crossings of the Barron River as well as extensive lengths of the Captain Cook Highway become inaccessible. Machans Beach is further isolated as the single access road is also inundated during significant flood events (Figures 2 and 3). Machans Beach is further vulnerable to higher flood levels due to the construction of levees at the airport in 1988, which have increase inundation within the area by about 120mm during a 50 year flood event (Granger, 1999). The greatest physical threat to Machans Beach is a combination of both extensive flooding as well as a storm surge event at high tide. With restricted access to evacuation routes, as well as the majority of land indicating a peak inundation level at two metres, the area is considered to be highly physically vulnerable. According to storm surge models (Granger 1999) the suburb would be one of the most seriously affected residential suburbs: approximately 90% of dwellings would become flooded or isolated by water despite the presence of the sea wall. Machans Beach experienced small scale cyclonegenerated storm surges during Tropical Cyclone Rona in 1999, Justin in 1997, Steve in 2000 and more recently Cyclone Yasi (January 2011. Regular flooding is characteristic of the Machans Beach area due to its physical profile. The most vulnerable locality within Machans Beach is the O’ Shea Street Esplanade which is directly exposed to storm surge (see Figure1). For this reason, houses along the Esplanade were chosen for survey. Research questions The questions this research has sought to address include: 1) What is the role of land use planning, strategies and policies in reducing physical vulnerability to natural hazards? 2) To what extent does the level of past experience with natural disasters influence individual and community resilience? The Role of Planning Among the various land use planning systems (plans, regulations, policy) and stakeholders (planners, communities, developers) there is a complex range of ideologies and beliefs as to how the benefits of land development should be distributed. Harwood (2010) observes that land use planning systems have evolved over time to provide land use certainty to both developers and the community. To this end, land use planning, also referred to as land development and spatial development, determines how relevant land may be used. For example, it determines land zoning and the location of public transportation facilities. It also determines building location within specified environmental contexts, such as absolute beachfront development (Litman 2011). In Queensland, the Sustainable Planning Act (2009) (SPA) makes provision for local planning schemes to address local land use and development. The SPA also makes local governments responsible for regulating to mitigate the effects of natural hazards. 314����������Planning,�building�and�insuring� �
The SPA also requires that local government planning schemes address the impacts of climate change. There is, however, no SPA requirement that planning schemes address the impacts of natural hazards, except if the natural hazard can be proven to be caused by climate change. The SPA requires that all planning schemes comply with relevant state planning policies, known as SPPs. For example The State Coastal Protection and Management Plan (2011) is aligned with planning policies that relate to natural hazards. It should be noted that SPP 1/03 ‘Mitigating the Adverse Impacts of Flood, Bushfire and Landslides’, (Queensland Government Department of Community Safety, 2003) adopted under the Integrated Planning Act (1997) (IPA) is currently under government review Section 29 of the Coastal Protection and Management Act (1995) outlines eight specific areas for planning and management consideration. Discussion Current State Planning Policies have developed mitigation strategies against natural hazards for new development. However, the plan fails to incorporate SPPs that directly address natural hazards such as cyclones and storm surge events. Further, SPPs do not provide for the mandatory retrofitting of existing urban coastal areas, nor do they address current levels of exposure and risk within these communities (Symes et al 2009). When reviewing the current legislative and policy framework against disaster risk mitigation imperatives, it becomes clear that, whatever the climate change/risk mitigation efforts made under the SPA and relevant SPPs, the need for certainty of rights for land title holders restricts options for mandatory risk-mitigation measures. Specifically, the certainty of development rights that each individual lot carries prohibits retrospective planning interventions. This is the case even where there is relevant new information, for example regarding the effects of climate change, or increased understanding of natural disaster management. Any development that is from the outset lawful and consistent with the associated land use plans cannot subsequently be rendered non-compliant, even in the aftermath of large scale destructive events such as natural disasters. In short, response and recovery measures within coastal communities cannot restrict existing lawful use rights attached to land. Noting this constraint, for areas vulnerable to natural hazards and even climate change, QLD land planning approaches have adopted a risk-mitigation framework. This approach seeks to mitigate risk through development conditions and engineering solutions. Significantly, current SPPs also allow local government to enforce mitigation strategies and building codes that aim to reduce risks associated with natural hazards. As is evident from the discussion so far, it can be argued that the primary function of current state planning regimes has been to maintain certainty of development rights as opposed to creating hazard-resilient communities (Stevens et al 2010). Whilst the Federal Government sets goals to create resilient communities against natural hazards, it is clear that neither State nor local policies and frameworks are can currently give effect to these goals. In particular, according to Symes (2009) State Government agencies must consider mandatory storm surge and cyclone policies and strategies throughout the current State Planning Policy Framework if the latter is to
Planning,�building�and�insuring�����������315� �
address the very real and potentially devastating risk of associated natural hazard events. However, current planning frameworks simultaneously prohibit this. To understand the implications of this paradox, Machans Beach, with its high vulnerability to natural hazards, provided a relevant case study.
316����������Planning,�building�and�insuring� �
Figure 1: Machans Beach Image: Google earth Planning,�building�and�insuring�����������317� �
Figure 2: A picture of the Access Road into Machans Beach under flood waters (2008). Image: Respondent 4.
Figure 3: The flooding of the Main Access Road into Machans Beach during the wet season (2008). Image: Respondent 4, 2008.
318����������Planning,�building�and�insuring� �
Figure 4: An unrecorded small scale storm surge event approaching the Machans Beach Coastline in 2009, taken from the second storey of a home along the Esplanade. Image: Respondent 4.
Figure 5: A photo of Storm surge activity impacting along the Machans Beach Coastline in January of 2009. Image: Respondent 4.
Planning,�building�and�insuring�����������319� �
Machans Beach Rock Wall The shoreline along Machans Beach has been subject to extensive sea erosion since urban development began in the early 1930s. After experiencing extensive erosion (Figure 1) and threat to property for more than 40 years, residents called for a community-based and partially Council-funded initiative to build a rock wall in 1968. The rock wall was intended to reduce erosion and serve as a buffer against tidal events. As can be seen in the photograph at Figure 6 (below), the extensive seawall is positioned along the O’ Shea Esplanade. The structural integrity of the wall has been regularly questioned by members of the public due to limited maintenance and upkeep. During 1993 the engineering of the wall was certified as able to withstand winds of up to 60m/s (Cairns Regional Council and Chief Executive Department of Transport and Main Roads Appeal 389 and 390 of 2009). As a result, the wall’s breach threshold was identified as sufficient to withstand the impacts of storm surge events and inundation. Winds of 60m/s indicate a low to medium tropical cyclone event. In contrast, tropical cyclone Yasi at its centre (which crossed the coast further south) presented wind speeds of more than 250km an hour. This is much greater than the wall’s current capability. If such an event were to impact Machans Beach, particularly during a high tide, the rock wall could fail.
Figure 6: Aerial photo of the Southern End of O’Shea Esplanade illustrating the extent of the current seawall (2007). Image: Respondent 4.
320����������Planning,�building�and�insuring� �
History of Machans Beach and its Development The area of Machans Beach was first surveyed for white settlement in 1885 and was later purchased by Richard Machan in 1924. The 100 hectares of coastal land began as a holiday and picnic destination with small shack-type properties evident by the late 1920s. Due to its increased popularity as a ‘retreat’ location, the Mulgrave Shire Council approved a large subdivision for Machans Beach. However, development was halted during World War Two, when the area was utilised to accommodate American, British, Canadian and Australian Soldiers. Once the majority of soldiers left, the area regained its popularity with surrounding communities. The 1950s saw the rise of permanent housing because of the availability of affordable small allotments at Machans Beach. As housing within the area increased, public services such as a petrol station, reticulated electricity, a school and community hall were introduced. Machans Beach was also popular because of the perceived high level of community friendliness within the area. Social networks became, and remain, of high importance to the community, and contribute to its unique and relaxed coastal lifestyle. The community frequently advocates against increased tourist and commercial development. Vulnerability to natural hazards pre-dated white settlement, and as noted earlier, is a consequence of the physical location of Machans Beach on the coastal shoreline, between two river systems. Urban development continues to occur within the area regardless of predictions of increase in natural hazard event frequency. For example in 2007, there were two individual applications made to the Cairns Regional Council to reconfigure Esplanade lots (one lot was to be divided into two and the second lot divided into three). In November 2009 both of the applications were refused by Council. Both lots have preexisting approval permitting one house per block of land (with ancillary buildings) and were refused permission on the grounds of non-compliance with the relevant planning scheme codes. There were five reasons for refusal including one for inadequate engineering, one for natural hazards and three for the potential impacts that could occur to the environment such as erosion, impacting riparian zones and future waterway movements. Both applications were appealed through the Planning and Environment Court by the proponent. The appeal focused on the ability of the rock wall and its location to protect development. Advice from engineers demonstrated that the existing rock wall has withstood previous cyclones and storm surge events. Both applications were approved with conditions and were granted on the basis of the evidence provided by the engineers. These examples further indicate that despite the extensive physical vulnerability of the area, development continues to intensify. The community at Machans Beach There are 936 people in Machans Beach (Cairns Regional Council 2006). The age groupings of the population are: 0-4 years, 6.8%; 5-9 years, 8.7%; 10-14 years, 7.1%; 15-29 years, 12.8%; 30-44 years, 28.5%; 45-64 years, 29%; and 65+ years, 7.2%. Indigenous members of the population total 8%. The overseas-born population totals 16%. There is a total of 232 families, 35% being couples with children, 41% couples without children, and 24% single parent families. The housing is primarily single dwelling (96% of 329 dwellings). The proportion of fully-owned housing is 26.7%, being purchased amounts to 37.3% and rented accommodation amounts to 29.7% of Planning,�building�and�insuring�����������321� �
housing. The modal home repayments are between $750-$1199 per month, and the modal rental payment is $180-$274 per week. The modal gross weekly income is $250-$599. Unemployment levels are low at 0.5%. The most common occupation is ‘professionals’ (25.6%), followed by technicians (16.4%), clerical and administration (12.7%), managers and labourers (11.1% each). Determining migration patterns is an important aspect in determining community resilience as it indicates levels of social learning and memory within a community (Li 2009). Specifically, a high migration rate within the community would indicate limited social memory for natural hazards within that area. Li also suggests that characteristics such as living within a zone prone to natural hazards and previous experience of natural hazards within that area greatly influences community preparedness, which in turn affects community resilience. Statistics on migration (CRC 2006) indicate that nearly half (44%) of the population lived at a different address 5 years previously. Paton (1994) suggests that ‘sense of community’ is an important resource for people in times of stress such as natural hazards. Volunteering is one measure of the level of community involvement through recreational activities, fundraising, community projects, training initiatives and education. Research (CRC 2006) indicates that one in five people at Machans Beach volunteers within the community. Key variables that indicate both social vulnerability and resilience include income, race and ethnicity, age, home ownership, education, as well as health status - including people with special needs (Drabek 1996, Enarson et al 2003, Lindell and Perry 2004, Sattler et al 2000, Tierney et al 2001). Fothergill and Peak (2004) suggest that key resources such as health, education, language and income can determine individual levels of vulnerability or resilience. Morrow (1999) describes how situational determinants are also indicators of a person’s level of resilience or vulnerability, including whether they own a home or are renting, the number of people sharing accommodation, and whether or not they live in a rural area. Data for the Machans Beach community (CRC 2006) indicate that one in ten people are indigenous and that there are 19 people who require assistance as a result of serious injury, disability or frail age. A total of 61 people speak a language other than English at home, with more than 90% of the population speaking English as their main language. These findings suggest that the majority of the community would be able to understand, respond and react to evacuation and preparedness procedures if relevant authorities requested they do so. Acknowledging other languages is an important characteristic for emergency response planning so that necessary resources are in place to ensure that language barriers do not affect understanding and evacuation procedures. Survey Methods This research used qualitative semi-structured interviews to obtain data. Flyvberg (2006) indicates that the use of qualitative data in the context of social science allows for concrete context dependent knowledge which is difficult to obtain from quantitative data. Burns (1997) indicates that qualitative research helps enable recognition of the importance of the subjective experiential ‘lifeworld’ of human beings. He further describes how the task of qualitative research is to capture how respondents interpret the complexity of their world, and to understand the viewpoint of each participant. 322����������Planning,�building�and�insuring� �
Interview Questions The semi-structured list of questions was the main form of data collection used for this research. The questions were constructed to address each of the four key components of resilience including knowledge and understanding, risk, social cohesion and community networks. Questions relating to past natural hazard experience were also used to address the key aims and objectives of this research to establish the relationship between past experience against the four components of resilience. Most of the questions were open ended, giving each of the respondents the opportunity to provide further information or experience that may not have been obtained from single answer questions. The overall time taken to complete each interview ranged between 1 and 1.5 hours. Demographics The first set of questions explored demographic information in relation to respondents’ length of residence within Machans Beach, and home ownership. This information provided the basis for establishing a demographic profile for each of the respondents. Some respondents felt uncomfortable answering questions on home ownership. Questions were therefore restricted to length of residence. 1. How long have you lived within Machans Beach? 2. How long have you lived in this house? 3. Do you own or rent this house? O/R: 4. Why did you choose to live on the beachfront of Machans Beach? Social Cohesion Questions 5, 6, 7 and 8 were constructed to allow an estimate of perceived level of social cohesion for each respondent. These questions identified the respondent’s opinion of how ‘close knit’ Machans Beach appears to be, visiting rates between residents, and the level of social engagement that exists between residents. The responses were then divided into groups according to respondents’ level of experience. This was to determine the relationship between social cohesion and levels of individual resilience, which in turn informed analysis of community resilience. The question as to whether Machans Beach was ‘close knit’ was open-ended. 5. Would you describe Machans Beach as a close knit community? 6. In the last month how many times have other Machans Beach residents visited you in your home? _____ times. 7. In the last month how many times have you visited other Machans Beach people in their home? _____times. 8. In the last three months how many times have you got together with other Machans Beach residents to play games, sport or other recreational activities? ___times.
Planning,�building�and�insuring�����������323� �
Community Networks Questions 9,10 and 11 were designed to determine community networking within the case study site, analysing the level of volunteering, community engagement in social events and participation in volunteering activities within the community, for example the SES and the Community Association. Both questions 9 and 10 required the respondent to list and explain the types of events they attend within the community as well as activities for which volunteer. Question 11 asked the average number of hours people dedicate to volunteering. The result was then compared to the state average to determine whether Machans Beach possesses a higher level of volunteering against the overall state average. Each of the responses from the respondents were recorded into tables describing levels of experience with natural hazards and community networks. This analysis sought to determine whether community networking influences the level of community resilience within a physical vulnerable location. 9. Which community events at Machans beach do you or your household participate in such as the markets, the community garden project, Folk and roots festival etc. 10. Do you or any of the members of your household participate in voluntary activities within this community eg: SES, parents and citizens, meals on wheels etc. 11. How many hours per month would you say you spend volunteering in the Machans beach community Risk Questions 12 to 15 were used to determine the level of risk each of the respondents accepted when buying/renting, and living along the Esplanade. The questions aimed to identify whether the respondents undertook any research before the purchase or relocation into the property; where the respondents sourced their information and whether they undertook their own risk assessment of relevant threats. The purpose of these questions was to identify the relationship between the different levels of experience and risk to determine the level of resilience that exists in relation to risk acceptance within a physically vulnerable location. 12. Before you decided to live in this house did you do any research about where the house is located in relation to any potential natural hazard threats such as cyclones, storm surges, tsunami, earthquakes etc? 13. If yes what information source did you use 14. And did your search find your house to be at risk of any of these hazards? 15. If no did you make your own risk assessment of these threats? Knowledge and Understanding Questions 16 to 23 aimed to determine the level of understanding and experience each resident possess in regard to natural hazards, with some questions specifically 324����������Planning,�building�and�insuring� �
targeting responses to storm surge events. Questions 17 to 20 and question 22 were designed to determine the level of understanding residents have to warning systems and evacuation procedures in place at the time. Question 21 examines the level of risk each respondent believes exists within the area regarding storm surge events ranging from low to medium to high, to enable consistency and limit uncertainty when determining the level of perceived risk by residents. Question 24 used ‘Tully Heads’ as an example to illustrate the level of destruction the Machans Beach community potentially faces, allowing respondents to indicate how they would respond to such an event. The purpose of these questions is primarily to determine the relationship between the level of experience and knowledge and understanding to further determine the level of resilience that exists within the community. 16. If a storm surge was to occur in Machans Beach what sorts of effects do you think it could have to the Machans beach area? 18. Do you know whether a storm surge warning system exists for Machans Beach? 19. If you answered yes to question 2 are you aware of the emergency procedures you need to follow? 20. If you answered no or don’t know to question 2 do you think Machans Beach needs a Storm surge warning system? 21. Do you think there is a high, medium or low risk a storm surge affecting Machans Beach? 22. If you were told to evacuate do you feel you would be safe to stay and defend your property, or would you leave upon request? 23. If a storm surge was to occur and your property was subjected to the full effects of cyclone damage or storm surge similar to Tully Heads, would you consider rebuilding back here? Undertaking the surveys The semi-structured interviews were conducted door to door of households along the O’Shea Esplanade. The intended form of sampling was to adopt a systematic approach starting from one end of the Esplanade to the other end interviewing at every third household to obtain an even distribution. Respondents self-selected based on their willingness to participate with the research. Many respondents indicated other individuals who would also be interested in participating in the research - a common characteristic of snowball sampling (Goodman 1960). Snowball sampling also known as ‘chain referral sampling’ is widely used throughout qualitative sociological research and is often used when the population under investigation is difficult to obtain due to low numbers, low participation or the sensitivity of the topic (Browne 2005). The interviews were undertaken between Monday 4th and Friday 30th of July 2011. Both the first and second weekend day of each week were selected as times when most residents were likely to be home during this time. In some cases respondents were interested in the study, but were unable to participate at that exact time. In those Planning,�building�and�insuring�����������325� �
instances interviews were scheduled for a later date, at a time selected by the respondent to increase flexibility and therefore respondent participation in the research. This process of obtaining interviews was continued until interview opportunities were exhausted by potential respondents’ refusals. A total of 21 respondents participated in this research. Data Analysis Each interview was analysed and was placed into a group dependent on their level of experience to natural hazards – low, medium, or high. The majority of questions were then divided into the four categories of resilience as identified in the literature and set out above (Social Cohesion; Community Engagement; Risk; Knowledge and Understanding). The data analysis is presented in tabular form for ease of understanding. Results This section has been organised into a series of tables setting out survey findings. A discussion of findings follows the tables. Table 1: levels of experience that each respondent possesses Table 2: social cohesion of respondents with low experience of natural hazards Table 3: social cohesion of respondents with medium experience of hazards Table 4: social cohesion of respondents with high level of experience of hazards
326����������Planning,�building�and�insuring� �
Table 1:
Natural Hazard Experience of Respondents (N=21)
Respondent Low (One event/ Tropical Cyclone Yasi)
Medium (up to four events)
High (up to 10 events)
1
TC Yasi, Carol, Winifred, Steve, Monica, Larry and several more at least 8 to 10.
2
TC Yasi, Carol, Winifred, Steven, Monica, Larry and anything else that occurred within the last 35 years within Cairns. TC Joy, Larry, Steven as well as the Victorian Bushfires in 1983.
3
TC Yasi, Winifred, Joy, Steve, Larry as well as the Brisbane Floods.
4
TC Yasi and Larry
5
TC Yasi, Steve, Joy and anything else since 1993.
6
TC Yasi, Larry and Tesse and was in Melbourne during the heat storms.
7
TC Yasi, Larry and Tessi and anything else since 1995.
8
9 10
TC Yasi TC Yasi, Steve,Larry and Tessi.
Planning,�building�and�insuring�����������327� �
Anything since 1983 in Queensland and since 1970 in WA.
11
12
TC Yasi, Steven, Larry and Joy
13
TC Yasi and Larry
14
TC Yasi TC Yasi, Larry Tessi. Anything within Queensland since the last 35 years.
15
TC Yasi, Larry and Tessi
16
17
TC Larry
18
TC Yasi
19
TC Yasi
20
TC Yasi
21
Yasi, also the flooding events in Mackay.
328����������Planning,�building�and�insuring� �
Table 2: Social Cohesion of Respondents with Low Experience of Natural Hazards (N=6) Respond- 1) Would you describe ent Machans Beach as a close knit community? Y/N Why would you describe it as close knit
2) In the last month how many times have other Machans Beach residents visited you in your home?
3) In the last month how many times have you visited other Machans Beach people in their home?
9
This community ranges from doctors to people on welfare or are unemployed. There is just such a huge variety of character, people are polite and there is a sense of tradition still up kept within the community.
Not much at all, I work night shift so I am sleeping during the day.
Not much at None all, if I am about I will say hello and have a chat.
14
Just a great community Maybe once spirit, when you go to or twice community events, the turn out from the locals is great to see.
Same
I go walking with my mate and our dogs maybe once or twice.
17
It’s a really beach community; people are relaxed but at the same time really supportive.
I sit out on the balcony a lot, so I see a fair few people when they go for a walk.
I don’t really go out of my way to see people, but I generally see them anyway because I am always outside.
None
18
The community is generally nice, However, I don’t believe it is anymore special than any other suburbs. But there is a good feel about the area. It is
3-4 hours a week, see several people
A couple of times a week
None
4) In the last three months how many times have you got together with other Machans Beach people for recreational activities?
Planning,�building�and�insuring�����������329� �
comfortable. 19
There is a feeling of belonging within the community, people are so polite; understanding and always willing to lend a hand.
20
Yes
A couple of Maybe once hours a week or twice
I don’t meet many people
None, I keep to myself
I go walking with a few ladies in the street, we take the kids for a walk as well.
None
Table 3: Social Cohesion of Respondents with Medium Experience of Hazards (N=8) Respondent
Would you describe Machans Beach as a close knit community? Y/N Why would you describe it as close knit
In the last month how many times have other Machans Beach people visited you at home?
In the last month how many times have you visited other Machans Beach people in their home?
In the last three months how many times have you got together with residents for recreational activities?
3
Yes, most definitely: It has a community village atmosphere which is really hard to find these days. People are always stopping by,...being a part of your life.
Most weekends, nearly everyday
on a daily basis
Walking with a group in the street a couple of times a week.
5
This community is essentially selfcontained due to its abundance in facilities. There is a restaurant which acts as a social point, petrol station, post office, fish and chips, local store. The lifestyle that is offered (here) is a huge driver. The
Yes, I would see people on a daily basis
Yes, because of my job I am well known within the community so people see me all the time.
No I don’t usually, but from time to time I will go and give some of the other blokes a hand patching up the seawall.
330����������Planning,�building�and�insuring� �
community is supportive and inclusive. 7
It is just such a friendly place; people are always saying hello, and it...has a traditional feel about it.
Daily
Daily
None
10
There is just a good vibe within the community, people are always making themselves known to you.
0 - 2 hours a week
a couple of times a week
None
12
When I first moved in a couple of neighbours invited themselves for a BBQ, brought a bottle of wine. The spirit here is really warming.
Not much maybe twice a week maximum
maybe once or twice a week
None
13
The family orientated atmosphere and the friendly people indicate that it is a really tight community
Daily
Daily
None
16
I would not say the community is more close knit than most others, people are nice but keep to themselves, but... so do I.
I keep to myself so I don’t see too many people
I rarely see anybody, unless I see them when I am in the yard.
None
21
People are proud to belong to this community. (The support) is really obvious and sometimes overwhelming.
Few times a week
Few times a week
None
Planning,�building�and�insuring�����������331� �
Table 4: Social Cohesion of Respondents - High Level of Experience of Hazards (N=7) Respondent
1) Would you describe Machans Beach as a close knit community? Y/N Why would you describe it as close knit?
2) In the last month how many times have other Machans Beach residents visited you in your home?
3) In the last month how many times have you visited other Machans Beach people in their home?
4) In the last three months how many times have you got together with others for recreational activities?
1
Yes – people look after each other here, it is a small community where everyone pitches in to help. There is excellent community spirit. People are not nosy (about) your personal life.
Not sure of quantity, but always saying hello and having a chat.
Not sure of quantity, but same as before always stopping to say hello and have a chat.
None at all
2
Yes, I would say it is, I know a couple of the neighbours.
Probably have a couple of people over a week
Might see the neighbours once or twice I stick to myself.
I do not participate in any extra activities
4
Yes, this place is a fully self contained community; I believe there is a lower crime rate in this suburb which is directly related to everyone being so friendly. Every day is a holiday without fail.
When you live here you live in a fishbowl, always seeing people walking past saying hello, it would be rude not to stop and have a beer.
On a daily basis
Not at all
6
Yes – People here still care, look out for one another, and each other’s kids animals gardens cars and homes. There is
0-2 hours a week
Daily
I don’t participate in any activities within the community
332����������Planning,�building�and�insuring� �
such a tolerance of differences from addicts to doctors. There is over 30 different nationalities. 8
There is such a different variety of people, and yet people still get along with each other so well.
I would see a few people on a daily basis
My neighbour is unwell, I go see her every day. I also see people walking by.
I do volleyball with mates in the street, happens once a week
11
A great community spirit, (at) community events the turn out from the locals is great to see.
maybe once or twice
same
I go walking with my mate and our dogs once or twice.
15
Family atmosphere and friendly people indicate it is a tight community.
Daily
Daily
None
Commentary on Tables Table 1: Natural Hazard Experience of Respondents Respondent levels of experience are rated at low, medium and high, determined after all respondents were interviewed. Several respondents indicated experiencing only one event, and were categorised as having low experience of natural hazards. An average of four events was determined from the results, which indicated respondents possessing a medium level of experience with natural hazards. Any respondent possessing experiencing above the average was placed into the group of those with high experience of natural hazards. Most respondents within this group have experienced more than ten natural hazards. The three groups were then assessed against each variable of adaptive capacity including social cohesion, community networks, risk, knowledge and understanding to analyse whether levels of resilience are influenced by levels of experience. As indicated in Table 1 (above), of the twenty one respondents, six had experienced only one natural hazard, being Tropical Cyclone Yasi. Eight respondents indicated a medium level of experience, experiencing up to four natural hazards with all respondents indicating that they had experienced Tropical Cyclone Yasi. Other common natural hazards experienced by respondents within this group included Tropical Cyclones Larry, Tesse and Joy. Finally, seven respondents indicated they Planning,�building�and�insuring�����������333� �
have extensive experience of natural hazards, experiencing up to ten or more natural hazard events. For example respondents two and fifteen indicated that they have experienced many events that have occurred within the last thirty-five years, as well as respondent eleven who has experienced natural hazard events since 1970. The results suggest a relatively even distribution of respondents across all levels of experience. This level of experience appears to be closely aligned with length of residence in the community, as well as age. Table 2: Social Cohesion Respondents with Low Experience of Natural Hazards and Social Cohesion Respondents in the group with low experience of natural hazards suggest that they perceive the lowest level of social cohesion within the community. While five out of the six viewed the Machans Beach community as close knit, this group demonstrated low visiting and interaction rates with other parts of the community. Two thirds had interaction and one third had little or no interaction at all. In relation to the engagement with recreational activities within the community, one third indicated some level of involvement. Table 3: Respondents with Medium Experience of Natural Hazards and Social Cohesion Most of this group (7/8) described the Machans Beach community as close knit. The majority engaged in social interaction such as visiting each other on a daily or regular basis (cf low visiting rates of Table 2 cohorts). As was the case for the Table 2 cohort (low experience of natural hazards), one third of respondents with medium experience of natural hazards engaged in some form of recreational activity. Table 4: Respondents with High Experience of Natural Hazards and Social Cohesion This group had the highest level of social cohesion in the total sample. Every respondent recognising Machans Beach as a close knit community and engaged in some form of social interaction. As was the case with the other two categories, two thirds of this group do not engage in any recreational activities, with the remainder engaging in sports or communal walks. The key difference was in visiting, which was very common in this group, which appears to have the highest level of social cohesion as opposed to the cohorts with low and medium experience of natural hazards. This may be related to the longevity or residence which enables more chances opportunities for residents to engage with social and life events within the community. Summary Most respondents saw Machans Beach as being a close knit community. Social interaction increases with natural hazard experience. This may also be related to the residential longevity of residents that is observed in respondent groups with medium and high experiences of natural hazards. Across all groups there is a similar low pattern of engagement in recreational activities. This may be related to respondents being committed to external recreational commitments or subject to time constraints.
334����������Planning,�building�and�insuring� �
Community Networks Respondents with Low Experience of hazards and their Community Networks (Table 5) Half of the respondents with low experience of natural hazards do not participate in any community events throughout Machans Beach. The main activities undertaken by respondents with low experience of natural hazards include Moon over Machans, the Community Association and assisting SES. Results further indicate that 50% of respondents volunteer when they can. For those who do volunteer two thirds of the cohort do not volunteer regularly. Respondents Medium Experience of Hazards and their Community Networks (Table 6) All respondents with medium experience of natural hazards participate in events within the Machans Beach community. These events include the Garden Project, Moon over Machans, SES, the Community Association as well as the local Sports Club. The majority (7/8) of respondents volunteer for those activities, volunteering when they can. Half dedicate between a couple of hours a week, regularly or whenever required, the remainder do not allocate specific times for the purposes of volunteering. Respondents with High Experience of Hazards and their Community Networks (Table 7) Most (6/7) of the respondents with high experience of natural participate in some event at Machans Beach. The main events include Moon over Machans, the SES and the Sports Club. Over half are involved in regular voluntary projects, but do not volunteer regularly. It may be that high levels of exposure are associated with longer residence, and age of the group. Summary Between the three groups a general consensus demonstrates that most respondents do not participate in regular volunteering efforts. The majority of respondents do participate in community events with the most common activities being Moon over Machans, volunteering with the SES, assisting with the seawall as well and engaging with the community association. Most volunteers participate when they can with most people not designating specific time for the purpose of volunteering. The majority of respondents indicate that they will volunteer when necessary, for example bagging sand bags for the SES in the lead-up to Tropical Cyclone Yasi.
Planning,�building�and�insuring�����������335� �
Table 5: Community Networks of Low Level of Experience of Hazards (N=6) Respondent 1) Which community events at Machans beach do you or your household participate in such as the markets, the community garden project, Folk and roots festival etc.
9
2) Please describe the types of voluntary activities that you participate in within Machans Beach community e.g.: SES, parents and citizens, meals on wheels etc. Y/N
3) How many hours per month would you say you spend volunteering in the Machans beach community? ___hrs
I did participate in the Garden project, however, due to time constraints I no longer donate time. We also attend the Moon over Machans as well.
We help setting up for Moon over Machans
None
14
None
None
None
17
Moon over Machans
I try to help out whenever I can
I volunteer a couple of times a week, I don’t have a job so i am free to help whenever i can.
18
SES; Moon over Machans, Community Association
I volunteer whenever i can
I don’t work; I try to commit on a daily basis to the community association or whenever they need me.
19
None
None
None
20
None
None
None
336����������Planning,�building�and�insuring� �
Table 6: Community Networks of Respondents with Medium Experience of Hazards (N=8) Respondent 1) Which community events at Machans beach do you or your household participate in such as the markets, the community garden project, Folk and roots festival etc.
2) Please describe the types of voluntary activities that you participate in within Machans Beach community e.g.: SES, parents & citizens, meals on wheels etc. Y/N
3
Attend Moon over Machans, events held by the local restaurant, school functions and the massive street parties that occur.
I don’t at the moment, however, I would actively participate in anything that needed doing, e.g.; helping setting up etc. None
5
The sports club acts as the main community support agency/ supporter. Always holds recreational activities, helps to support the school camp. Always holds regular raffles, competitions; contains sport fields, basketball courts and tennis courts.
I help supervise and set things up during Moon over Machans and take care of the raffles sometimes for fund raising events.
7
I attend Moon Over Machans, the school fete I don’t commit on and any functions that occur I do help out with the a daily or weekly within the area. SES from time to time basis
10
I don’t attend any community events.
3) How many hours per month would you say you spend volunteering in the Machans beach community? ___hrs
Maybe a couple of hours a week
I have helped with SES preparations a couple of times
None
12
None
None
None
13
Moon over Machans
I try to help out whenever I can
I volunteer a couple of times a week
Planning,�building�and�insuring�����������337� �
16
SES; Moon over Machans, Community Association
I volunteer whenever I regularly can
21
Moon over Machans
I help to mend and prepare the rock wall
Whenever they need a hand, but I don’t designate time for volunteering usually.
Table 7: Community Networks of Respondents with High Experience of Natural Hazards (N=7) Respondent 1) Which community events at Machans beach do you or your household participate in such as the markets, the community garden project, Folk and roots festival etc.
2) Please describe the types of voluntary activities that you participate in within Machans Beach community e.g.: SES, parents and citizens, meals on wheels etc. Y/N
3) How many hours per month would you say you spend volunteering in the Machans beach community? ___hrs
1
Only Moon Over Machans Not part of any group, Not sure, maybe a however, my partner and I couple of hours. always help the SES during an emergency, such as bagging sand bags.
2
None, I prefer to stick by myself
No
4
‘Anti Progress meeting’, cross section of community.
6
SES- was seen as a huge None social event, containing live music, became the public meeting place.
None
I do a lot with respects to None fixing the rock wall; I am always being praised for maintaining the esplanade wall.
338����������Planning,�building�and�insuring� �
None
None
None
8
I go to the sports club maybe once a month or so. I also attend Moon Over Machans
11
I do go to the sports club A good supporter for the regularly and participate in club raffles and help with sports events that they put on for the kids.
15
Sports club, Moon over Machans, Community Association
help out from time to time
None
its hard to say; I do volunteer from time to time
Risk Perceptions The respondents with low experience of natural hazards undertook the least amount of external research to determine associated risk to property. Results indicate that of the six respondents with low experience of natural hazards, three respondents did not undertake any natural hazard research. The main responses indicate actual awareness of associated risks but may exhibit some complacent behaviour, ‘Cairns is always on the outer impact zone of natural hazards’. Limited experience and knowledge of the actual implications may be responsible for limited research. All had made their own assessment of the risk and appeared to accept the risk. Five of the eight respondents with medium experience of natural hazards possessed the initiative to undertake research relating to natural hazards within the area. The main forms of research include accessing information through council, social media and internet based websites. The respondents with medium experience of natural hazards indicate the highest rate of sourcing information which may be related to increases in experience, but not enough experience to cause complacency. Never-the-less, they appeared to accept the risk. Results of Highly Experienced Respondents for Risk The results relating to respondents with high experience of natural hazards demonstrate a higher level of initiative to undertake research regarding natural hazards within Machans Beach. Four of the seven of respondents indicated undertaking some form of research. The response from the highest experienced candidates expresses more specific responses and a greater knowledge of risk. Specific responses from the highest Experience respondents relate to how they can minimise risk, such as altering their property in accordance with the risk, such as analysing ground composition, and Planning,�building�and�insuring�����������339� �
identifying more frequent events such as swells being more of a risk as opposed to storm surge. That is, they appeared to understand the risk more fully, and accepted that risk. Summary of Risk The results from tables 8, 9 and 10 indicate that 100% of respondents acknowledge a risk of natural hazards when living at Machans Beach. The predominant hazards that were recognised include storm surge, flooding cyclones, high pressure swells, erosion and high tides across all levels of experience. A comparison of results indicates that sourcing information on relation to natural hazards increases with experience. Across all levels of experience; the use of internet and speaking directly with council were the predominant forms of accessing information. Specific search engines that were used include the Bureau of Meteorology and Google. The responses from low and medium experienced candidates were concerned with the overall hazard; such as the effects of storm surge or flooding.
Table 8: Perceptions of Risk of Respondents with Low Experience of Natural Hazards (N=6) Respondent 1) Did you do any research about where the house is located in relation to any potential natural hazard threats such as cyclones, storm surges, tsunami and earthquakes etc? 9 I did check to see what sorts of cyclones have made contact with Machans Beach; we always seem to be on the outer impact zone, never a direct hit. 14 No I did not do much research at all, I know that Cairns is likely to be impacted by floods and cyclones, it is a part of where we live.
2) What 3) Did your 4) Did you information did you research find make your source? you vulnerable own to hazards? assessment of the associated risks? Internet sites relating to cyclones within the area.
We are likely YES to experience erosion, storm surge and cyclones.
N/A
Anything YES associated with living along the coastline, such as swells, storm surge, erosion, high wind.
340����������Planning,�building�and�insuring� �
17
18
19
20
I did not have to do much research; you accept that weather events are just a part of living within North Queensland. I did not do any research, we are aware that flooding and the risk of cyclones and storm surge events is a part of living within Machans Beach No research was undertaken, aware of associated risks Extensive research for the area, to make ourselves aware of what we may be up for.
Internet and Storm surge, sought advice from flooding, the council. swells
YES
N/A
I did not YES undertake any research, we were aware of associated risks.
Not at all
Storm Surge, YES Flooding, Cyclones Flooding, YES storm surge, swells, high tides, Erosion, Cyclones
We checked with the council and asked around the neighbourhood to ask about the risk of flooding.
Table 9: Perceptions of Respondent Risk (Medium Level of Experience of Hazards) (N=8) Respondent 1) Did you do any research about where the house is located in relation to any natural hazard threats such as cyclones, storm surges, tsunami and earthquakes
2) What information did you source?
3) Did your research find you vulnerable to hazards?
3
Council, Internet
I knew when we Yes bought this house that we would be subject to flooding, we built a raised outdoor area to protect the house.
Yes, I found out the associated risks with flooding, the history of cyclone damage and storm surge within the area.
4) Did you make your own assessment of the associated risks?
Planning,�building�and�insuring�����������341� �
5
My main concern was that Machans Beach is built on a delta, therefore, this makes us extremely vulnerable. It is difficult for people to access here during a flood. If we lose power we may lose it for a week, as it would take that long for Ergon to be able to get to us.
Yes Yes, we were aware that the area is subject to the risk of cyclone and flooding. We also know that the area is subject to storm surge but we would leave straight away if a storm surge was to occur within the area.
7
I was aware of cyclones Internet and the dangers related associated. I am aware of sites the risk associated with living along the beach.
Yes of course, Yes particularly to storm surge and cyclones.
10
I did check to see what Council sort of cyclones has made website contact with Machans Beach, we always seem to be on the outer impact zone.
Machans Yes Beach is subject to cyclones, the purpose of the rock wall is to minimise erosion.
12
No I did not do much research at all, I know that Cairns is likely to be impacted by floods and cyclones, it is a part of where we live.
13
16
Flooding and cyclones
Yes
I did do a fair bit of Internet, research;Machans Beach Council floods all the time. My greatest concern is being flooded in with a storm surge event on the way.
Storm surge, cyclones, high wind energy, swells, erosion, flooding.
Yes
No research was undertaken
Storm Surge, Flooding
Yes
342����������Planning,�building�and�insuring� �
N/A
N/A
Table 10: Perceptions of Risk for Respondents with High Level Experience of Hazards (N=7) Respondent 1) Did you do research about house location in relation to any potential natural hazard threats such as cyclones, storm surges, tsunami and earthquakes etc?
2) What information did you source?
3) Did your research find you vulnerable to hazards?
1
I used common sense, I have always been aware of king tides, however, when you live along the beachfront you must have some accepted risk.
Spoke to council, maybe used the internet at the time.
You don’t live in the tropics for nothing, it is hot and there is always so much humidity Yes so you have to expect that there is some associated risk
2
No I did not, I know that there is an associated risk
N/A
There is some risk to flooding and Yes cyclones
4
My absolute main priority before I sign a contract (is) great insurance despite the cost, so that if I did lose everything to a natural disaster I would be able to receive some form of compensation.
NIL
I would ensure that YES I buy a high house with metal not wooden stumping. I would need to know ground composition, and if sand I would not buy beachfront.
6
Yes, I did undertake a fair bit of research within the area.
Internet, BOM, Google
I found out that swells are more frequent than surges. I rely on the fact that 364 Yes days a year are bliss. The problem is water will come over the sea wall during an event.
4) Own assessment of the associated risks?
Planning,�building�and�insuring�����������343� �
8
11
15
If you choose to live on the beach you accept some form of risk, I did not have to do any research. If you choose to live in a beach community that you accept that you are likely to experience storm surge or cyclones. I know that flooding is a potential threat; nearly every wet season both main access roads become blocked, flooding is a part of living here
I spoke to council before we moved in
Yes, we are susceptible to flooding, storm surge and cyclones Yes
N/A
I did a fair bit of Internet, research; I looked at Council the past history of cyclone events and flooding. My concern is being flooded in, with a storm surge on the way.
Storm surge, cyclones and erosion Yes
Storm surge, cyclones, high wind energy, swells, erosion, flooding.
Yes
Knowledge and Understanding Knowledge and Understanding of Respondents with Low Experience of Hazards Most of the respondents (5/6) with low experience of hazards were aware that a current storm surge warning system does exist and are also aware of what emergency procedures should be followed during an emergency. This enhanced knowledge and understanding may be related to the recent exposure of the events of Tropical Cyclone Yasi, where evacuations were mandatory at the time. Two thirds of these respondents regard Machans Beach as having a high risk of storm surge events, with the remainder recognising a medium risk. Four out of the 6 respondents would leave upon the request of authorities, whilst the other two would assess the situation before evacuating. Results of Medium Experienced Respondents for Knowledge and Understanding Seven of the eight respondents with medium experience of natural hazards show that were aware of the existence of current storm surge warnings in place. One person was 344����������Planning,�building�and�insuring� �
unsure, but felt that if there is no system, that there should be one in place. The majority (6/8) of these respondents recognise Machans Beach as being of high risk, one viewed the risk as medium, and another as low. The person who saw the risk as low this candidate indicated that the rock wall should provide adequate protection. The results for evacuating upon the request of authorities represent similar outcomes, with the majority (7/8) leaving upon request of authorities, one saying it depended on situation and one refusing to leave, to stay and defend property. Results of Highly Experienced Respondents for Knowledge and Understanding The results from respondents with high experience of natural hazards show that all respondents would evacuate upon the request of authorities, indicating the risk is too high. This group represents the lowest understanding of responding to natural disasters with 3/7 unsure of procedures and the remaining four listening to the request of authorities. Five of the seven view Machans Beach to be at high risk of storm surge with the remaining two acknowledging a moderate risk. Summary of Knowledge and Understanding It appears that the majority of all respondents are aware of current storm warning systems in place which may be related to the recent experience of mandatory evacuations, in particular cyclone Yasi. Results further show that respondents with medium experience of natural hazards contain the highest level of knowledge and understanding relating to emergency procedures and evacuations as most (6) respondents indicating that one must always listen to the advice of authorities; Respondents with High Experience of Natural Hazards indicate the lowest understanding of responding to natural disasters which may be related to complacency caused by extensive experience to natural disasters and reduced acknowledgement of authorities regarding evacuations. Storm Surge The most common responses regarding evacuation upon the request of authorities indicate that the majority (16/21) of respondents would leave without hesitation. Most respondents indicated that disregarding warnings and an evacuation from authorities is inappropriate, indicating a level of angst to those who disregarded warnings (respondent 1). The remaining five respondents would choose to stay and defend their property. Three out of those five respondents indicated that their choice to stay and defend is entirely dependent upon the severity of the situation. The remaining two respondents are adamant that they will stay and defend their property regardless of the advice given by authorities. These respondents indicated a high regard for material possessions.
Planning,�building�and�insuring�����������345� �
Table 11: Stated responses to a proposed storm surge evacuation Question 22 If a storm surge was to occur and you were told to evacuate from your home do you feel you would be safe to stay and defend your property, or would you leave upon the request of the authorities? Reasons
Number of Respondents
Stay and Defend
3
Selected Quotes
-
‘It is entirely dependent upon the situation (5). ‘I would stay and defend my property with no hesitation at all. That is all I have’. (Respondent 16)
-
‘Would wait first on the advice given from authorities, before evacuating’. (Respondent 15) ‘I would go straight away, I have kids and they would be my priority’. (Respondent 8). I would not hesitate to leave at all. It would be foolish to stay, why authorities should have to risk their life’s to save others if people choose not to abide by mandatory evacuations (Respondent 1)
2 Evacuate
16
-
The effects of storm surge on Machans Beach The most common responses in relation to the types of effects a storm surge event is likely to have on Machans Beach include both infrastructural and environmental damage. The Majority (16/21) of all respondents indicated that Infrastructural damage was a definite impact from a storm surge event, along with 5/21 of all respondents indicating that significant damage to the environment would also occur as a result of storm surge. The most common response for infrastructural damage includes the impacts to public infrastructure as well as the rock wall. The most common response for environmental impacts included erosion, rock displacement and damage to the shoreline.
346����������Planning,�building�and�insuring� �
Table 12: Perceived Effects of Storm Surge on Machans Beach Question 26) If a storm surge was to occur in Machans Beach what sorts of effects do you think it could have to the Machans beach area? Reasons
Number of Respondents
Selected Quotes
Infrastructural Damage
16
‘Infrastructural damage, dependent entirely on severity’. (Respondent 2) ‘There would be damage to buildings, public infrastructure, and the rock wall’. (Respondent 17). ‘Infrastructural damage, loss of housing’. (Respondent 4).
Environmental Damage
9
‘Infrastructural damage, dependent on severity, but the foreshore would most likely be destroyed; community displacement’.(Respondent 3). ‘I would expect there to be extensive damage to the shoreline from, erosion.’ (Respondent 19). ‘Think there would be severe damage to the natural coastline, increases in erosion, damage to rock wall and standard infrastructural damage to inland.’ (Respondent 12).
Discussion Adaptive capacity is an essential component of determining the level of resilience within a community. Based on the concept of adaptive capacity, four variables have been identified for the purpose of this study to test how these traits influence community resilience including knowledge and understanding, social cohesion, risk acceptance and community networks. Each of these variables were examined based on the individual’s experience with natural disasters at Machans Beach as well as throughout their lifetime. Results of the study support the notion that the level of community resilience varies with the level of hazard experience respondents possess. Increased exposure to natural hazards facilitates a heightened level of risk perception as the highest experienced respondents are most likely to leave or evacuate on the request of authorities. This is because repeated experience may have taught people to Planning,�building�and�insuring�����������347� �
avoid adverse experiences based on the skills and emotional impacts from past events. The majority of respondents with low experience of natural hazards and respondents with medium experience of natural hazards would also leave upon the request of authorities, however, with some exceptions - some residents are likely to only evacuate based on the severity and situation of an event. This may be related to the idea that although some respondents may have some experience to natural disasters, they may not have been fully exposed to the impacts of a storm surge, with one respondent indicating that they are always on the outer impact zone of a severe natural hazard. It appears that although all residents have experienced at least one natural disaster and a mandatory evacuation as a result of Tropical Cyclone Yasi, they avoided being subject to the full impact or severity of the event. The community having prepared their properties for Tropical Cyclone Yasi and left upon the request of authorities only to find that Machans Beach was subject to only minimal damage created a level of complacency and sense of biased optimism. Sattler et al (2000) recognises that residents in areas that incur near misses or a ‘false alarm’ may develop an optimistic bias or a false impression that similar disasters will not strike within the associated area again (Suzuki 2011). The results suggest that the majority of the community recognises the existence of a current storm surge warning system within the Cairns region. Those with minimal experience demonstrate the highest understanding of the current procedures involved indicating that listening to authorities during an event is the most effective method in place to maintain personal safety and levels of preparedness; due to heightened levels of anxiety created by Tropical Cyclone Yasi, those with the least experience are likely to be more attentive. Most respondents with greater experience and exposure to natural hazards indicate that they have developed their own individual coping mechanisms, and usually disregard absolute advice from authorities. Most of the respondents have multiple experiences of flood, cyclone and storm surge events and are aware that they are living within a physically vulnerable location subject to storm surge inundation and flooding. Two thirds of these groups of respondents recognise the area as possessing a high risk to storm surge events, with one third recognising a medium risk. There was one resident who indicated that Machans Beach was subject only to low risk creating a mixed perception within the community likely to be confused by the most contentious issue, the seawall. Most residents seem unaware of the extent of the wall’s actual structural integrity, with the groups demonstrating medium and low views of risk indicating that the wall would provide adequate protection against storm surges. Those who indicated a high risk found it important to physically point out parts of the wall that were subject to erosion or current failure, suggesting that during a storm surge event the wall could initially collapse and provide only minimal protection and safety. Residents indicated that during swells and minor storm surge events they have witnessed movement and the sounds of cracking, reducing the level of confidence in the wall’s structural integrity. When analysing individual knowledge and understanding of natural hazards within each group, it is clear that the initiative to increase social memory and understanding increases with the level of experience. The least experienced members of the community are well aware of the risks associated with living in coastal areas, however, are unlikely to carry out external research in relation to these. The initiative to carry out 348����������Planning,�building�and�insuring� �
further research evidently increases with experience as most respondents within these groups sought further information in relation to storm surge risk within the area. This may be caused by respondents with High Experience of Natural Hazards obtaining a level of complacency due to increased knowledge, experience and exposure to natural hazards; more so than respondents with medium level experience with natural hazards. Responses regarding the possible risks associated with natural hazards demonstrate distinct and different results between respondents across the three categories of natural hazards experience (low, medium and high). Responses from respondents with high experience of natural hazards exhibited more specific strategies relating to how to better prepare for a disaster and examined specific threats such as ocean swells, whilst the remaining groups responded outlining potential impacts without mitigation or preparedness responses. The main forms of research were sourced through council, social media and other internet-based websites such as the Bureau of Meteorology. The most recognised natural hazards within the area across all levels of experience include storm surge, flooding, cyclone events, high pressure swells, erosion and high tides, all of which are the most frequent natural hazard events that occur within the area. The social ties and cohesion within a community help to identify the extent of the relationships that exist to determine how they will react under stress to dealing with natural hazards. Every respondent recognised Machans Beach as being a close knit community. There is a general consensus that the area is characterised by tradition, a friendly and positive outlook within the community combined with a mixed and multicultural demographic. Social cohesion tends to increase with the level of natural hazards experience, which may also be related to longevity of residence within the area. Those residents who have experienced several natural hazards have engaged themselves within the community before, during and after an event increasing social opportunities and interaction with other residents. It is clear that there is a definite perception of social cohesion within Machans Beach, however as noted earlier, actual engagement in recreational activities other than visiting residents is relatively low with the majority of all residents not engaging in any recreational activities within the community. With levels of volunteering above the State average, it is clear that the community possesses a high sense of ‘belonging’, suggesting that during a storm surge event or natural hazard, the community is likely to aid and assist one another. Stubbs (2011) indicates that a community possessing high volunteering rates are likely to show higher levels of empathy towards one another during a natural hazard event. When examining whether the community would return to rebuild within Machans Beach if the area was subject to significant storm surge events similar to Tropic Cyclone Yasi related events at Tully Heads, the responses varied. The majority of residents indicated that it would be entirely dependent on the situation at the time. Other responses indicated that a large proportion of the community would not return with some residents stating (in summary) that they have “had their time within a coastal setting, and that a severe hazard event would indicate it is time to move”. Others mentioned that they would consider moving back, with the exception of a death or mass destruction within the community as a result of a severe weather event. Planning,�building�and�insuring�����������349� �
From these responses we can conclude that a death or complete devastation within Machans Beach could have significant effects upon the social structure, emotional impact and level of resilience within the community. If residents chose to leave the community after a severe event, this would tend to indicate that the community is unable to return to the ‘pre-disaster’ state, and a reduced level of community resilience. Conversely it would indicate a higher level of individual resilience as individuals physically remove themselves from the risks associated with severe natural hazards. The results also indicate that level of experience directly influences people’s ability to perceive the risks associated with storm surge events. Residents possessing higher levels of resilience are the most likely group to leave upon the request of authorities without hesitation as well as sourcing external information to enhance social memory. This is related to the ability to avoid any unnecessary risk caused by awareness of the potential consequences from past natural hazard events. The least experienced residents are more likely to be less prepared and avoid undertaking any further education or external research due to higher levels of complacency. However, this cohort possesses the highest level of understanding of current emergency procedures in place, which is directly linked to the experiences associated with the Tropical Cyclone Yasi. Medium experienced groups possess a greater overall understanding of natural hazards than those with low experience: however, they are less likely to possess the high levels of self reliance that are evident within the highest experience groups. Within the latter category some respondents indicated a disregard of advice from authorities, as they have over time developed their own mechanisms to cope. Conclusion Machans Beach provides an important case study for community responses to natural hazards. This study of people in Machans Beach directly affected by storm surge indicates a propensity to tolerate the risk despite knowledge about and experience of the risks. This appears to be related to choice of lifestyle, commitment to place and community. As was noted earlier, relevant land use planning processes are limited in their capacity to support the adaptation of human settlements to climate change in areas which already have development rights.
350����������Planning,�building�and�insuring� �
References Apan, A., Keogh, D.U., King, D., Thomas, M., Mushtaq, S. and Baddiley, P. 2010, “The 2008 Floods in Queensland: A Case Study of Vulnerability, Resilience and Adaptive Capacity: A Final Report Submitted to NCCARF”, Toowoomba, Queensland. Cairns Regional Council. 2006, ‘ Demographic, Social and Economic Profile of Cairns Regional Council’. Accessed 14 August, 2010, . Cairns Regional Council. 2011, ‘Storm Tide Evacuation Guide: Area 2 – Trinity Beach to Machans Beach, Map 2’. Accessed on 12 September, 2010, . Drabek, T. 1996, ‘The Social Dimensions of Disaster: an Inventory of Sociological Findings’,Springer, New York. Flyvberg, B. 2001, ‘Making Social Science Matter: Why Social Inquiry Fails and how it can Succeed Again’, Cambridge University Press, Cambridge, UK. Granger, K. 1999, ‘Community Risk in Cairns: A multi Hazard Risk Assessment’. Australian Geological Survey Organisation. Harwood, S. 2010, ‘Planning for Community Based Tourism in Remote Areas’. Unpublished PhD thesis, Charles Darwin University, Northern Territory Australia. Litman, T. 2011, ‘Planning, Principles and Practices’. Victoria Transport Policy Institute. Morrow, B.1999, ‘Identifying and Mapping Community Vulnerability’, Disasters, vol. 23, no.1, pp.1– 18. Paton, D. 1994, ‘Disasters, communities and mental health; psychological influences on long term impact’, Community Mental Health in New Zealand, vol. 9, no. 2, pp. 3-14. Sattler, D. Kaiser, C. And Hittner, J. 2000, ‘Disaster Preparedness: relationships among prior experience, personal characteristics and distress’, Journal of Applied Social Psychology, vol. 30, no. 7, pp. 1396 – 1420. Stevens, M. Song, Y. and Berke, P. 2010, ‘New Urbanist developments in flood-prone areas: safe development, or safe development paradox?’, Journal of Natural Hazards, no. 53, pp. 605–629.
Planning,�building�and�insuring�����������351� �
Stubbs, A. 2011, ‘As Yasi Beefs Up, NQ Graziers Prepare for Long Term Impacts’, Agforce, accessed 21 September, 2011 < http://www.agforceqld.org.au/file.php?id=874&open=yes>. Symes, D. Akbar, D. Gillen, M. Smith, P. 2009, ‘Land Use Mitigation strategies for Storm Surge Risk in South East Queensland, Australian Geographer, 40: 1, 121 – 136. Tierney, K. Lindell, M. And Perry, R. 2001, ‘Facing the Unexpected’, Altimira Press, London.
352����������Planning,�building�and�insuring� �
10.5 Building - Windstorms damage to houses in Australia This section summarizes the findings from some recent damage investigations carried out by the CTS, and highlights recurring issues that arise with respect to performances of houses and the provisions in the NCC and relevant Standards. Tropical cyclones Althea and Tracy impacted the Northern Australian towns of Townsville in 1971 and Darwin in 1974, respectively. These events, especially Tropical Cyclone Tracy caused significant damage to domestic housing as detailed by Walker (1975) and Leicester and Reardon (1976). As a consequence, regulations were introduced to improve design and construction of housing to be able to withstand cyclonic wind loads. Evidence of the resulting improvements to housing standards is found from the comparatively better performance of newer construction in recent windstorms. However, shortcomings in some aspects of design and construction mean that there is still a risk to contemporary housing, including those in non-cyclonic regions. A significant proportion of roller doors in newer buildings failed under wind loads resulting in dominant openings. Wind damage was more widespread among buildings that were built prior to the release of the Queensland Home Building Code Appendix 4. In many cases, these buildings had been refurbished since the 1980s, but structural details remained the same. Guidance for reconstruction is available from publications such as HB132.2 (2010). CYCLONIC EVENTS TR27 Tropical Cyclone Winifred (Reardon et al. (1986)) Tropical Cyclone Winifred crossed North Queensland coast near Innisfail (Region C according to AS/NZS 1170.2) on 1 February 1986. It was the most damaging cyclone in Queensland since cyclone Althea. Wind gusts in the order of 30 m/s or more were experienced over a front of about 150 km between Cairns and Cardwell. The maximum wind gust speeds were estimated to have been in the order of 50 m/s. Damage to buildings was generally less than original estimates, and houses built to new regulations suffered little damage. Older buildings often had roofing removed frequently with battens still attached. TR48 Tropical Cyclone Vance (Reardon et al. (1999)) Tropical cyclone Vance hit the small Western Australian township of Exmouth (Region D according to AS/NZS 1170.2) on 22 March 1999. The Bureau of Meteorology designated Vance a category 5 cyclone, and it recorded a gust wind speed of 267 km/h (74 m/s) at Learmoth Airport 35 km south of Exmouth. The wind speeds impacting the buildings in Exmouth were estimated to range between 55 and 69 m/s. About 70% of the houses had virtually no damage. Transportable houses performed poorly. The newer houses performed better than the average. However, water ingress caused significant damage to contents even in houses that did not suffer structural damage. TR50 Tropical Cyclone Ingrid (Henderson and Leitch (2005)) During March 2005, Cyclone Ingrid travelled across parts of Queensland, the Northern Territory and Western Australia (Region C according to AS/NZS 1170.2) before degenerating into a rain depression. The Bureau of Meteorology classified this cyclone Planning,�building�and�insuring�����������353� �
as varying in intensity between Category 3 and Category 5 during its erratic path across the three states. Cyclone Ingrid mostly tracked across sparsely populated areas and so the potential for damage to housing and infrastructure was limited. The damage survey focusing on the small Minjilang community of about 300 residents found that gust wind speeds were about 200 to 250 km/h (55-70 m/s). Most houses resisted wind forces, and failures that were observed, were attributed to inadequate, missing or corroded structural components. However, there was extensive tree and vegetation damage. TR51 Tropical Cyclone Larry (Henderson et al. (2006)) Tropical Cyclone Larry made landfall on 20 March 2006 near Innisfail in North Queensland (Region C according to AS/NZS 1170.2) causing significant damage to buildings in the surrounding areas. A survey of nearly 3000 houses, conducted by the Cyclone Testing Station and GeoScience Australia enabled quantification of the housing stock and the extent and types of damage sustained. The peak gust wind speeds in the study area were estimated at 50 to 65 m/s. Damage to the housing stock was estimated at about 20% (excluding water ingress). Contemporary (Post 80s) housing fared considerably better than older housing, reflecting marked improvement of construction detailing and better structural condition, and satisfactory performance of relevant standards. Failure of roller doors, loss of roof battens when fastened to rafters with one or two nails and loss of rafters or trusses when anchored to top plates with skew nails only, were common. Houses on or near hill-tops that did not have fixings to account for higher wind speed caused by topography had significant damage. Debris impact caused damage, whilst some window and door fixings failed under wind load. Structural component failures of under-designed cold formed steel sheds and garages were also widespread. Tropical Cyclone Larry was a fast moving event; hence, minimizing the potential for fatigue failure of metal cladding, debris impact as well as reducing the period in which rain was being driven into buildings. TR52 Tropical Cyclone George (Boughton and Falck (2007)) Tropical Cyclone George crossed the Pilbara coast east of Port Hedland in WA (Region D according to AS/NZS 1170.2) on 8 March 2007. The period of high winds lasted for four to five hours. Estimates of the maximum gust wind speed were up to 270 kph (~75 m/s). Fewer than 2% of buildings sustained structural damage. The worst structural damage observed was loss of the roof in older buildings. Structural damage was caused by deterioration of older structural elements, inappropriate re-roofing practices, not following current practice for this area, failure of non-structural elements such as flashings and trims. Most buildings constructed to current codes and standards performed well though there were some concerns about light gauge metal trusses and battens. TR56 Tropical Cyclone Ului (Henderson et al. (2010)) Tropical Cyclone Ului travelled across the islands of the Whitsunday group, including Hamilton Island and crossed the coast in the early hours of 21 March 2010 with its eye passing over Proserpine in Queensland (Region C according to AS/NZS 1170.2). The 354����������Planning,�building�and�insuring� �
peak gust wind speeds in the coastal regions surveyed were estimated to be in the order of 140 to 160 km/h (~45 m/s). There was minimal structural damage, and in the few cases where structural failures were caused by wind loading, the damage was attributed to inadequate, missing or corroded structural components. Wide spread tree and vegetation damage (i.e. fallen trees) led to some structural damage. There were many instances of failures of ancillary elements such as flashings, guttering, advertising signage, shade-cloth and vents. TR57 Tropical Cyclone Yasi (Boughton et al (2011) Tropical Cyclone Yasi (TC Yasi) made landfall in the early hours of Thursday 3 February 2011 with the eye passing over the Mission Beach region. The maximum wind gusts at the standard 10 m reference height in flat open country (i.e. Terrain Category 2 per AS/NZS 1170.2), were estimated to be 140 to 225 km/h with a 10% error margin, across the area stretching from Townsville to Innisfail. The cyclone was a very large system and so affected a wide area. In general, contemporary (Post-1980s) housing that was correctly designed and constructed in accordance with the building regulations introduced in the 1980s performed well, with less than 3% of all of Post1980s housing in the worst affected areas experienced significant roof damage. However, roller doors and tiled roofs did not perform well and water entry was an issue for all housing; the report makes recommendations for improvements in each case. In contrast more than 12% of all Pre-1980s housing had significant roof damage. The report recommends changes to AS 4055 with respect to calculating topographic classes and also suggests an investigation into requirements in AS/NZS 1170.2 for determining internal pressures in tropical cyclone-prone areas. Another key recommendation was to consider construction of a ‘strong compartment’ within each residence for protection of life in case the building envelope is breached by large windborne debris. The report also highlighted the inadequacy of the sparse anemometer network along the tropical coast and recommended the establishment of more anemometers to provide better coverage during tropical cyclone events. A destructive storm surge was recorded between Clump Point and Lucinda but fortunately it did not coincide with a high tide. The report recommends planning and development of new construction guidelins for buildings within the stormtide zone. NON-CYCLONIC EVENTS Dubbo Thunderstorm A damage investigation was conducted by AGSO and CTS in the Eastern suburbs of Dubbo (Region A according to AS/NZS 1170.2) following a thunderstorm on 6 January 2001. The peak gust wind speed was estimated to be about 40 m/s, and there was significant damage to residential and commercial structures due to the wind load, debris impact, heavy rain and hail. The survey of housing, showed that approximately 5% suffered structural damage, mostly to tiled roofs from wind loads and debris impact, compared to the more extensive damage suffered by commercial and industrial buildings. Most of this damage was instigated by the failure of windows or doors generating large internal pressures. The poor performance of engineered construction
Planning,�building�and�insuring�����������355� �
is attributed to application of low internal design pressure based on the assumption that the buildings would remain nominally sealed. TR54 Perth Tornadoes (Boughton and Falck (2008)) Outer suburbs of Perth in WA (Region A according to AS/NZS 1170.2) experienced tornadoes from two separate events in June 2008. Both tornadoes damaged buildings and vegetation. Although tornadoes are not covered in AS/NZS1170.2, the estimated wind speeds generated by the tornadoes were similar to or less than the design wind speed for all affected houses. Deficiencies in structural capacity were noted in the batten to rafter connections, rafter to top plate connections, roof structure connections, top plate to masonry connections and verandah details. This investigation also showed that some houses were given incorrect site wind classifications. Even short duration wind events such as tornadoes generate wind borne debris. Some of this debris was instrumental in causing internal pressurization, which in turn lead to significant structural damage. In other cases, failure of doors and windows lead to internal pressurization. TR55 Brisbane Storms (Leitch et al. (2009)) The Bureau of Meteorology recorded a significant level of storm activity in the SouthEast part of Queensland (Region B according to AS/NZS 1170.2) during the period 16 to 20 November 2008. These storms caused damage to housing in many parts of Brisbane, where the peak gust wind speeds were estimated to about 45 m/s. Street surveys performed on a sample of houses in The Gap (suburb of Brisbane) indicated that Post 1980 houses performed better than Pre 1980 houses. The most common types of damage observed was caused by falling trees, and water ingress, either through failed doors or windows, or by differential pressure across doors or windows that had not failed, or through intact unsarked tiled roofs. Structural failures resulted from inadequate tie-down, wind borne debris breaking windward windows or doors causing an increase in internal pressure, sometimes leading to more damage, some cases of windows or doors not being adequately fixed to their supporting structural members and allowing the complete door or window to fail.
356����������Planning,�building�and�insuring� �
10.6 Insuring: Case Study, Insurer Survey
QUESTION SHEET: OPEN-ENDED INTERVIEWS INTRODUCTORY What is the organisation in which you work, and the role and responsibilities you have there? CLIMATE CHANGE Is climate change an issue that informs what you do, and if so, in what ways is it influencing current practice for you and/or your organisation? Do you work in the area of natural disaster mitigation or adaptation, and is this difference significant to you? BUSHFIRE AND OTHER NATURAL HAZARDS What about preparations for the future, and the possibility of increases in the intensity of natural hazards? Are there any hazards that especially present as issues for your organisation? Are bushfires perceived as a risk, and how is this risk being managed in current operations? What about other event types such as wind gusts, rain storms, cyclones and storm surge? INSURANCE AND OTHER ADAPTIVE MECHANISMS Is there a role for insurance in our adaptation of the built environment to climate change? What is the main way that insurance operates to protect buildings against disaster? How well or poorly has it performed to date? In what ways might we improve its effectiveness? What about other adaptive mechanisms such as building codes and planning regulations? ACTORS AND NETWORKS Who are the key stakeholders that are already or need to be further involved in this area? What about the different levels of government, and the interactions amongst them and with others including the private sector? Do you have any other comments or question to add? Thank you for your time and input.
Planning,�building�and�insuring�����������357� �
10.7 List of Acronyms
ABC
Australian Broadcasting Corporation
ABCB
Australian Building Codes Board,
ABI
Association of British Insurers
AEMI
Australian Emergency Management Institute, Mt Macedon
AEP
Annual Exceedence Probability
AFAC
Australasian Fire Authorities Council
AHD
Australian Height Datum
ARC
Australian Research Council
ARI
Annual Return Interval
AS/NZS
Australian Standards/New Zealand Standards
ASIC
Australian Securities and Investment Commission
BCA
Building Code of Australia,
BoM
Bureau of Meteorology
CCC –
Cairns City Council (Cairns Regional Council)
CCRIF
Caribbean Catastrophe Risk Insurance Facility
CDS
Centre for Disaster Studies
CFA
Country Fire Authority
COAG
Council of Australian Governments
CRC
Cooperative Research Centre
CSIRO
Commonwealth Scientific and Industrial Research Organisation
CTS
Cyclone Testing Station
DCS
Department of Community Safety, Queensland
DPAC
Department of Premier and Cabinet
EMA
Emergency Management Australia
EMQ
Emergency Management Queensland
358����������Planning,�building�and�insuring� �
EU
European Union
FCI
(Queensland) Floods Commission of Inquiry 2012
GA
Geoscience Australia
GDP
Gross Domestic Product
GIS
Geographic Information System
HACRU
Housing and Community Research Unit
ICA
Insurance Council of Australia
ICT
Information and Communications Technology
IPA
Integrated Planning Act (Queensland)
IPCC
Intergovernmental Panel on Climate Change
JCU
James Cook University
LVRC
Lockyer Valley Regional Council
NCC
National Construction Code
NCCARF
National Climate Change Research Facility
NFIP
National Flood Insurance Program (USA)
PPRR
Prevention, Preparedness, Response and Recovery
Q100
Queensland 100 year flood, or 1% AEP
QRA
Queensland Reconstruction Authority
RAC
Royal Automobile Club
SPA
Sustainable Planning Act (Queensland)
SPP 1/03
State Planning Policy 1/03(Queensland)
SPSS
Statistical Package for the Social Sciences
TCCIP
Tropical Cyclone Coastal Impacts Program
TFS
Tasmanian Fire Service
UK
United Kingdom
USA
United States of America
UTAS
University of Tasmania
Planning,�building�and�insuring�����������359� �
10.8 Glossary Accommodate a cost effective, transitional approach to hazard adaptation for areas containing vulnerable coastal infrastructure which involves the alteration of infrastructure to allow surge water to pass through a community with minimal obstruction, thus reducing the extent of damage to infrastructure. Adaptive Capacity the ability of a socio-economic system (community) or environment to adapt to the adverse affects of climate change. AS/NZS 1170 Australian Design Standards – The suite of design standards that specify minimum structural Structural Design Actions (including, calibrated combinations of factored, permanent, imposed and wind actions (loads) to be applied for structural design. Other standards (i.e. AS 4055 - Wind Load for Housing) are also used for house design. Australian Building Codes Board (ABCB) formulates building regulations that are administered by State and territory governments in Australia, to ensure that infrastructure and housing are built to an acceptable level of performance. Building regulations and design standards are used to design buildings to an acceptable level of risk. Reliability theory incorporating probabilistic descriptions of loading and capacity is applied in structural design. Catastrophe or cat bonds are risk-linked securities transferring specific risks from a sponsor to investors. They can lessen the risks for insurers if a major catastrophe incurs damages that they are unable to cover. Community resilience The capacity of a community to adapt in order to sustain an acceptable level of function, structure, and identity. Damage investigation is a field study carried out following a windstorm to assess the wind field (i.e. wind speed pattern) and structural performance of structures (i.e. the various house types) in the areas affected by the windstorm. Engineering Vulnerability Modelling is the method used for assessing structural vulnerability and incorporates reliability techniques including the probabilistic descriptions of the load, structural capacity and structural response. Hazard Mitigation is a term used by emergency management to encompass strategies and practices that will reduce the impact of a hazard people, structures and communities. Home insurance: Home insurance or homeowners insurance is a form of property insurance providing cover against damage or destruction of a policyholder's home. It may not cover some risks, such as flood or earthquake, which can require additional or separate coverage. Contents or inventory must often be purchased under a separate policy. House type is the description of the characteristics of housing-stock in a region that specifies the shape, size, cladding type, window size, roof shape and slope, materials, 360����������Planning,�building�and�insuring� �
method of construction, and age. Each of these parameters influences the vulnerability of a house to wind damage. The house types are categorised as Pre-1980s and Post1980s houses. Insurance is a form of risk management for hedging against possible but uncertain loss in the future. Funds paid in by many insured entities are pooled for use in covering any losses some of them might incur. The charge for coverage enables risk transfer on the basis of an event’s calculated frequency and severity. National Construction Code (NCC) is produced by the ABCB, and specifies the level of risk for building performance with the primary objective of safeguarding people from injury arising from structural failures, and preventing loss of amenity and the protection of property. Planning scheme is a strategic plan prepared by a local government council under planning legislation. Preparedness The capacities and knowledge developed by governments, professional response organisations, communities and individuals to anticipate and respond effectively to the impact of likely, imminent or current hazard events or conditions. Preparedness is typically understood as consisting of measures that enable different units of analysis—individuals, households, organizations, communities, and societies— to respond effectively and recover more quickly when disasters strike. Property insurance provides financial protection against risks that might affect property. It applies to all types of property and includes the insurance of such buildings as private domestic dwellings. Protect The protection of vulnerable coastal infrastructure generally involves the implementation of structures or strategies aimed at maintaining coastal assets or infrastructure in their current location. Reinsurance is insurance purchased by an insurance company from a reinsurer for risk management purposes. The reinsurer can be a specialist reinsurance company, conducting only reinsurance business, or another insurance company. Retreat Planned or managed retreat involves a decision, primarily by state and local governments, to withdraw, relocate or abandon infrastructure and development within coastal hazard zones. Risk transfer Insurance operates through the equitable transfer of risk. The insurer, or insurance carrier, sells the insurance whereas the insured, or policyholder, purchases a policy with the amount charged, the premium, providing a certain amount of insurance coverage. Structural adaptation is the structural measure used for improving the performance of the structure. This is usually accomplished by increasing the structural capacity of weak elements in a structural system. Wind load is a critical design action on a structure resulting from an extreme wind event (e.g. Cyclones, thunderstorms). Planning,�building�and�insuring�����������361� �