Abstract. Band merging extracted point sources observed in multiple wave- length bands is generally done purely on the basis of positional information in.
Astronomical Data Analysis Software and Systems XVI ASP Conference Series, Vol. 376, 2007 R. A. Shaw, F. Hill and D. J. Bell, eds.
Post-Band Merge Utilities Applied to Spitzer Pleiades Data Russ R. Laher, John W. Fowler Spitzer Science Center, California Institute of Technology, Pasadena, CA, USA Abstract. Band merging extracted point sources observed in multiple wavelength bands is generally done purely on the basis of positional information in order to avoid photometric biases. Automated merge decisions can be more optimal with better position estimation and more realistic modeling of positional estimation errors. Unfortunately, extraction software often does not provide the most accurate positional information possible, and so post-band merge utilities have been developed and implemented to refine both the source positions and the error modeling. Subsequent band merging of the refined detections improves the completeness and reliability of the multi-band source catalog. Application to Spitzer Space Telescope mapping observations of the Pleiades star cluster demonstrates some aspects of the improved band merging.
1.
Introduction
Over the last several years at the Spitzer Science Center (SSC), we have developed a number of software tools for merging point sources extracted from multiple-wavelength image data acquired by the Infrared Array Camera (IRAC) and the Multiband Imaging Photometer for Spitzer (MIPS), two of the science instruments onboard the Spitzer Space Telescope. Basic band merging for between two and seven instrument channels or bands is provided by the band merge program1 , which uses decision theory, the positions, and positional uncertainties associated with the multi-band input point-source detections to optimally find the best set of mutually exclusive merges. In quantitative terms of completeness and reliability, this approach yields results that are superior to simple general source association (which uses only positional information to match multi-band point-source detections). A number of post-band merge utility programs are also available, which perform various useful functions. Of direct interest to this paper are the utilities that make use of the band merge output statistics and ancillary information, in order to refine both the source positions and their uncertainties, so that a second pass through the band merge program will yield even better results. There are also utilities to estimate the upper limit of the flux for detections that are absent from certain bands, to estimate completeness and reliability based on Monte Carlo methods, and more. These software tools are now being used by SSC astronomers and legacy science teams (e.g., Shupe et al. 2007). An effort is currently underway at the
1
http://ssc.spitzer.caltech.edu/postbcd/download-bandmerge.html
461
462
Laher and Fowler
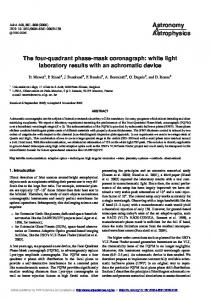
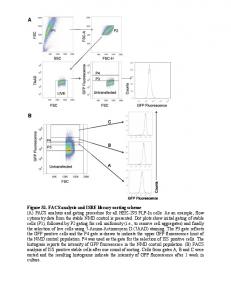
Figure 1. Spatial distributions of point sources extracted from the Pleiades data set for Spitzer IRAC channels 1-4.
SSC to make these software tools available in a GUI environment to astronomers (Pesenson et al. 2006). In this paper, we demonstrate some aspects of post-band merge processing in an application to Spitzer IRAC observations of the Pleiades-star-cluster region. “Before” and “after” cases are presented for direct comparison, in order to illustrate the post-band merge improvements.
2.
Pleiades Data Set
We processed all four channels of IRAC data from AOR 6526464, which comprises mapping observations of a 0.4 × 0.4-degree region in the vicinity of the Pleiades star cluster. The SSC’s Mopex software generated the mosaics and point-source extractions, which numbered 7513, 6957, 2019, and 1999 in channels 1-4, respectively. Figure 1 shows that the spatial distributions of the extracted point sources are fairly uniform over the instrument’s field of view.
3.
Detection Position Refinement
The average position offsets computed by post-band merge utility getoff were subtracted from the detections in IRAC bands 2 through 4 (IRAC band 1 is the reference frame). The input information used by getoff is from the band merge program’s offsets between matched detections for band pairs that have “clean” matches, i.e., no confusion and S/N > 10. The positional uncertainties were adjusted to give average chi-square values closer to the expectation values. Table 1 gives outputs from the post-band merge utility statq. The offsets (AveDX and AveDY) are all improved, except for the AveDY value for the 2-4 band pair, which was already good and remains so. The offsets do not go to zero because the merge patterns change only slightly. The “after” chi-square values went closer to their expected values (which are 1 for ChSqX and ChSqY, and 2 for ChSqXY), but this was somewhat limited by the relatively high band-pair registration uncertainties required to compensate for the non-constant band registration error over the field. The number of clean merges (NSum) increased for all but the 2-4 band pair, where higher band-4 uncertainties caused additional cases of potential confusion, hence fewer clean merges. Another bandmerge run was subsequently performed on the refined positions and uncertainties.
Post-Bandmerge Utilities Applied to Spitzer Pleiades Data Table 1. B-Pa Before: 1-2 1-3 1-4 2-3 2-4 3-4 After: 1-2 1-3 1-4 2-3 2-4 3-4
a b
463
Before vs. after mean discrepancies and chi-square values.
AveDXb
AveDYb
StdDevXb
StdDevYb
ChSqX
ChSqY
ChSqXY
NSum
−0.03788 0.06738 0.17040 0.09337 0.18607 0.06891
−0.02522 0.04367 0.02944 0.03768 0.01456 −0.01142
0.21907 0.33213 0.50466 0.31196 0.47994 0.37556
0.23411 0.33471 0.49079 0.33011 0.47722 0.42162
0.41161 1.35252 1.37929 0.95717 2.02209 0.87378
0.46603 1.29926 1.22884 0.94334 1.43937 0.98559
0.87565 2.65969 2.60548 1.90307 3.47478 1.85641
4743 1170 834 992 1018 652
−0.00081 0.00456 0.02165 −0.00301 −0.00335 −0.02308
−0.00188 0.02288 0.02018 −0.02370 −0.02540 0.00798
0.20912 0.33349 0.51410 0.32617 0.49740 0.38498
0.21273 0.38245 0.50644 0.36626 0.51890 0.45440
0.76063 0.96237 0.93493 0.88277 0.72225 0.61075
0.94136 0.98211 0.93828 0.98109 0.87970 0.71369
1.70134 1.94875 1.87326 1.86635 1.60501 1.32363
4751 1185 833 995 1019 657
B-P stands for band pair. Data units are mosaic pixels (≈ 1.2′′ per side).
4.
Discussion of Before/After Cases
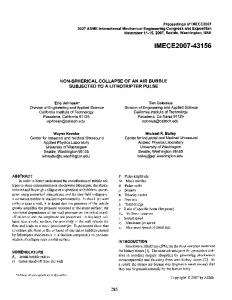
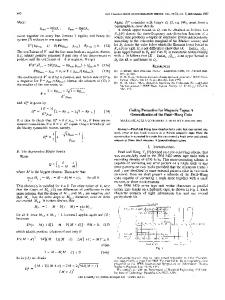
Figure 2 shows four different band merge cases that we routinely encountered, before and after refinement by the post-band merge utilities. The top row of diagrams in Figure 2 shows before post-band merge processing and the bottom row shows the corresponding cases after the refined processing. Case 1. A typical case of a slightly better fit with the same detections before versus after the post-band merge processing. Detections from all four IRAC bands were merged both before and after the refined processing (explicit links are not shown in these diagrams). The processing actually picked up weak links from band 4 to others in band 1 and band 2, so it has the same result with a tighter fit, and also supplied warning information in its confusion status. Case 2. Another typical case like case 1, but here, the refined processing moves the band-1 and band-2 detections from outside both 1-sigma contours for bands 3 and 4 to inside of both. Case 3. Detections from only three IRAC bands were merged before the post-band merge processing (the merged links are shown in the diagrams as black lines joining the detection centers), primarily because of badly underestimated uncertainties in bands 3 and 4. There are two nearby detections in band 1 (not shown in the diagrams), which are bright, but not nearly as bright as the missed “before” detection that was included in the merging after the refined processing. There was, in fact, a total of 19 post-refinement sources containing detections in all four bands that were missing a detection in the pre-refinement merge. Case 4. Similar to case 3, but no disturbing detections in the neighborhood, and the oddball match in this case is from band 3, not band 1.
464
Laher and Fowler
Figure 2. Four different cases for before (top row) and after (bottom row) refinement by post-band merge utilities. The four IRAC channels or bands are labeled in each individual diagram. The relative sizes of the one-sigma positional uncertainty contours of the point-source detections are also depicted. The spatial scales between each before and after case are the same.
5.
Conclusions
Overall, there were 11,371 merged detections before the post-band merge processing and 11,330 merged detections afterwards. The slightly lower number of merges reflects fewer stranded detections left as single-band sources. We found no cases in which a detection in a given band is lost from a source as a result of post-band merge processing. This shows that the refined processing does no harm, at least for this data set. Our planned future work involves a similar analysis of a much larger data set, which should have adequate statistics for generating sufficiently accurate completeness and reliability performance measures. Acknowledgments. This work was performed at the Spitzer Science Center as part of a mission/project managed by Jet Propulsion Laboratory, California Institute of Technology, under a contract with the National Aeronautics and Space Administration. The authors are grateful to John Stauffer for pointing out the band merging challenges of the Pleiades region. References Pesenson, M., et al. 2006, Proc. SPIE, 6271, Paper No. 627112. Shupe, D., Evans, T., Fang, F., Lonsdale, C., Surace, J., & Fowler, J. 2007, in ASP Conf. Ser. 376, ADASS XVI, ed. R. A. Shaw, F. Hill, & D. J. Bell (San Francisco: ASP), 123